
Amazon का मार्केटप्लेस एक विशाल दैत्य है—जो हर साल और बड़ा, और तेज़, और सच कहें तो थोड़ा ज़्यादा डराने वाला होता जा रहा है। 2025 में Amazon की शुद्ध बिक्री तक पहुँच गई, और उस बिक्री का 60% से भी ज़्यादा हिस्सा स्वतंत्र विक्रेताओं से आया। इसका मतलब है ढेर सारी प्रतिस्पर्धा, ढेर सारे अवसर—और अगर आप अभी भी सिर्फ़ बेसिक बिक्री रिपोर्ट्स पर निर्भर हैं, तो ढेर सारे छूटे हुए संकेत भी।
मैंने सालों तक ब्रांड्स और विक्रेताओं को ट्रैफिक और रैंक जैसी सतही मीट्रिक्स से आगे बढ़ने में मदद की है। असली जादू? वह Amazon बिक्री डेटा में है जिसे आप शायद नज़रअंदाज़ कर रहे हैं। सही विश्लेषण के साथ (और थोड़ी ऑटोमेशन से), आप ट्रेंड्स को उनके मुख्यधारा में आने से पहले पकड़ सकते हैं, स्टॉक खत्म होने या ओवरस्टॉक होने से पहले इन्वेंट्री ऑप्टिमाइज़ कर सकते हैं, और कच्चे डेटा को रणनीतिक ग्रोथ इंजन में बदल सकते हैं। चलिए देखते हैं कि इसे असल में कैसे किया जाए—ना किसी डेटा साइंस PhD की ज़रूरत, ना अंतहीन CSV डाउनलोड्स की, और ना ही अंधेरे में तीर चलाने की।
Amazon बिक्री डेटा आपका ग्रोथ इंजन क्यों है (सिर्फ़ एक स्कोरकार्ड नहीं)
अगर आप ज़्यादातर Amazon विक्रेताओं जैसे हैं, तो सुबह सबसे पहले Seller Central का डैशबोर्ड खुलता है: कल की बिक्री, आज का ट्रैफिक, शायद रैंकिंग पर एक त्वरित नज़र। लेकिन बात यह है—ये संख्याएँ सिर्फ़ हिमखंड की ऊपरी परत हैं। Amazon बिक्री डेटा, सही तरीके से इस्तेमाल किया जाए, तो आपके बिज़नेस का एक बहुआयामी नक्शा है: यह सिर्फ़ यह नहीं दिखाता कि क्या हुआ, बल्कि यह भी कि क्यों हुआ और आगे क्या होने की संभावना है।
पारंपरिक मॉनिटरिंग कार के स्पीडोमीटर देखने जैसी है; आपको पता चलता है कि आप कितनी तेज़ी से जा रहे हैं, लेकिन यह नहीं कि पेट्रोल खत्म होने वाला है, गड्ढा आने वाला है, या आपने गलत मोड़ लेने वाले हैं। असली Amazon बिक्री विश्लेषण ज़्यादा उस GPS जैसा है जिसमें लाइव ट्रैफिक, मौसम, और वैकल्पिक रूट सुझाव भी हों।
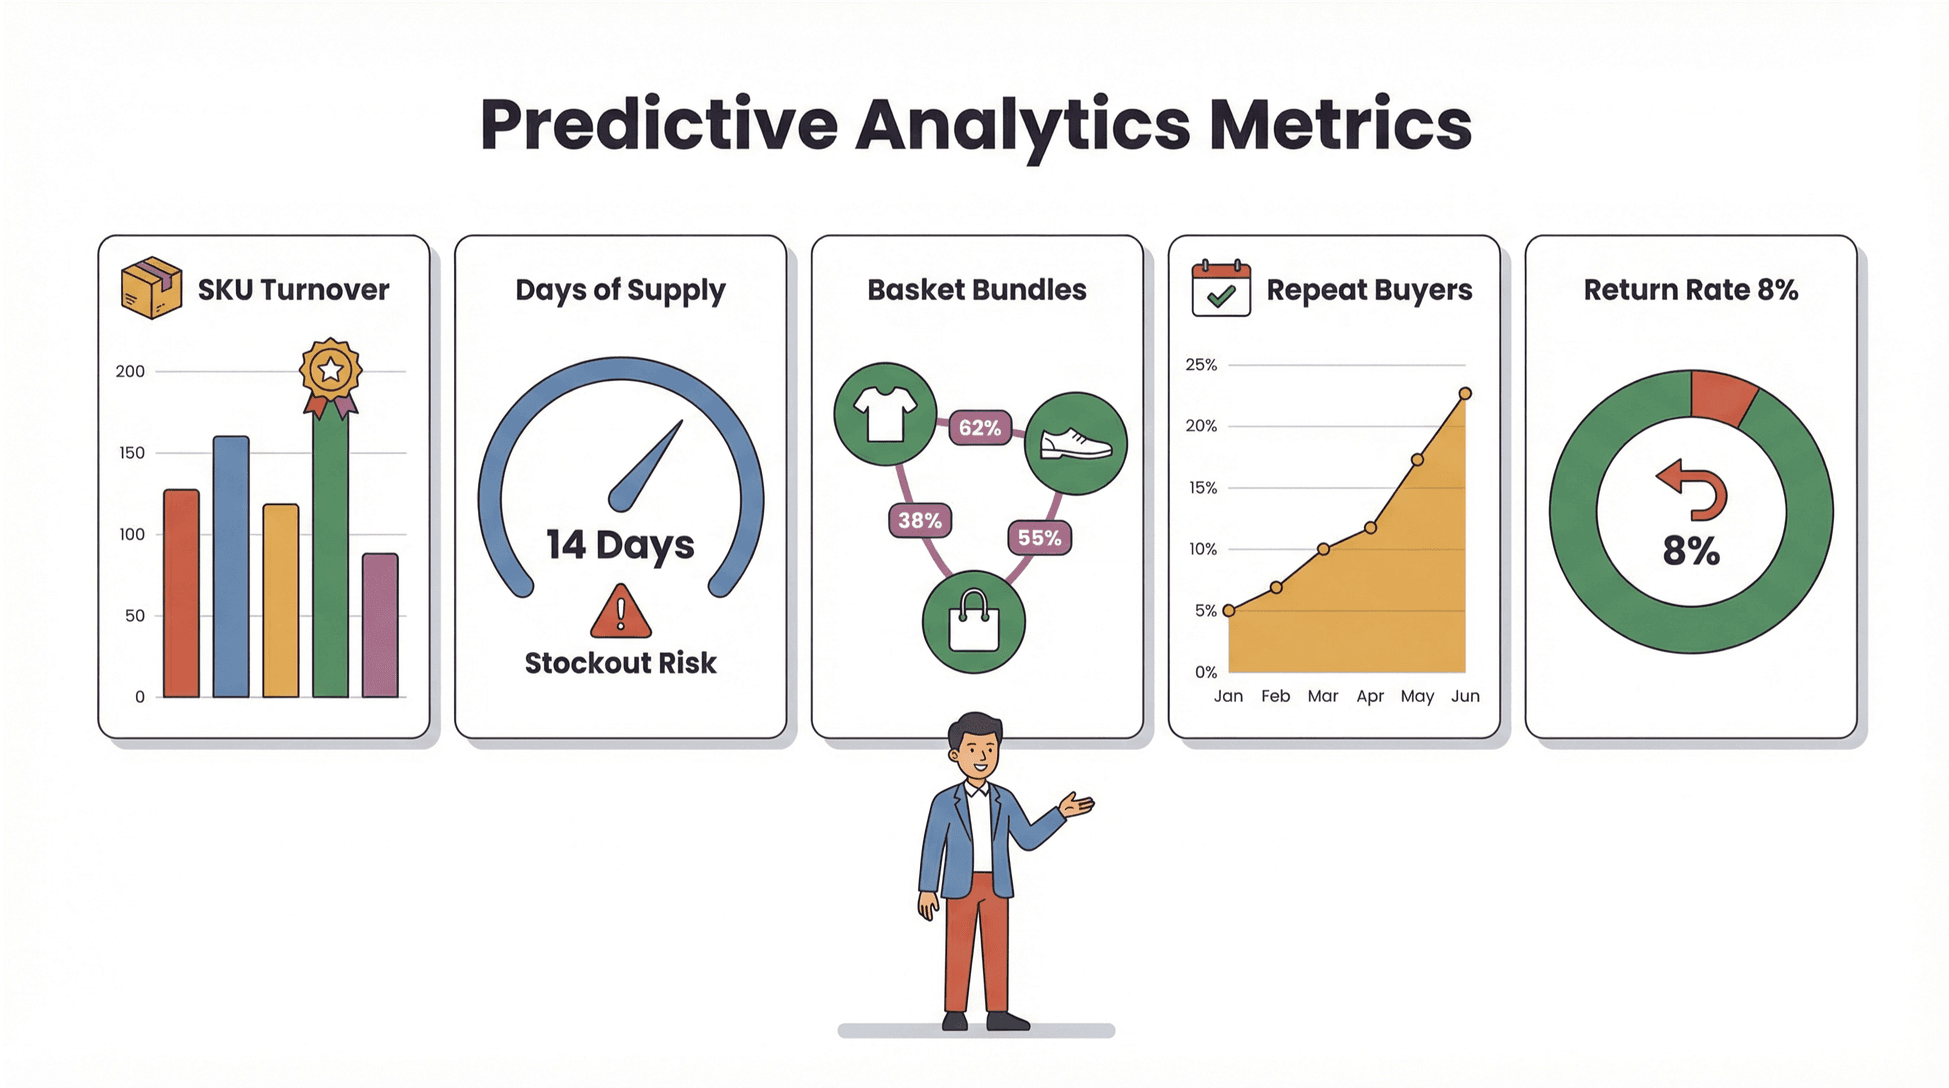
आइए कुछ प्रमुख Amazon बिक्री डेटा बिंदुओं को देखें और समझें कि उनका आपके बिज़नेस के लिए असल मतलब क्या है:
| मीट्रिक | यह आपको क्या बताता है | व्यावसायिक प्रभाव |
|---|---|---|
| बिक्री गति | हर SKU कितनी तेज़ी से बिक रहा है | मांग का अनुमान, रिस्टॉक योजना, सफल उत्पाद पहचान |
| इन्वेंट्री टर्नओवर | स्टॉक कितनी जल्दी बिककर फिर से भरता है | नकदी प्रवाह ऑप्टिमाइज़ करें, ओवरस्टॉक/स्टॉकआउट से बचें |
| दोबारा खरीद दर | कितने % ग्राहक फिर से खरीदते हैं | वफादारी मापें, रिटेंशन के अवसर पहचानें |
| सप्लाई के दिन | मौजूदा स्टॉक कितने दिन चलेगा | स्टॉकआउट का अनुमान, रीऑर्डर समय तय करें |
| रिटर्न दर | कितनी % इकाइयाँ वापस की गईं | गुणवत्ता समस्याएँ पकड़ें, भविष्य के रिटर्न घटाएँ |
| मार्केट बास्केट विश्लेषण | कौन-से उत्पाद साथ में खरीदे जाते हैं | बंडल अवसर, क्रॉस-सेल रणनीतियाँ |
| सर्च इम्प्रेशंस | आपके उत्पाद कितनी बार देखे जाते हैं | शुरुआती मांग संकेत, कीवर्ड ऑप्टिमाइज़ेशन |
जो ब्रांड्स बढ़ते हैं और जो रुक जाते हैं, उनके बीच का फर्क? विजेता वही हैं जो एकल-मीट्रिक स्नैपशॉट्स से हटकर समग्र, पूर्वानुमानित विश्लेषण की ओर बढ़ते हैं। वे सिर्फ़ प्रतिक्रिया नहीं देते—वे पहले से अनुमान लगाते हैं।
Amazon बिक्री विश्लेषण से ग्राहक इरादे और बाज़ार ट्रेंड्स कैसे समझें
अब बात दिलचस्प होती है। Amazon बिक्री विश्लेषण सिर्फ़ ऑर्डर गिनने के बारे में नहीं है—यह समझने के बारे में है कि ग्राहक क्यों खरीदते हैं, कब खरीदते हैं, और क्या उन्हें और खरीदने के लिए प्रेरित कर सकता है।
उदाहरण के लिए, Amazon के आपको दोबारा खरीद व्यवहार और मार्केट बास्केट ट्रेंड्स देखने देते हैं। हो सकता है आपको दिखे कि जो ग्राहक आपका प्रोटीन पाउडर खरीदते हैं, वे अक्सर उसी समय एक खास शेकर बोतल भी खरीदते हैं। यह एक क्रॉस-सेल अवसर है जो बस आपके सामने है।
या शायद हर अक्टूबर में आपकी बिक्री बढ़ती है, लेकिन सिर्फ़ कुछ चुनिंदा SKU के लिए। सही विश्लेषण के साथ, आप इन मौसमी पैटर्न्स को पहचान सकते हैं, इन्वेंट्री प्लान कर सकते हैं, और प्रतिस्पर्धियों के समझने से पहले टार्गेटेड प्रमोशन भी लॉन्च कर सकते हैं।
विज़ुअलाइज़ेशन टिप: मुझे मौसमी ट्रेंड पकड़ने के लिए हीटमैप्स बहुत पसंद हैं—पंक्तियाँ SKU के लिए, स्तंभ हफ्तों या महीनों के लिए, और रंग की तीव्रता बिक्री मात्रा के लिए। यह समय के साथ आपके बिज़नेस को “साँस लेते” हुए देखने जैसा है।
विश्लेषण आपको कमज़ोर प्रदर्शन करने वाले SKU की पहचान में भी मदद कर सकता है। हो सकता है किसी उत्पाद को बहुत सारे इम्प्रेशंस मिल रहे हों, लेकिन कन्वर्ज़न कम हों। यह संकेत है कि आपको अपनी लिस्टिंग, मूल्य निर्धारण, या इमेजेज़ पर फिर से नज़र डालनी चाहिए।
वास्तविक उदाहरण: मैंने ऐसे ब्रांड्स देखे हैं जिन्होंने उच्च दोबारा खरीद दर वाले SKU पर ज़्यादा ध्यान दिया, रिटेंशन कैंपेन और subscribe-and-save ऑफ़र्स में निवेश किया। नतीजा? ज़्यादा स्थिर राजस्व और बेहतर customer lifetime value।
Amazon बिक्री रिपोर्ट्स को ऑटोमेट करें: रियल-टाइम इनसाइट्स के लिए API इंटीग्रेट करें
सच कहें तो: मैनुअल रिपोर्टिंग उत्पादकता की दुश्मन है। Amazon की अपनी मानती है कि कुछ ऑर्डर रिपोर्ट्स सिर्फ़ 30 दिनों तक ही उपलब्ध रहती हैं, और पूरे साल की रिपोर्ट बनाना घंटों ले सकता है। अगर आप CSV डाउनलोड कर रहे हैं, स्प्रेडशीट्स मर्ज कर रहे हैं, और रोज़ाना होने वाले बदलावों के साथ तालमेल बैठाने की कोशिश कर रहे हैं, तो आप बहुत कठिन लड़ाई लड़ रहे हैं।
यहीं ऑटोमेशन काम आता है। Amazon के को इंटीग्रेट करके, आप रियल-टाइम बिक्री डेटा सीधे अपने एनालिटिक्स टूल्स में खींच सकते हैं—ना मैनुअल डाउनलोड्स, ना पुराना डेटा।
के साथ यह वर्कफ़्लो कुछ ऐसा दिखता है:
- Amazon API से कनेक्ट करें: Thunderbit आपको SP-API onboarding (OAuth, permissions, आदि) में गाइड करता है, ताकि आप अपनी बिक्री, ऑर्डर, और इन्वेंट्री डेटा तक सुरक्षित रूप से पहुँच सकें।
- डेटा संग्रह ऑटोमेट करें: शेड्यूल्ड pulls सेट करें—घंटेवार, दैनिक, साप्ताहिक—ताकि आपके डैशबोर्ड हमेशा अपडेट रहें।
- रियल टाइम में विश्लेषण करें: Thunderbit डेटा को सीधे आपके पसंदीदा टूल्स (Excel, Google Sheets, BI dashboards) में भेज देता है, ताकि आप ट्रेंड्स पहचानकर तुरंत कदम उठा सकें।
मैनुअल बनाम ऑटोमेटेड रिपोर्टिंग:
| वर्कफ़्लो | लगा समय | डेटा की ताज़गी | गलती का जोखिम | कार्रवाई योग्यत |
|---|---|---|---|---|
| मैनुअल डाउनलोड | ज़्यादा | कम | ज़्यादा | देरी से |
| API ऑटोमेशन | कम | ज़्यादा | कम | तुरंत |
अपने Amazon बिक्री रिपोर्ट प्रोसेस को ऑटोमेट करना सिर्फ़ समय बचाने के बारे में नहीं है—यह सुनिश्चित करने के बारे में है कि आप कोई भी महत्वपूर्ण संकेत न चूकें।
सूक्ष्म डेटा की ओर बढ़ें: उन्नत मीट्रिक्स से सफलता का अनुमान लगाएँ
अगर आप “क्या हुआ” से “आगे क्या होगा” की ओर बढ़ना चाहते हैं, तो आपको डेटा को अधिक सूक्ष्म स्तर पर देखना होगा। हाई-लेवल बिक्री आँकड़े अच्छे हैं, लेकिन असली इनसाइट्स SKU-स्तर, ग्राहक-स्तर, और यहाँ तक कि इवेंट-स्तर डेटा से मिलती हैं।
ज़रा सोचिए: अगर आप सिर्फ़ कुल बिक्री देखेंगे, तो आप यह मिस कर सकते हैं कि एक SKU आपकी पूरी ग्रोथ चला रहा है जबकि दूसरा चुपचाप मार्जिन खा रहा है। या यह कि किसी नए प्रोडक्ट लाइन में आपका रिटर्न रेट धीरे-धीरे बढ़ रहा है।
यहाँ कुछ उन्नत मीट्रिक्स हैं जो आपकी पूर्वानुमानित विश्लेषण क्षमता को काफ़ी मज़बूत कर सकते हैं:
- SKU-स्तर इन्वेंट्री टर्नओवर: कौन-से उत्पाद सबसे तेज़ी से चल रहे हैं? कौन-से ओवरस्टॉक या स्टॉकआउट के जोखिम में हैं?
- ग्राहक रिटर्न दर: क्या कुछ उत्पादों या समय अवधियों में ज़्यादा रिटर्न आ रहे हैं? क्या यह गुणवत्ता की समस्या है या अपेक्षाओं का मेल न होना?
- खरीद आवृत्ति: आपके सबसे अच्छे ग्राहक कितनी बार खरीदते हैं? क्या आप उन्हें और बार खरीदने के लिए प्रेरित कर सकते हैं?
- SKU के अनुसार सप्लाई के दिन: हर उत्पाद खत्म होने में कितने दिन बचे हैं? क्या आप बिक्री उछाल चूकने के जोखिम में हैं?
- मार्केट बास्केट विश्लेषण: कौन-से उत्पाद आमतौर पर साथ खरीदे जाते हैं? क्या आप उन्हें बंडल या क्रॉस-प्रमोट कर सकते हैं?
Thunderbit के साथ, आप इस स्तर का विवरण निकाल सकते हैं—कोई कोडिंग ज़रूरी नहीं। AI-संचालित extraction engine Amazon रिपोर्ट्स, डैशबोर्ड्स, और यहाँ तक कि सबपेजेज़ से भी सूक्ष्म डेटा खींचकर उसे विश्लेषण के लिए व्यवस्थित कर सकता है।
कार्रवाई में predictive analytics: बिक्री गति और सप्लाई के दिनों का मॉडल बनाकर, आप अनुमान लगा सकते हैं कि रीऑर्डर कब करना है, कितना खरीदना है, और मार्केटिंग खर्च कहाँ आवंटित करना है। यह आपके Amazon बिज़नेस के लिए एक क्रिस्टल बॉल जैसा है (धुंध और संदिग्ध भविष्यवाणियों के बिना)।
Thunderbit: गहरे Amazon बिक्री विश्लेषण तक पहुँचने का सबसे तेज़ रास्ता (कोडिंग की ज़रूरत नहीं)
आइए उस मुद्दे पर बात करें जिसे हर कोई सोच रहा है: ज़्यादातर विक्रेताओं के पास न तो डेटा टीम होती है, न ही Python सीखने का समय, सिर्फ़ अपने Amazon बिक्री डेटा को समझने के लिए। इसी वजह से हमने बनाया।
Thunderbit एक है जो आपको कुछ ही क्लिक में Amazon बिक्री डेटा निकालने, संरचित करने, और विश्लेषण करने देता है। ना कोड, ना टेम्पलेट्स, ना सिरदर्द।
यह कैसे काम करता है:
- AI फ़ील्ड्स सुझाता है: Thunderbit आपके Amazon dashboard या रिपोर्ट पेज को पढ़कर सबसे प्रासंगिक कॉलम सुझाता है—बिक्री, इन्वेंट्री, दोबारा खरीद दर, जो चाहें।
- सबपेज स्क्रैपिंग: और गहराई चाहिए? Thunderbit हर SKU या ऑर्डर सबपेज पर अपने-आप जा सकता है और आपके dataset को सूक्ष्म जानकारी से समृद्ध कर सकता है।
- कहीं भी एक्सपोर्ट करें: डेटा मिलते ही उसे सीधे Excel, Google Sheets, Airtable, या Notion में एक्सपोर्ट करें। और कोई कॉपी-पेस्ट मैराथन नहीं।
- शेड्यूल्ड स्क्रैपिंग: बार-बार डेटा pull सेट करें ताकि आपकी रिपोर्टें हमेशा ताज़ा रहें—साप्ताहिक बिज़नेस रिव्यू या दैनिक इन्वेंट्री जाँच के लिए बिल्कुल सही।
- क्लाउड बनाम ब्राउज़र स्क्रैपिंग: सार्वजनिक पेजों के लिए Thunderbit का cloud mode स्पीड के लिए इस्तेमाल करें (एक बार में 50 पेज तक)। लॉग-इन Seller Central डेटा के लिए सुरक्षा और एक्सेस के लिए browser mode इस्तेमाल करें।
Thunderbit पर दुनिया भर में भरोसा करते हैं, और Amazon के लगातार बदलते इंटरफ़ेस के साथ तालमेल बनाए रखने के लिए इसे नियमित रूप से अपडेट किया जाता है।
उपयोगकर्ता कहानी: एक विक्रेता ने बताया कि वह पहले हर हफ्ते रिपोर्ट डाउनलोड और मर्ज करने में घंटों लगाता था। Thunderbit के साथ, उसने एक scheduled scrape सेट किया, Google Sheets में एक्सपोर्ट किया, और अब उसके पास रोज़ाना का डैशबोर्ड है—कोई मैनुअल काम नहीं।
Amazon बिक्री डेटा को रणनीतिक व्यावसायिक संपत्ति में बदलना
तो आपके पास डेटा है—अब क्या? असली मूल्य तभी आता है जब आप कच्चे आँकड़ों को कार्रवाई योग्य रणनीति में बदलते हैं।
Thunderbit आपको डेटा संग्रह से निर्णय-निर्माण तक ले जाने में इस तरह मदद करता है:
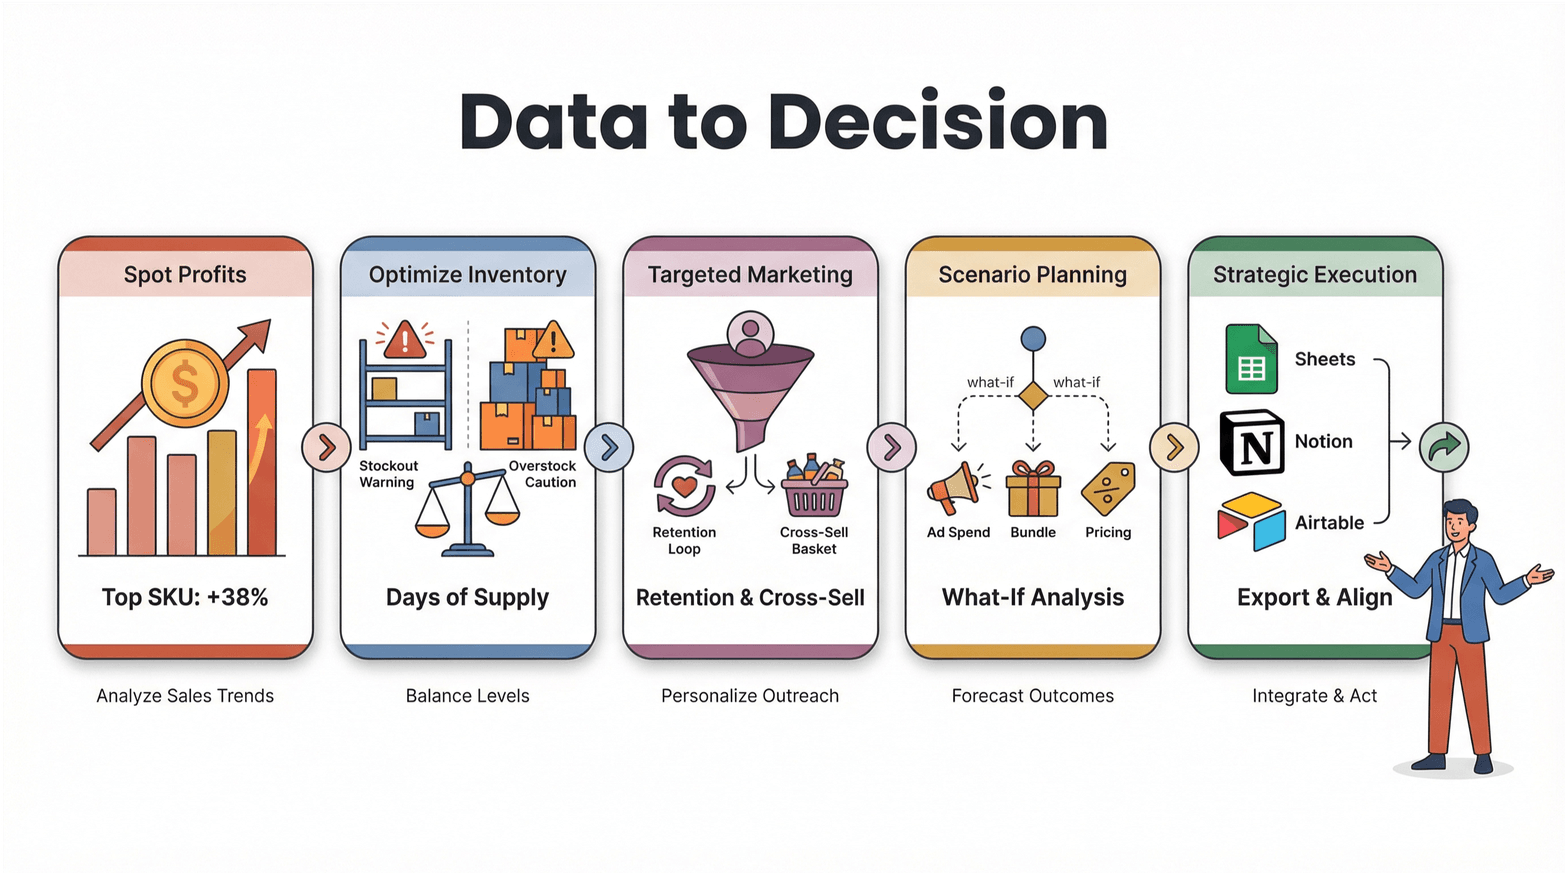
- लाभ के अवसर पहचानें: बिक्री गति और मार्जिन डेटा का उपयोग करके अपने सबसे लाभदायक SKU पहचानें। सफल उत्पादों पर ज़्यादा ध्यान दें, कमजोर प्रदर्शन करने वालों को कम करें।
- इन्वेंट्री ऑप्टिमाइज़ करें: सप्लाई के दिनों और टर्नओवर दरों की निगरानी करें ताकि स्टॉकआउट (बिक्री का नुकसान) और ओवरस्टॉक (फँसा हुआ नकद) से बचा जा सके।
- लक्षित मार्केटिंग: दोबारा खरीद दर और मार्केट बास्केट डेटा का विश्लेषण करके रिटेंशन कैंपेन और क्रॉस-सेल ऑफ़र्स तैयार करें।
- परिदृश्य योजना: सूक्ष्म डेटा के साथ, आप “क्या होगा अगर” विश्लेषण चला सकते हैं—अगर आप विज्ञापन खर्च बढ़ाएँ, उत्पादों को बंडल करें, या मूल्य बदलें तो क्या होगा?
- रणनीतिक क्रियान्वयन: अपनी इनसाइट्स को टीम के टूल्स—Sheets, Notion, Airtable—में एक्सपोर्ट करें, ताकि सभी एक ही पृष्ठ पर हों और कार्रवाई के लिए तैयार रहें।
निचोड़ यह है: Amazon बिक्री विश्लेषण सिर्फ़ अतीत की रिपोर्टिंग नहीं है। यह एक फीडबैक लूप बनाने के बारे में है जहाँ हर डेटा बिंदु ज़्यादा समझदारी, तेज़ी, और अधिक लाभदायक निर्णयों को प्रेरित करता है।
चरण-दर-चरण गाइड: Thunderbit के साथ Amazon बिक्री विश्लेषण में महारत हासिल करें
तैयार हैं हाथ गंदे करने के लिए? यहाँ Thunderbit का उपयोग करके Amazon बिक्री विश्लेषण में महारत हासिल करने की एक व्यावहारिक प्रक्रिया है—सेटअप से लेकर उन्नत विश्लेषण तक।
चरण 1: Amazon अकाउंट कनेक्ट करें और Thunderbit सेट अप करें
- Thunderbit इंस्टॉल करें: डाउनलोड करें और इसे अपने टूलबार पर पिन करें।
- Seller Central में लॉग इन करें: Chrome में अपना Amazon Seller Central या Vendor Central डैशबोर्ड खोलें।
- Thunderbit लॉन्च करें: Thunderbit आइकन पर क्लिक करें। लॉग-इन डेटा के लिए सुरक्षित एक्सेस हेतु browser mode इस्तेमाल करें।
- डेटा सुरक्षा: Thunderbit कभी आपके credentials स्टोर नहीं करता—cloud scraping (सिर्फ़ सार्वजनिक पेजों के लिए) चुनने पर छोड़कर डेटा आपके ब्राउज़र में स्थानीय रूप से प्रोसेस होता है।
चरण 2: Amazon बिक्री रिपोर्ट्स निकालें और अनुकूलित करें
- AI फ़ील्ड्स सुझाता है: अपने लक्षित Amazon रिपोर्ट या डैशबोर्ड पर “AI Suggest Fields” पर क्लिक करें। Thunderbit पेज स्कैन करके कॉलम (बिक्री, इन्वेंट्री, रिटर्न आदि) सुझाएगा।
- कॉलम अनुकूलित करें: ज़रूरत के अनुसार कॉलम जोड़ें, हटाएँ, या नाम बदलें। आप साफ़ एक्सपोर्ट के लिए data types (text, number, date, आदि) निर्धारित कर सकते हैं।
- सबपेज स्क्रैपिंग: गहरी इनसाइट्स के लिए, individual SKU या order pages से डेटा खींचने हेतु subpage scraping सक्षम करें।
चरण 3: डेटा संग्रह और शेड्यूलिंग को ऑटोमेट करें
- स्क्रैप शेड्यूल करें: recurring scrapes सेट करें—daily, weekly, या custom intervals। Thunderbit आसान सेटअप के लिए natural language scheduling (“हर सोमवार सुबह 9 बजे”) का उपयोग करता है।
- क्लाउड बनाम ब्राउज़र: सार्वजनिक डेटा के लिए cloud mode का उपयोग करें (तेज़, एक बार में 50 पेज तक)। Seller Central के लिए authenticated access हेतु browser mode बनाए रखें।
- प्रगति पर नज़र रखें: Thunderbit real-time प्रगति दिखाता है और किसी भी समस्या (जैसे login timeouts या page changes) की सूचना देता है।
चरण 4: विश्लेषण करें, विज़ुअलाइज़ करें, और इनसाइट्स पर कार्रवाई करें
- डेटा एक्सपोर्ट करें: अपने संरचित डेटा को सीधे Excel, Google Sheets, Airtable, या Notion में भेजें। आप इसे CSV या JSON के रूप में डाउनलोड भी कर सकते हैं।
- डैशबोर्ड बनाएँ: ट्रेंड्स देखने के लिए pivot tables, charts, और heatmaps का उपयोग करें—SKU के अनुसार बिक्री, मौसमी रुझान, इन्वेंट्री जोखिम, आदि।
- कार्रवाई करें: अपनी टीम के साथ इनसाइट्स साझा करें, मार्केटिंग और इन्वेंट्री रणनीतियों को समायोजित करें, और प्रमुख मीट्रिक्स (जैसे कम स्टॉक या बढ़ती रिटर्न दर) के लिए alerts सेट करें।
प्रो टिप: उन्नत उपयोगकर्ताओं के लिए, Thunderbit हर फ़ील्ड के लिए custom AI prompts सपोर्ट करता है—ताकि आप डेटा को फ़्लाई पर label, categorize, या translate भी कर सकें।
डेटा से पूर्वानुमानित ग्रोथ तक: Amazon विक्रेताओं के लिए मुख्य निष्कर्ष
चलो मुख्य बातों को दोहरा लें:
- Amazon बिक्री विश्लेषण आपका ग्रोथ इंजन है: ट्रैफिक और रैंक से आगे बढ़ने पर आपके बिज़नेस का 360° दृश्य खुलता है—ग्राहक इरादा, इन्वेंट्री स्वास्थ्य, और मार्केट ट्रेंड्स।
- सूक्ष्म डेटा = पूर्वानुमानित शक्ति: SKU-स्तर, ग्राहक-स्तर, और इवेंट-स्तर मीट्रिक्स मांग का अनुमान लगाने, इन्वेंट्री ऑप्टिमाइज़ करने, और नए अवसर पहचानने में मदद करते हैं।
- ऑटोमेशन ज़रूरी है: मैनुअल रिपोर्टिंग धीमी है, त्रुटिपूर्ण है, और आपको अंधेरे में छोड़ देती है। API इंटीग्रेशन और Thunderbit जैसे टूल्स आपके डेटा को ताज़ा और कार्रवाई योग्य रखते हैं।
- Thunderbit इसे आसान बनाता है: AI-संचालित extraction, subpage scraping, और no-code automation के साथ, कोई भी Amazon बिक्री विश्लेषण में महारत हासिल कर सकता है—तकनीकी कौशल की ज़रूरत नहीं।
- इनसाइट्स को कार्रवाई में बदलें: अपनी analytics का उपयोग करके मूल्य निर्धारण, इन्वेंट्री, और मार्केटिंग निर्णय लें जो पूर्वानुमानित, डेटा-संचालित विकास को बढ़ावा दें।
जो ब्रांड Amazon बिक्री डेटा को सिर्फ़ एक स्कोरकार्ड नहीं, बल्कि एक रणनीतिक संपत्ति की तरह देखते हैं—उसी भीड़-भाड़ वाले बाज़ार में जीतते हैं।
निष्कर्ष और अगले कदम
Amazon बिक्री विश्लेषण में महारत हासिल करना सिर्फ़ बड़े ब्रांड्स या डेटा टीम्स और आकर्षक डैशबोर्ड्स वालों के लिए नहीं है। सही टूल्स और सही सोच के साथ, कोई भी विक्रेता प्रतिक्रियात्मक रिपोर्टिंग से हटकर पूर्वानुमानित, रणनीतिक विकास की ओर बढ़ सकता है।
मैं क्या सलाह दूँगा:
- Thunderbit का मुफ़्त ट्रायल आज़माएँ: और देखें कि अपने Amazon बिक्री डेटा को निकालना और विश्लेषण करना कितना आसान है।
- अपने मौजूदा analytics workflow की समीक्षा करें: आप अभी भी कहाँ मैनुअल डाउनलोड्स या सतही मीट्रिक्स पर निर्भर हैं?
- एक त्वरित जीत पहचानें: शायद यह आपकी साप्ताहिक बिक्री रिपोर्ट को ऑटोमेट करना हो, या अपने शीर्ष SKU के लिए दोबारा खरीद दरों की गहराई में जाना हो।
- और संसाधन देखें: web scraping, analytics, और automation पर गहराई से पढ़ने के लिए देखें। आपको ये भी पसंद आ सकते हैं: और ।
Amazon बेचने का भविष्य उन लोगों का है जो डेटा को कार्रवाई में बदल सकते हैं—ट्रेंड्स का अनुमान लगाना, संचालन को ऑप्टिमाइज़ करना, और प्रतिस्पर्धा से पहले अवसर पकड़ना। Thunderbit के साथ, वह भविष्य आपकी पहुँच में है।
FAQs
1. Amazon बिक्री डेटा और Amazon बिक्री विश्लेषण में क्या अंतर है?
Amazon बिक्री डेटा से आशय कच्चे आँकड़ों—ऑर्डर, राजस्व, इन्वेंट्री, आदि—से है, जबकि Amazon बिक्री विश्लेषण उस डेटा से इनसाइट्स निकालने की प्रक्रिया है ताकि निर्णय लिए जा सकें। विश्लेषण आपको “क्या हुआ” से “क्यों हुआ” और “अब क्या करना है” की ओर ले जाता है।
2. मैं Amazon बिक्री रिपोर्ट जनरेशन को कैसे ऑटोमेट कर सकता हूँ?
आप Amazon के के साथ इंटीग्रेशन करके या जैसे टूल्स का उपयोग करके Amazon बिक्री रिपोर्ट जनरेशन को ऑटोमेट कर सकते हैं। Thunderbit आपको recurring data pulls शेड्यूल करने, सूक्ष्म डेटा निकालने, और उसे सीधे अपने analysis tools में एक्सपोर्ट करने देता है—मैनुअल डाउनलोड की ज़रूरत नहीं।
3. मुझे कौन-से उन्नत Amazon बिक्री मीट्रिक्स ट्रैक करने चाहिए?
बेसिक बिक्री और ट्रैफिक से आगे, बिक्री गति, इन्वेंट्री टर्नओवर, दोबारा खरीद दर, सप्लाई के दिन, रिटर्न दर, और मार्केट बास्केट विश्लेषण जैसी मीट्रिक्स पर ध्यान दें। ये मीट्रिक्स मांग का अनुमान लगाने, इन्वेंट्री ऑप्टिमाइज़ करने, और ग्रोथ अवसर पहचानने में मदद करते हैं।
4. अगर मैं तकनीकी नहीं हूँ, तब भी क्या Thunderbit का उपयोग कर सकता हूँ?
बिल्कुल। Thunderbit व्यावसायिक उपयोगकर्ताओं के लिए बनाया गया है—कोडिंग की ज़रूरत नहीं। बस Chrome Extension इंस्टॉल करें, अपनी रिपोर्ट परिभाषित करने के लिए AI Suggest Fields का उपयोग करें, और कुछ ही क्लिक में अपना डेटा एक्सपोर्ट करें। इंटरफ़ेस सहज है, और शुरू करने में मदद के लिए पर्याप्त documentation और support भी मौजूद है।
5. मैं Amazon बिक्री डेटा को कार्रवाई योग्य व्यावसायिक रणनीतियों में कैसे बदलूँ?
सूक्ष्म डेटा (SKU-स्तर, ग्राहक-स्तर, आदि) निकालकर शुरू करें, फिर analytics का उपयोग करके ट्रेंड्स, बाधाएँ, और अवसर पहचानें। Thunderbit के साथ, आप अपने डेटा को विज़ुअलाइज़ कर सकते हैं, scenario analyses चला सकते हैं, और अपनी टीम के साथ इनसाइट्स साझा कर सकते हैं—कच्चे आँकड़ों को लक्षित, लाभदायक कार्रवाइयों में बदलते हुए।
क्या आप बेसिक रिपोर्ट्स से आगे बढ़कर पूर्वानुमानित ग्रोथ खोलने के लिए तैयार हैं? और आज ही अपने Amazon बिक्री विश्लेषण में महारत हासिल करना शुरू करें। और अधिक सुझावों और ट्यूटोरियल्स के लिए पर जाएँ।
और जानें