

A few months ago, a friend asked me to help him pick an Amazon product to sell. He'd been watching YouTube videos for weeks, had three different spreadsheets open, and still couldn't pull the trigger. His big question wasn't "what should I sell?" — it was "how do I actually know if this will make money?"
That question stuck with me, because it's the one almost nobody answers with real numbers. In Jungle Scout's 2025 seller survey, cost pressures dominated: 38% of sellers cited higher shipping costs, 34% rising COGS, and 32% growing ad expenses.
Meanwhile, Marketplace Pulse reported that only 165,000 new sellers launched a product on Amazon.com in 2025 — the lowest since tracking began in 2015, down 44% from 2024. The casual era of Amazon selling is over. The sellers who remain are more sophisticated, better funded, and more data-driven. So vague advice like "look for good margins" isn't just unhelpful — it's risky. In this guide, I'm going to walk you through the actual math, a concrete scoring rubric, the red flags nobody warns you about, and a free-first workflow you can use today. No guru fluff, no affiliate upsells. Just the numbers.
Find profitable niches with AI web scraping Get Started Free
What Is an Amazon Niche (and Why Most Sellers Pick the Wrong One)?
An Amazon "niche" is a specific, focused segment of a larger product market. "Home & Kitchen" is a department. "Cutting boards" is a broad product area. "Bamboo cutting boards for small apartment kitchens" — now that's a niche, because it implies a buyer, a use case, a size constraint, and a material preference.
Niching down matters because it narrows the competitive field, makes your customer more identifiable, and gives you a realistic shot at ranking in search results without a massive ad budget. Amazon's Product Opportunity Explorer actually groups search terms into niches based on what customers view or purchase after searching — so the platform itself thinks in niches, not broad categories.
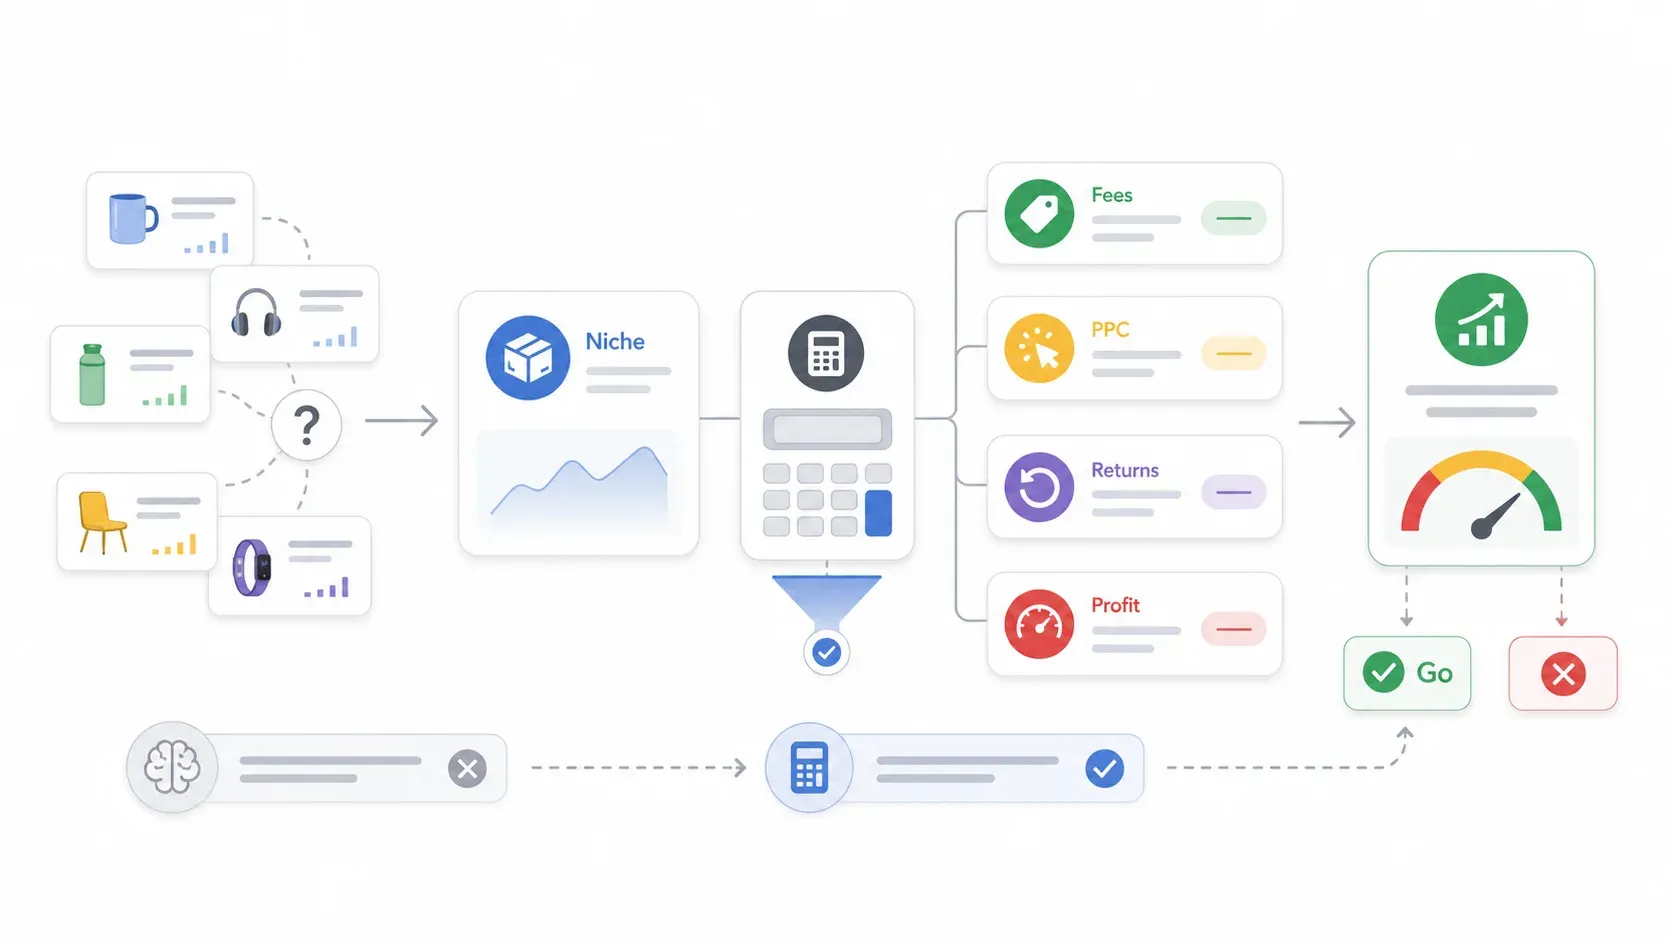
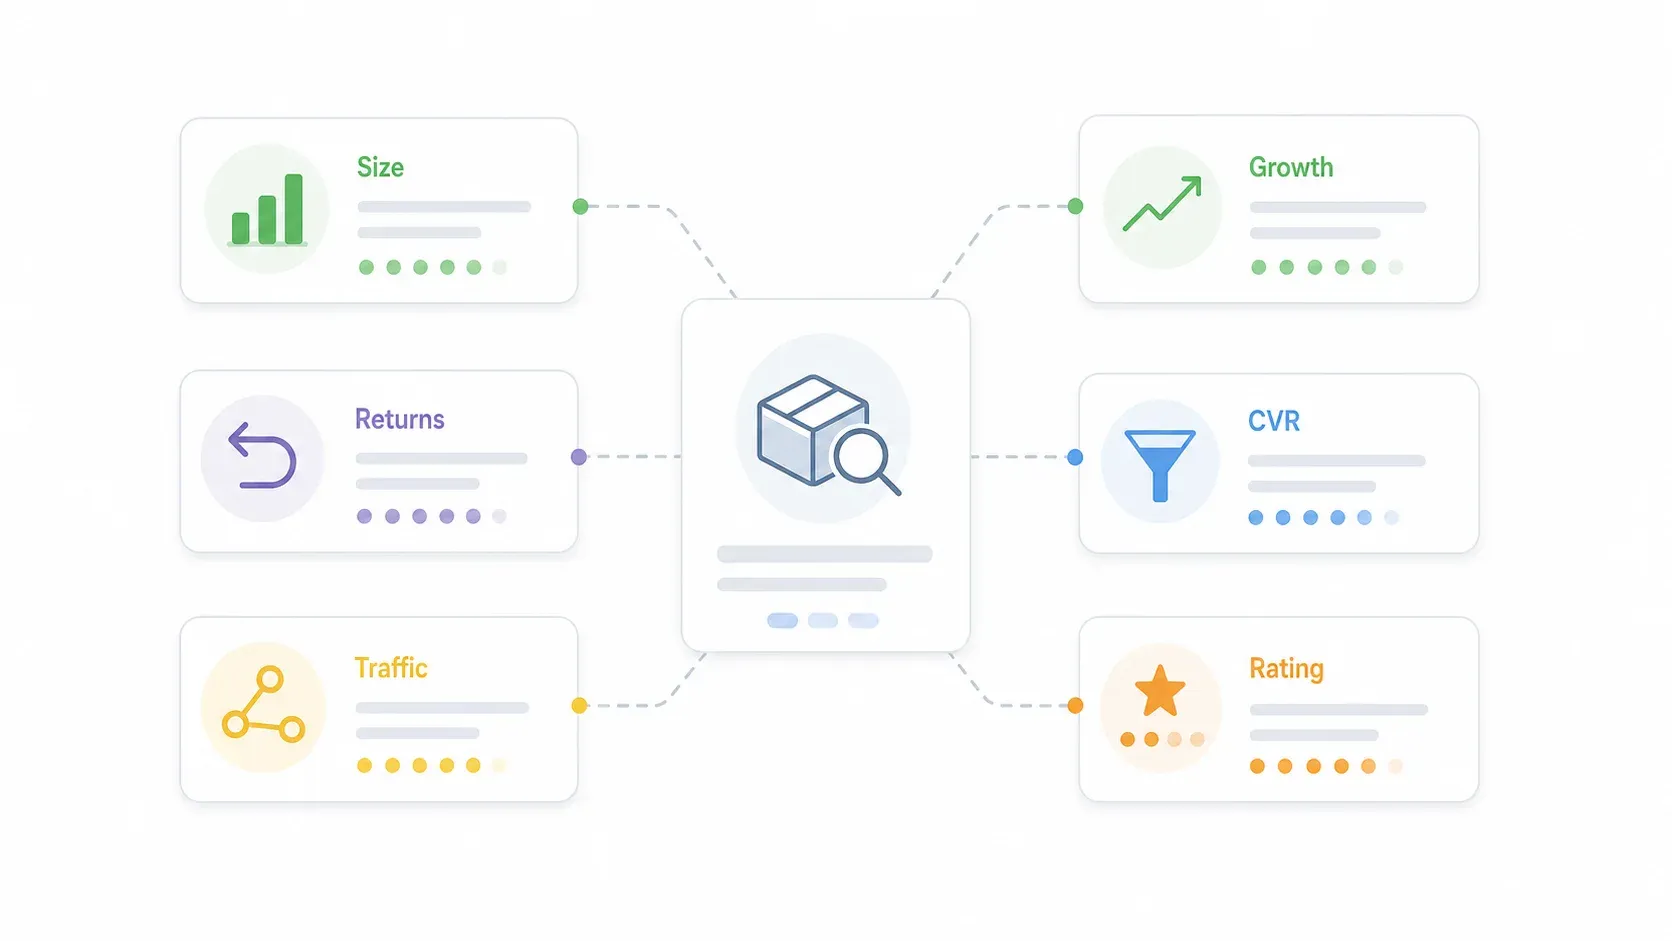
Here's the core mistake I see over and over: most sellers ask "Is this a good product?" when they should be asking "Is this a growing market where I can profitably capture customers?" A product can look great — decent reviews, solid demand — and still bleed money once you factor in fees, PPC, returns, and compliance. Flapen's methodology frames it well: a profitable niche needs market size, growth trajectory, return rate, traffic-channel profitability, conversion potential, and a rating gap. Not just a snapshot of reviews and BSR.
| Broad market | Narrower niche | Why the niche is better for analysis |
|---|---|---|
| Home & Kitchen | Bamboo cutting boards for small kitchens | Lets you compare price, dimensions, storage features, reviews, and use-case complaints |
| Fitness equipment | Beginner yoga mats for tall users | Buyer problem is clearer: length, cushioning, non-slip, beginner comfort |
| Pet supplies | Slow-feeder bowls for flat-faced dogs | Customer segment, problem, and review pain points are specific |
| Beauty | Fragrance-free body lotion for sensitive skin | Differentiation and compliance risk are easier to evaluate |
Why "Good Margins" Is Not Enough: The Real Criteria for a Profitable Amazon Niche
Every niche-research guide on the internet tells you to look for "high demand, low competition, good margins." That's like telling someone to invest in "stocks that go up." It's technically correct and practically useless — because none of those phrases come with a number attached.
Here are the six criteria that actually matter, each with a measurable threshold:
| Criterion | What It Means | Minimum Threshold | Why It Matters |
|---|---|---|---|
| Market size | Total annual revenue of the niche | >$1M/year (stronger at >$5M/year) | Too-small niches can't absorb launch costs or inventory risk |
| Growth trajectory | Is the market expanding year-over-year? | Positive YoY or recent search growth | A large shrinking niche can trap inventory |
| Return rate | Share of sales likely to be refunded | Below category average | Returns silently reduce contribution margin |
| Traffic channel profitability | Can you acquire customers profitably via at least one channel? | At least 1 of 5 channels viable | Organic ranking alone is not a launch strategy |
| Conversion rate potential | Do people in this niche actually buy? | At or above category average | High traffic with low conversion burns ad spend |
| Rating gap | Room to improve on existing products | Recurring negative-review pain points | Determines product differentiation strategy |
Growth trajectory deserves special attention.
A $5M/year niche that was $7M last year is a trap. Amazon's Product Opportunity Explorer lets you see search volume trends, and its user guide gives concrete examples — like a "Kitchen Scales" niche with 96,000 monthly searches and 30,000–40,000 units sold over the past 360 days, or a Kitchen category filter showing 26% search growth over 90 days.
Return rate is the silent margin killer most guides ignore. NRF and Happy Returns project $849.9 billion in U.S. retail returns in 2025 — equal to 15.8% of annual retail sales. Online return rates are even higher, estimated at 19.3%. Category-level variation is dramatic:
| Category | Conservative Return Rate | Caveat |
|---|---|---|
| Apparel | 25–35% | Fit, bracketing, and style mismatch |
| Footwear | 25–35% | Fit/comfort uncertainty |
| Electronics | 10–18% | Compatibility, defects, buyer remorse |
| Home/home goods | 8–15% | Bulky decor/furniture can be higher |
| Beauty/personal care | 5–10% | Hygiene and unsellable-return risk |
Even a 15% return rate can turn a 30% margin niche into a 15% margin niche. We'll get into that math next.
The Profitability Math Nobody Shows You: A Full P&L Walkthrough
This is the section that justifies the article title. I've seen dozens of niche-research guides, and almost none of them show you a complete, line-by-line profit-and-loss calculation. They'll say "aim for good margins" and move on. That's not good enough when you're about to wire money to a supplier.
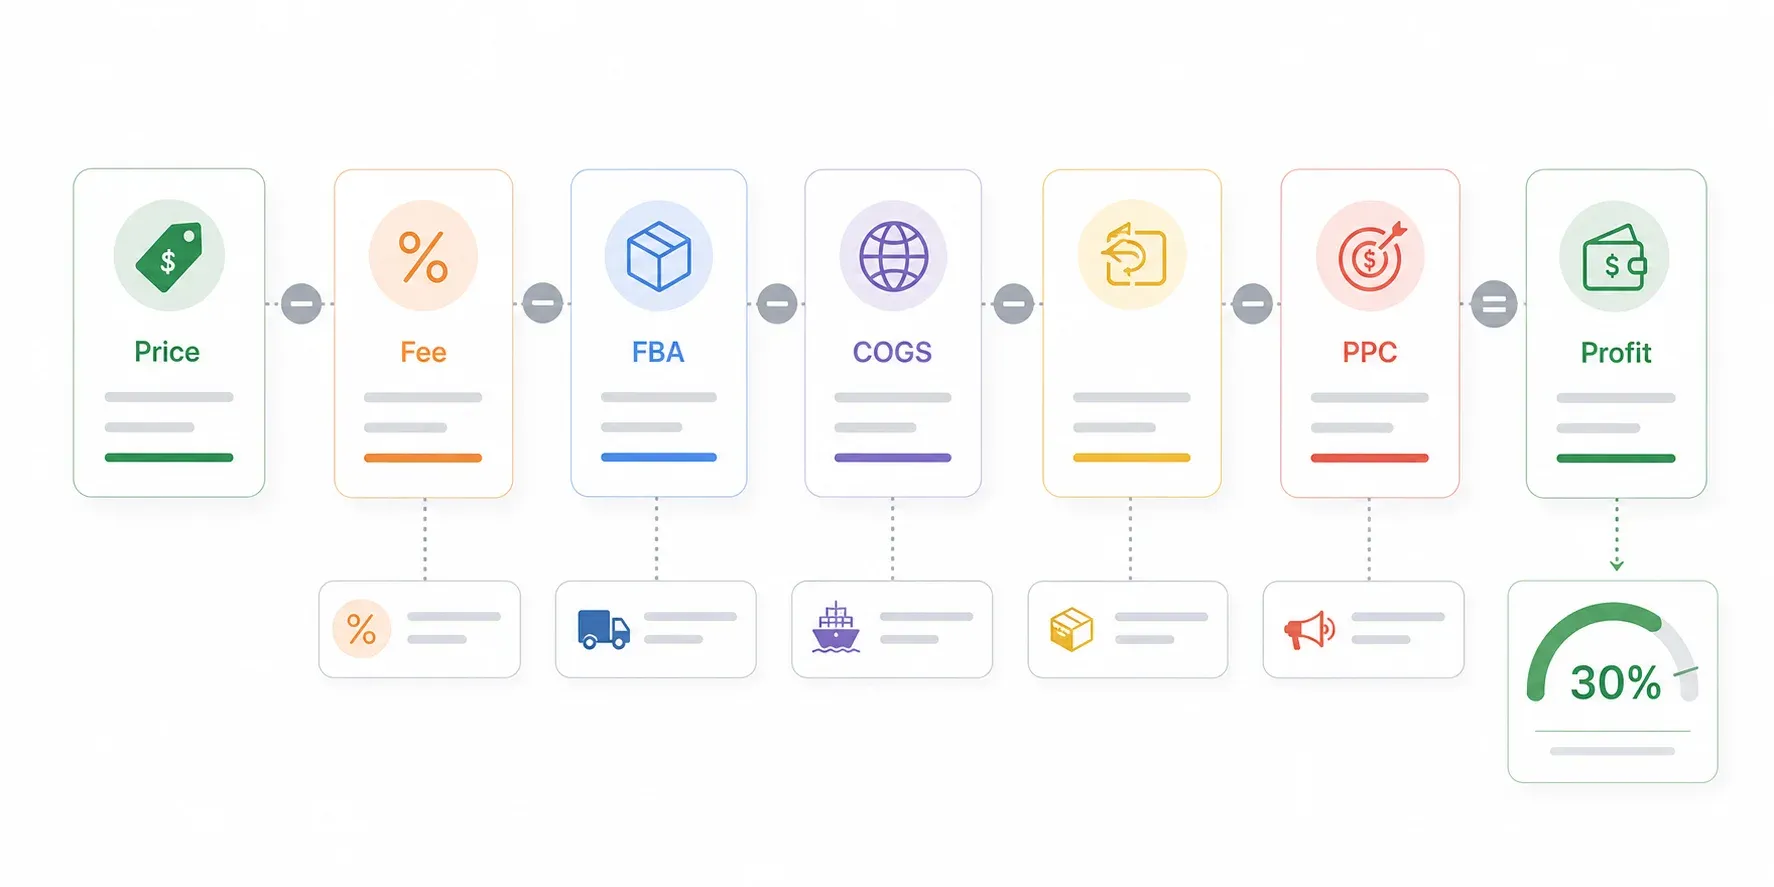
Here's a sample P&L for a hypothetical bamboo cutting board priced at $24.99:
| Line Item | Example Amount | Notes |
|---|---|---|
| Sale Price | $24.99 | Based on niche avg pricing |
| Amazon Referral Fee (15%) | –$3.75 | Home & Kitchen category |
| FBA Pick & Pack Fee | –$5.37 | Large standard-size estimate; verify in Revenue Calculator |
| Landed COGS (supplier + freight + duty) | –$5.25 | Manufacturing + shipping to FBA warehouse |
| Inbound Placement Fee | –$0.40 | Modeled estimate |
| Storage (2-month allocation) | –$0.09 | Approximate |
| Return Reserve | –$0.30 | Low/moderate Home & Kitchen assumption |
| Estimated PPC Cost per Unit | –$5.00 | 20% ACoS on $24.99 |
| Net Profit per Unit | $4.83 | ~19.3% margin |
Now here's where it gets interesting. PPC is the variable that makes or breaks most niches:
| PPC ACoS | Profit/Unit | Net Margin |
|---|---|---|
| 15% | $6.08 | 24.3% |
| 20% | $4.83 | 19.3% |
| 25% | $3.58 | 14.3% |
| 30% | $2.33 | 9.3% |
A product that looks "profitable" before PPC can turn mediocre — or worse — after PPC. For context, Headline's 2025 benchmark across 43 client accounts found an average 27.5% ACoS and $1.12 CPC, with U.S. averages at 29.2% ACoS and $1.31 CPC. Feedvisor's 2026 guidance puts Home & Kitchen ACoS at 15–27% and Electronics at 13–21%.
The bamboo board only reaches a clean 25–30% net margin if you reduce COGS or FBA tier, raise the price, improve conversion enough to lower ACoS, or add differentiation that supports pricing power. That's the real lesson: the math tells you whether a niche is worth fighting for.
Margin Thresholds to Live By
| Net Margin After All Costs | Interpretation |
|---|---|
| 30%+ | Strong target; gives room for returns, PPC volatility, coupons, fee changes |
| 20–30% | Investigate further; may work with strong conversion and low return rate |
| <20% | Usually too thin for beginners unless there's a clear strategic reason |
How to Calculate Your Own Niche P&L (Step by Step)
- Find the average selling price: Search your niche keyword on Amazon and record prices of the top 10–20 relevant listings.
- Calculate Amazon's referral fee: Use Amazon's referral fee table — it's typically 15% for Home & Kitchen, but varies by category.
- Estimate FBA fulfillment fees: Use Amazon's FBA Revenue Calculator with your product's dimensions, weight, category, and price.
- Estimate COGS: Request quotes from suppliers on Alibaba or domestic manufacturers. Model landed cost — not just factory price.
- Estimate PPC cost per unit sold: Use average ACoS for the category, or calculate from CPC and conversion rate.
- Add return and storage reserves: Even a small return rate has a real dollar cost.
- Subtract everything from sale price: That's your net profit per unit.
If you can't get to 30%+ margin on paper, the niche probably isn't worth pursuing — or you need a better product strategy.
The Competition Scoring Rubric: Rate Any Niche in 5 Minutes
Every guide tells you to "analyze competition." None of them give you a scoring system you can actually use. I've been testing different rubrics for a while, and this six-signal framework is the one that consistently separates real opportunities from mirages.
| Signal | 🟢 Green (Score 3) | 🟡 Yellow (Score 2) | 🔴 Red (Score 1) |
|---|---|---|---|
| Avg reviews (page 1 top 10) | < 100 | 100–500 | > 500 |
| Number of FBA sellers on page 1 | < 10 | 10–18 | 19+ |
| Brand dominance | < 30% branded listings | 30–60% | > 60% |
| Listing quality (photos, A+ content) | Mostly weak listings | Mixed | Mostly optimized |
| Avg price | $18–$50 sweet spot | $15–$18 or $50–$75 | < $15 or > $75 |
| Review sentiment | Consistent complaints (opportunity) | Mixed | Mostly positive (hard to differentiate) |
Score totals:
- 15–18: Strong opportunity — worth deeper P&L and supplier research
- 10–14: Investigate further — one red signal may be solvable
- < 10: Likely too competitive or too thin for a beginner
Where to Find Each Data Point
- Avg reviews: Search the niche keyword on Amazon, count reviews on the first-page listings.
- FBA sellers: Check the "Ships from" and "Sold by" info on each listing. "Ships from Amazon" usually means FBA.
- Brand dominance: Count how many page-1 results are recognizable or repeated brand names.
- Listing quality: Inspect main images, secondary images, video, bullet clarity, and A+ Content (the branded rich-media section below the bullets).
- Avg price: Record prices of the top 10 relevant results.
- Review sentiment: Read 2-star and 3-star reviews for recurring complaints — this doubles as product differentiation intel.
Quick Example: Scoring "Bamboo Cutting Boards"
| Signal | Observation | Score |
|---|---|---|
| Avg reviews | Several top listings have hundreds or thousands of reviews | 1–2 |
| FBA sellers | Many Prime/FBA offers | 1–2 |
| Brand dominance | Mixed; not purely national brands, but established Amazon brands present | 2 |
| Listing quality | Many optimized images and bundles | 1–2 |
| Avg price | Often inside $18–$50 sweet spot | 3 |
| Review sentiment | Recurring complaints: warping, cracking, size, smell, splinters | 2–3 |
Bamboo cutting boards at the broad keyword level are probably not a clean "green" niche. The opportunity would need to come from a narrower sub-niche — compact boards for apartments, dishwasher-safe alternatives, juice-groove designs, or non-slip sets — where you can address those specific complaints.
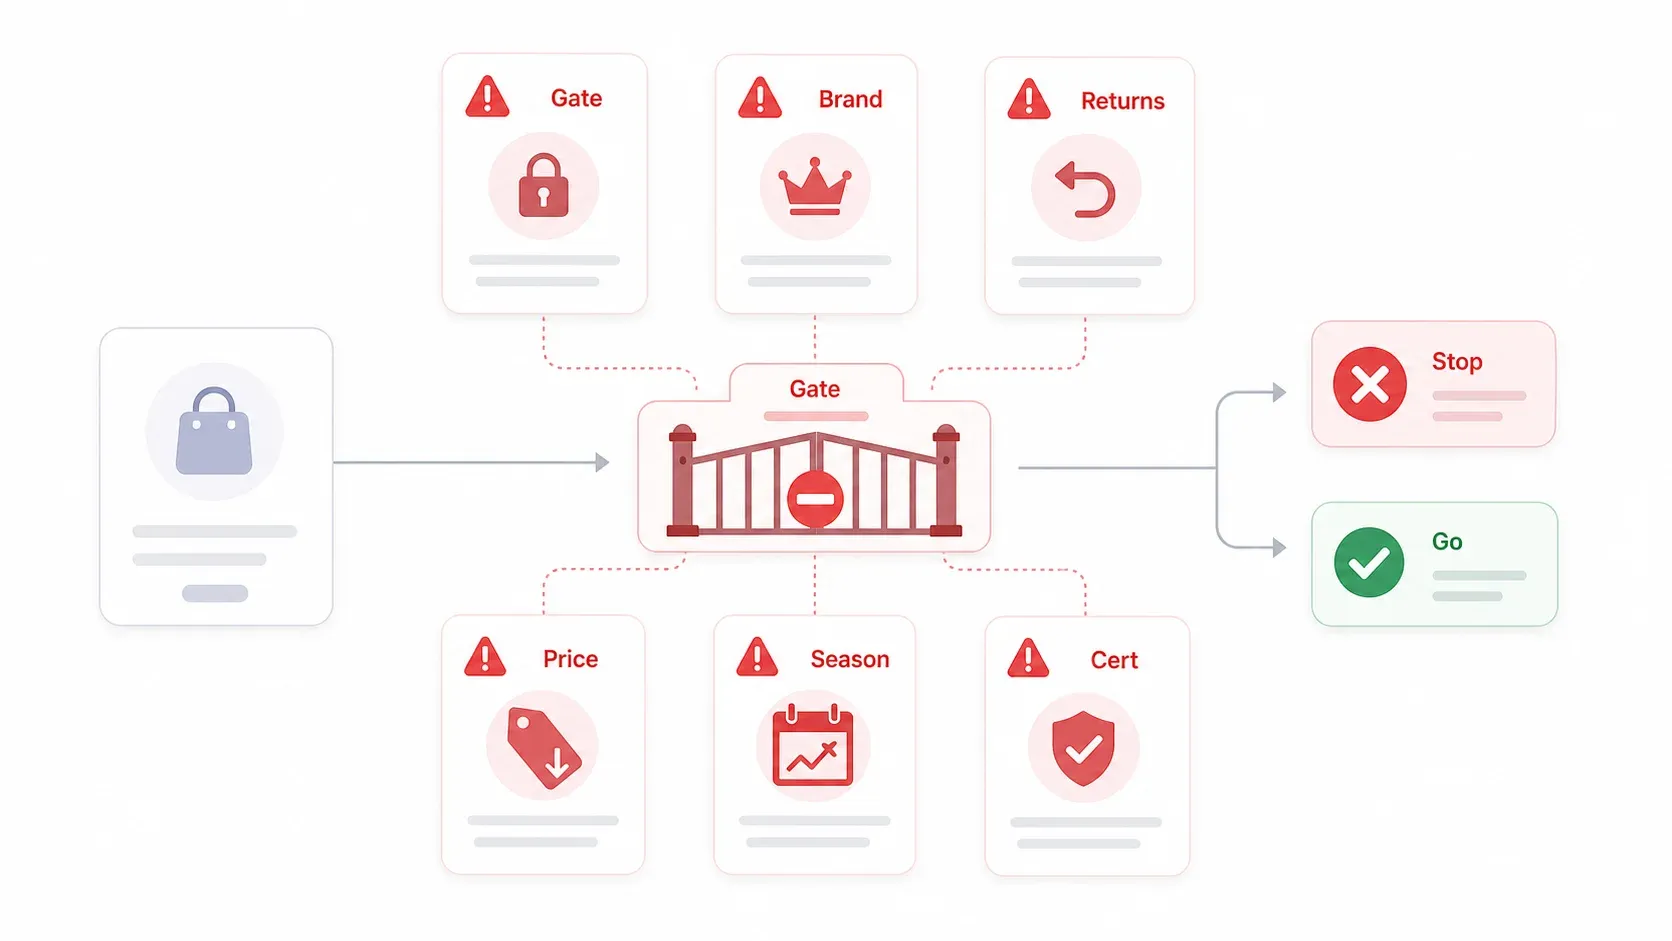
Red Flag Niches: 6 Warning Signs to Walk Away
This is the section I wish someone had written for me years ago. I've talked to enough frustrated sellers to know the pattern: they find a niche that looks promising, invest time and money, and then hit a wall they didn't see coming. Here are the six walls.
1. Gated and Restricted Categories
Some Amazon categories require approval before you can list products — and new sellers often can't get it. Amazon's FAQ explains that some categories are open, some require a Professional plan, some require approval, and some are off-limits to third-party sellers entirely. The practical check: go to Catalog > Add Products in Seller Central. If you see "Apply to sell," you need approval. If you see "Sell this product," you're clear.
High-risk beginner areas include supplements, medical devices, pesticides, children's toys, food/grocery, beauty/topicals, fine jewelry, and electronics with batteries or health claims.
2. Brand-Dominated Niches
If 80%+ of page-1 results are recognizable brands — Nike, KitchenAid, Bose — you're not just competing with products. You're competing with trust, ad budgets, and review moats. Use the rubric's brand dominance signal before you get emotionally attached to a niche.
3. High Return Rate Categories
Clothing, footwear, electronics, and bulky home goods can destroy margins even when demand is strong. NRF projects 19.3% online return rates in 2025. Tie this back to the P&L: even a 15% return rate can turn a 30% margin niche into a 15% margin niche after refunds, return shipping, and unsellable inventory.
4. Race-to-the-Bottom Pricing
Sub-$15 commodity products are a math problem. Amazon's fee table makes it visible: a 15% referral fee plus a fixed FBA fulfillment fee consumes a huge share of a low selling price. Add PPC, and you're often selling at a loss to maintain rank.
5. Seasonal Flash Niches
Seasonality isn't inherently bad — but unplanned seasonality is dangerous. Amazon's Product Opportunity Explorer user guide gives a BBQ Grill example with a 225% search increase between July and November. Christmas crafts, election merch, school-supply spikes — these can leave you holding dead inventory for 10 months of the year. One seller I came across put it perfectly: "My Christmas crafts book died in January. Plan accordingly."
6. Niches Requiring Certifications or Safety Testing
Children's products fall under CPSIA, which requires third-party lab testing and a Children's Product Certificate. FDA regulates cosmetics with drug claims. EPA has settled with Amazon over nearly 4,000 alleged violations for pesticide products not licensed for U.S. sale. These add cost, delay, and legal risk that beginners are rarely prepared for.
If a niche trips two or more of these red flags, walk away. The money you save by not launching is worth more than the money you might have made.
The Free-First Niche Research Workflow (Before You Spend a Dollar)
One thing that drives me nuts about niche-research content is how quickly it pushes you toward $50–$100/month paid tools. Meanwhile, forums are full of sellers who say they made their first $10K using free methods only — and others who are frustrated that every guide is secretly an affiliate pitch.
Here's a complete workflow that costs nothing.
Step 1: Generate Niche Ideas (Free)
- Amazon Search Autocomplete: Type a broad keyword and record the specific modifiers Amazon suggests.
- Amazon "Customers Also Bought": Find adjacent product ideas from related purchase behavior.
- Amazon Best Sellers, Movers & Shakers, New Releases: Spot trending categories and products with sustained sales.
- Reddit, Pinterest, TikTok: Look for products people are excited about or complaining about. Complaints are gold for differentiation.
Step 2: Check Demand and Seasonality (Free)
- Amazon Product Opportunity Explorer (inside Seller Central): See niche-level demand, competition data, search volume, and trends. Access it under Growth > Product Opportunity Explorer.
- Google Trends: Identify whether demand is growing, flat, declining, or seasonal.
- BSR checks: Use Amazon product pages and free browser extensions to monitor sales-rank direction.
Step 3: Score the Competition (Free)
Apply the 18-point rubric manually. If you want to score dozens or hundreds of rows instead of copying data by hand, use Thunderbit's free tier (6 pages/month) to extract structured data from Amazon search results.
Step 4: Run the Profitability Math (Free)
- Amazon FBA Revenue Calculator (free inside Seller Central): Estimate fees from product dimensions, weight, and price.
- Alibaba supplier quotes: Estimate landed COGS.
- Plug numbers into the P&L template from earlier.
When Paid Tools Actually Add Value
| Capability | Free Tools Cover It? | Paid Tool Adds Value? |
|---|---|---|
| Niche ideation | ✅ Autocomplete, social media, bestseller lists | Marginal |
| Demand estimation | ✅ Opportunity Explorer, BSR checks | ✅ Historical data over time |
| Competition scoring | ✅ Manual review count + Thunderbit scrape | ✅ Automated scoring |
| Keyword search volume | ⚠️ Google Trends (relative only) | ✅ Exact monthly volume |
| Profitability math | ✅ FBA Revenue Calculator | Marginal |
Current public pricing for popular paid tools: Helium 10 lists Platinum at $229/month (monthly) or $99/month (annual), and Diamond at $359/month (monthly) or $279/month (annual). Jungle Scout pricing varies by plan. The takeaway: validate cheaply first. Pay only after a candidate niche survives demand, competition, red flags, and paper P&L.
How to Bulk-Validate Amazon Niches by Scraping Real Data with Thunderbit
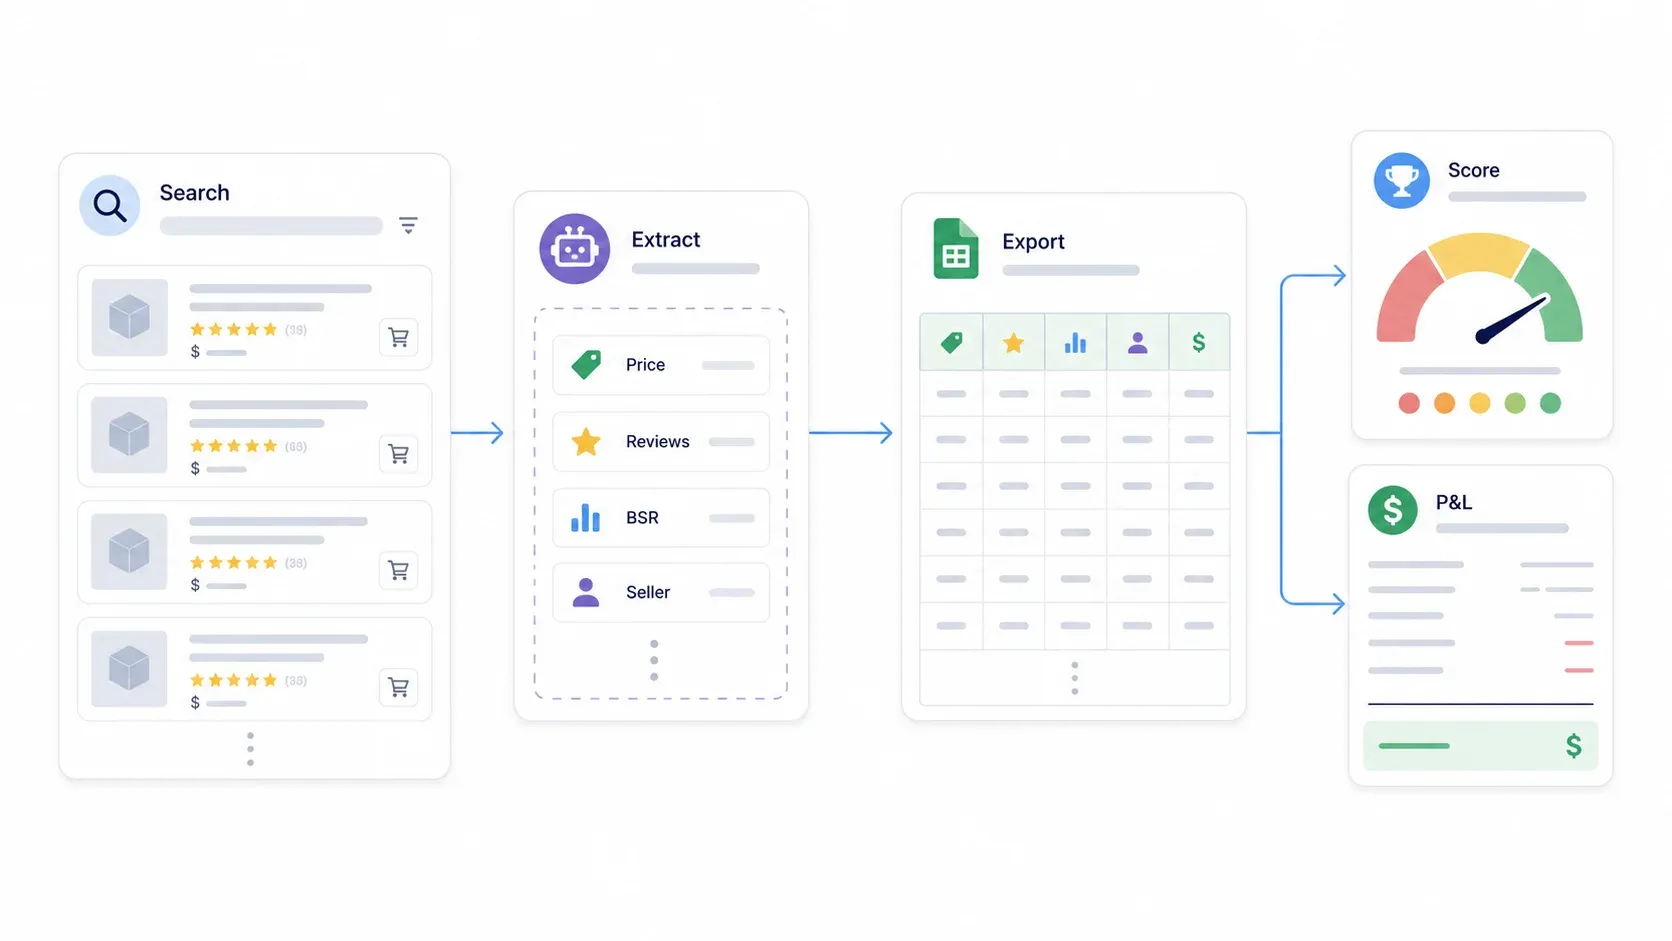
This is the part of the workflow that most niche-research guides completely miss. They'll show you how to manually check 10–20 listings, but if you're serious about validating a niche, you need data across hundreds of products — prices, review counts, BSR, ratings, seller counts — to spot real patterns and confirm opportunity.
That's where Thunderbit comes in — an AI-powered Chrome extension we built for exactly this kind of structured data extraction. No code, no templates to maintain, no brittle CSS selectors.
Try Thunderbit for Amazon niche research
Step-by-Step: Scraping Amazon Niche Data with Thunderbit
Difficulty: Beginner
Time Required: ~10 minutes
What You'll Need: Chrome browser, Thunderbit Chrome extension (free tier works), an Amazon search URL
Step 1: Search Amazon for your candidate niche keyword. Go to Amazon.com and search for something like "bamboo cutting board." You should see a standard search results page with product listings.
Step 2: Open Thunderbit and click "AI Suggest Fields." The Thunderbit sidebar will appear. Click the "AI Suggest Fields" button — the AI reads the Amazon results page and suggests columns like Product Name, Price, Rating, Review Count, Product URL, Image, Seller/Brand, and ASIN. You don't have to configure anything manually.
Step 3: Click "Scrape." Thunderbit extracts structured data from all visible listings on the page. Amazon search results typically show about 50 products per page, so you'll get a solid batch immediately.
Step 4: Enable Pagination Scraping. To capture multiple pages of results (not just page 1), turn on pagination scraping. This lets Thunderbit automatically move through pages and collect data from each one.
Step 5: Use Subpage Scraping for deeper data. Enable subpage scraping to have Thunderbit visit each product detail page and enrich your rows with additional data — exact BSR rank, bullet points, number of sellers on that listing, FBA vs. FBM, and more.
Step 6: Export to Google Sheets or Excel. Click export and send everything to Google Sheets, Excel, Airtable, or Notion — all free. Now apply the profitability math and competition scoring rubric from earlier.
For popular sites like Amazon, Thunderbit also offers instant scraper templates — pre-configured extraction patterns for one-click data collection. The Product Info Scraper page lists fields like product title, URL, price, list price/discount, rating, review count, shipping/delivery, seller/brand, image URL, and ASIN.
Thunderbit vs. Manual Research vs. Paid Niche Tools
| Method | Data Coverage | Speed | Cost | Flexibility |
|---|---|---|---|---|
| Manual browsing | ~10–20 listings | Slow | Free | Limited |
| Paid niche tools (Jungle Scout, Helium 10) | Pre-processed metrics | Fast | $50–$300/month | Limited to tool's data points |
| Thunderbit scraping | Raw, unfiltered data across hundreds of listings | Fast (cloud mode handles up to 50 pages at a time) | Free tier available; paid plans for scale | Fully customizable fields |
The key advantage: scraping gives you raw, unfiltered evidence.
Paid tools are useful, but raw Amazon rows reveal coupons, listing quality, seller names, review language, image quality, variants, and details that a single "opportunity score" may hide. Thunderbit's free tier includes 6 pages/month, with 1 credit = 1 output row and exports always free.
Putting It All Together: Your Complete Niche Validation Checklist
Here's the full framework condensed into a repeatable sequence:
- Brainstorm 5–10 niche ideas using autocomplete, Best Sellers, Movers & Shakers, social media, and adjacent-product browsing.
- Check demand with Product Opportunity Explorer, BSR, and Google Trends.
- Estimate niche market size — investigate at >$1M/year, prefer >$5M/year.
- Confirm growth trajectory — avoid niches shrinking from prior peaks.
- Score competition using the 18-point rubric — aim for 15+.
- Screen for red flags — gating, brand dominance, high returns, low price, seasonality, compliance.
- Run full P&L using Amazon Revenue Calculator, supplier quotes, PPC assumptions, return reserve, and storage.
- Bulk-validate your top 2–3 candidates with Thunderbit scraping for deeper data.
- Proceed only if net margin is 30%+, competition is green, demand is growing, and no red flag breaks the model.
This isn't a one-time exercise. Run it again whenever you're evaluating a new niche.
The framework doesn't change; only the inputs do.
What to Do After You Find a Profitable Niche
This article is about niche research, not launch strategy — but here's a quick roadmap for what comes next:
- Start with a small test order: Flapen recommends 200–300 units, with a budget of $5K–$10K depending on traffic strategy. Nformed estimates $4,000–$6,000 minimum for a lean private-label test, or $15,000–$25,000 for a fuller launch. Alibaba's seller blog notes MOQs vary widely, with early-growth brands often ordering 200–500 units.
- Test up to 3–4 products simultaneously: Let real sales data pick the winner, not gut feeling.
- Track three metrics post-launch: Customer rating, conversion rate, and cost per acquisition.
- Kill products that don't meet thresholds; scale the ones that do.
The math doesn't stop at niche selection. It follows you through sourcing, launch, and scaling.
But if you get the niche right, everything downstream gets easier.
Key Takeaways
Finding a profitable Amazon niche is a unit-economics problem, not a product-hunting exercise. The sellers who succeed in 2026 are the ones who run the numbers before they wire money to a supplier.
- Ask the right question: "Can I profitably capture market share in this growing market?" — not "Is this a good product?"
- Always run the P&L math before committing money — aim for 30%+ net margin after all costs.
- Use the competition scoring rubric to objectively evaluate any niche in 5 minutes.
- Know the red flags and walk away early — it saves more money than finding winners.
- Start with free tools, validate with real data (Thunderbit makes this fast), and only invest in paid tools after initial screening.
If you want to try the scraping workflow yourself, Thunderbit's free tier is enough to validate a niche candidate. For a deeper look at Amazon scraping workflows, check out our guide to scraping Amazon products and reviews or our Amazon scraping tutorial. And if you want to see how to export scraped data directly into Google Sheets, we've covered that too.
Try Thunderbit for Amazon niche validation Get Started Free
FAQs
How do I find a profitable niche on Amazon with no experience?
Start free: use Amazon Autocomplete, Best Sellers, Movers & Shakers, and Product Opportunity Explorer to brainstorm and check demand. Score competition with the 18-point rubric. Run the P&L math using Amazon's FBA Revenue Calculator and supplier quotes from Alibaba. Use Thunderbit's free tier to extract real listing data. You don't need paid tools to validate your first niche — you need a spreadsheet and the discipline to run the numbers.
What profit margin should I aim for when selecting an Amazon niche?
Target 30%+ net margin after referral fees, FBA fulfillment, landed COGS, PPC, returns, and storage. The 20–30% range may work if conversion is strong and return rates are low, but below 20% is usually too thin for beginners — one fee increase or PPC spike can wipe out your profit.
Can I do Amazon niche research without paid tools like Jungle Scout or Helium 10?
Yes. Amazon's own Product Opportunity Explorer, FBA Revenue Calculator, Best Sellers pages, and Google Trends cover ideation, demand estimation, and profitability math. Thunderbit's free tier lets you extract structured competitor data from Amazon search results. Paid tools add value for historical data and exact keyword volume, but they're not necessary for initial screening.
What are the worst niches for new Amazon sellers?
Niches that combine multiple red flags: gated/restricted categories (supplements, medical devices, pesticides), brand-dominated markets (80%+ recognizable brands on page 1), high-return categories (clothing, footwear, electronics), sub-$15 commodity products where PPC costs make profitability nearly impossible, seasonal flash niches with 10 months of dead inventory, and products requiring CPSIA, FDA, or EPA certifications.
How many products should I test when entering a new Amazon niche?
For small private-label products, test 2–4 candidates with small first orders (typically 200–300 units each, depending on MOQ and budget). Let real sales data — customer rating, conversion rate, cost per acquisition — pick the winner. Kill products that don't meet your margin thresholds within 60–90 days, and scale the ones that do.
Learn More