

Most guides about Amazon Brand Registry open with brand protection. That's fine, but it's not what sellers typing "amazon brand registry data" actually want to know.
I've read through about a dozen of these articles over the past few weeks — and the frustration is real. They all say roughly the same thing: "protect your brand, unlock A+ Content, get access to analytics." Then they stop. Nobody explains which analytics dashboards exist, what data each one actually contains, how often it refreshes, or (this is the big one) how to get that data out of Seller Central and into a spreadsheet where you can do something useful with it.
Amazon has previously disclosed over 700,000 active brands enrolled in Brand Registry, and the majority of those sellers are sitting on data tools they either don't know about or don't know how to use. This article is the missing map — report by report, real limitations included, practical workflows attached, and an honest look at whether the trademark investment pays off.
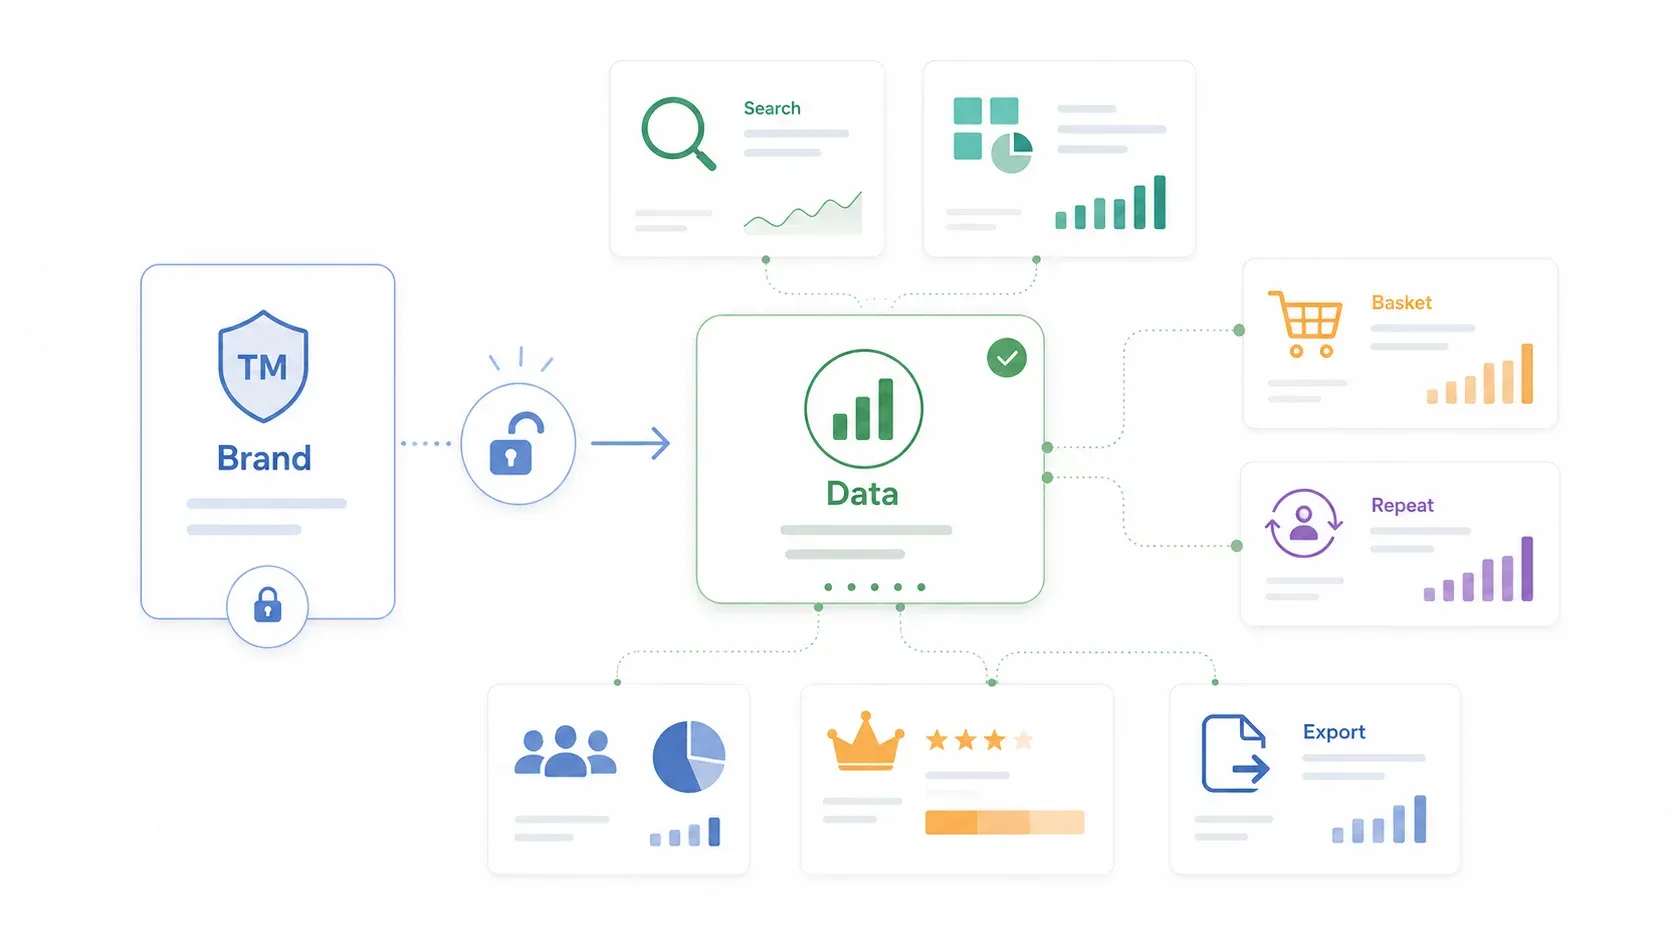
What Is Amazon Brand Registry Data?
Amazon Brand Registry is a free Amazon program for trademarked brands that unlocks analytics dashboards, enhanced listing tools, advertising options, and IP enforcement inside Seller Central. You enroll with an active or pending trademark, and once approved, you get access to a suite of tools that most sellers lump together under "Brand Registry benefits."
Here's the distinction that matters for this article: Brand Registry is the enrollment program. Brand Analytics is the collection of data dashboards you unlock once enrolled. Many sellers conflate the two, which is part of why existing content feels so vague — it mixes brand protection features with analytics features and calls them all "Brand Registry."
Think of it like a gym membership. Brand Registry is the membership card. Brand Analytics is the actual equipment inside.
Brand Analytics is not a paid add-on. There's no extra subscription fee. You need a Professional selling account and Brand Representative status for an enrolled brand. That's it. Vendor Central users get overlapping but different report families (Amazon Retail Analytics), so this article focuses on the third-party seller experience in Seller Central.
Who qualifies: any seller with a brand name or logo permanently affixed to their product or packaging, plus a pending or registered trademark from a designated trademark office. No trademark, no entry — wholesalers, resellers, and dropshippers are out.
Every Amazon Brand Registry Data Report — at a Glance
Nobody consolidates all the Brand Analytics dashboards in one place. Every competitor article either lists three or four reports and ignores the rest, or buries them in paragraph form.
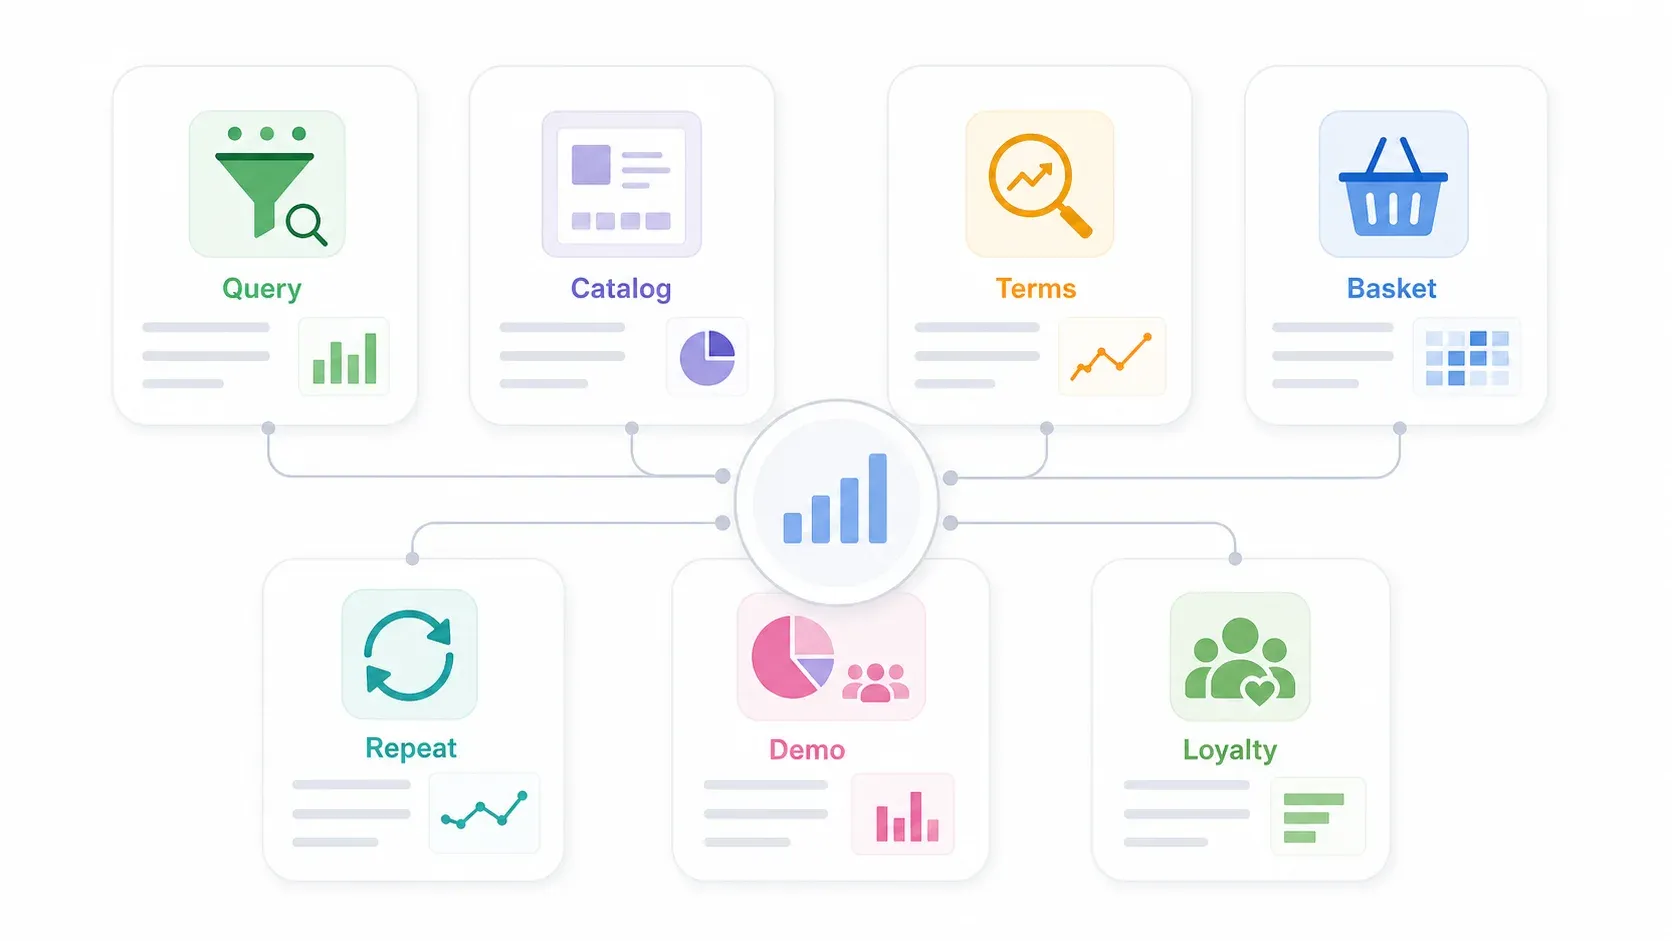
So here's the full picture.
| Report | What Data It Contains | Refresh / Period Options | Best Use Case |
|---|---|---|---|
| Search Query Performance | Impressions, clicks, cart adds, purchases by keyword; share metrics; query volume; median prices | Week, Month, Quarter; data generally available within 3 days | Keyword gap analysis, funnel diagnosis |
| Search Catalog Performance | ASIN-level impressions, clicks, click rate, median price, cart adds, purchases, conversion rate | Week, Month, Quarter | Listing optimization, ASIN health |
| Top Search Terms | Top search terms across Amazon, search frequency rank, top 3 clicked ASINs, click share, conversion share | Day, Week, Month, Quarter (API); Weekly/Monthly/Quarterly (UI) | Trend spotting, PPC keyword seeding |
| Market Basket Analysis | Products frequently purchased alongside your ASINs, purchased-with rank, combination percentage | Day, Week, Month, Quarter (API); periodic/monthly (UI) | Cross-sell, bundles, product-line expansion |
| Repeat Purchase Behavior | Orders, unique customers, repeat customer %, repeat purchase revenue | Week, Month, Quarter | Subscribe & Save candidates, retention |
| Demographics | Age, income, education, gender, marital status (aggregated) | Week, Month, Quarter; US store only; requires 100+ unique customers | Audience targeting, ad creative direction |
| Customer Loyalty Analytics | New-to-brand, repeat, top-spend, at-risk segments; engagement recommendations | UI dashboard | LTV analysis, retention planning |
Amazon's current Brand Analytics page also surfaces Customer Journey Analytics, a newer module showing journey-stage insights and high-impact products. It's worth knowing about, but the seven reports above are what most sellers mean when they say "Brand Analytics data."
Inside Seller Central, these reports live under two sub-menus: Search Analytics (Search Query Performance, Search Catalog Performance, Top Search Terms) and Consumer Behavior Analytics (Market Basket, Repeat Purchase, Demographics). Customer Loyalty sits as its own dashboard area at the top of Brand Analytics. Source: Amazon Brand Analytics blog.
Search Query Performance: Your Keyword Intelligence Dashboard
Search Query Performance (SQP) is the report that gets the most love in seller forums — and for good reason. It shows exactly which search queries led customers to your products, broken down by impressions, clicks, cart adds, and purchases at the query level.
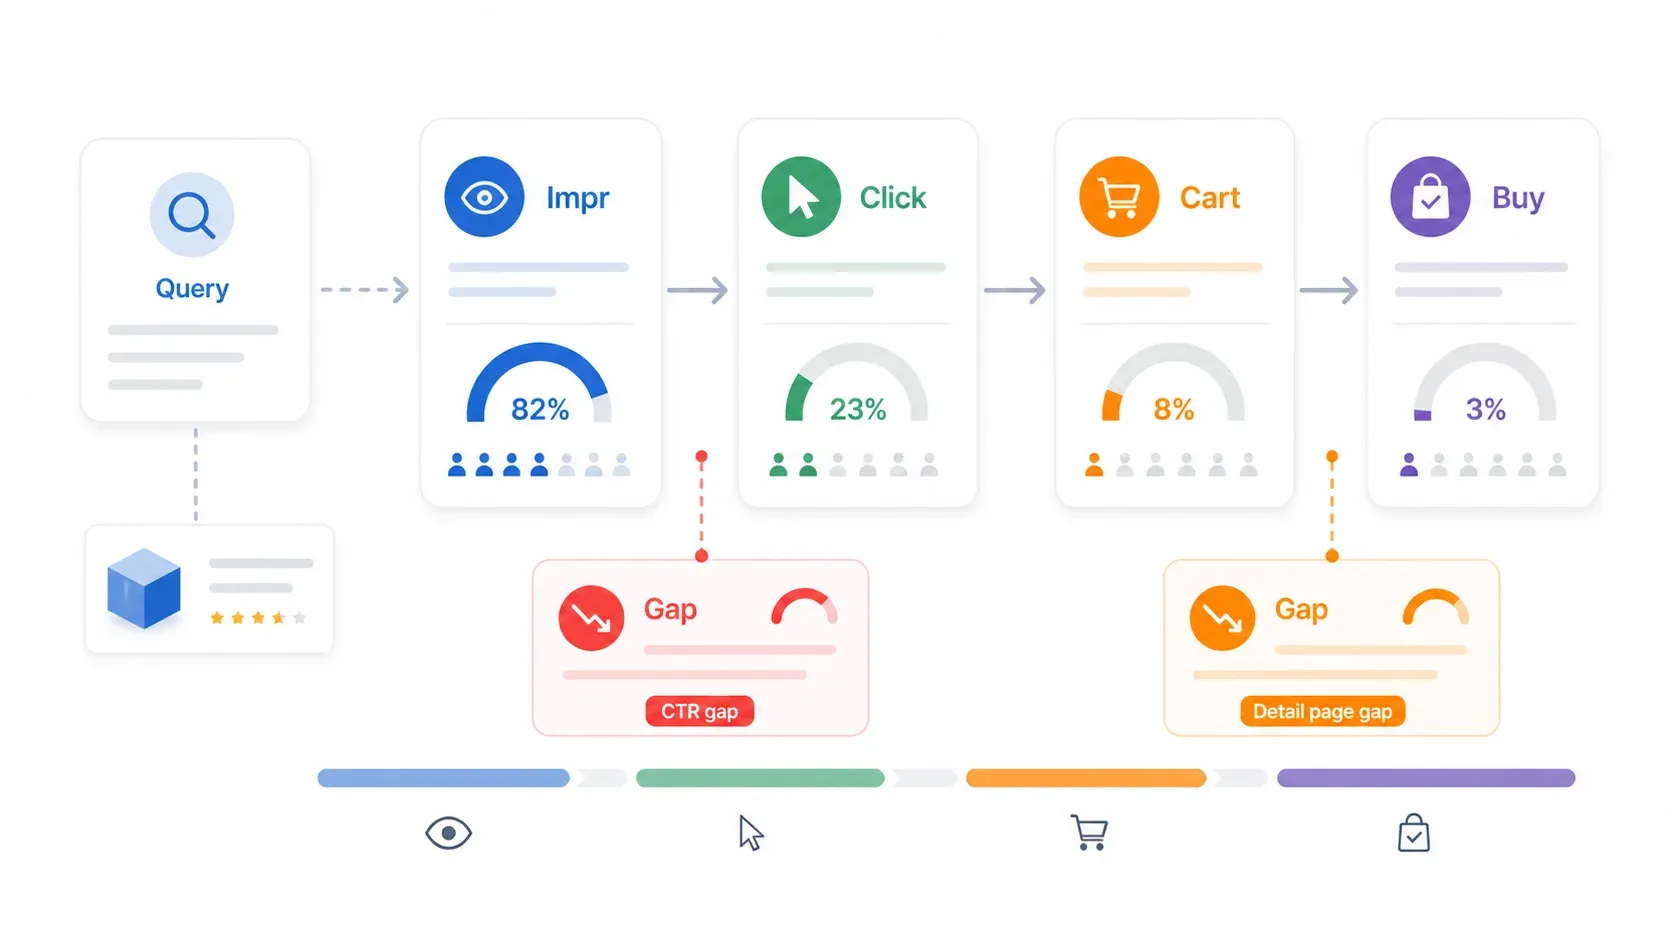
Two views matter: Brand View (all your brand's ASINs aggregated) and ASIN View (drill into a specific product).
Key metrics include search query score, search query volume, total query impression count, and your ASIN's impression share, click share, cart-add share, and purchase share relative to the total.
Say your stainless steel lunch box has 8% impression share but only 1.5% click share for the query "stainless steel lunch box." That means shoppers are seeing your listing in search results but choosing competitors instead. The problem is almost certainly your main image, title, price, rating, coupon badge, or delivery promise — the elements visible on the search results page before anyone clicks through. If click share is strong but purchase share is weak, the issue shifts to your detail page: A+ Content, reviews, bullet points, or pricing.
SQP also includes same-day, one-day, and two-day shipping click/cart-add/purchase counts in the SP-API schema, which is useful for understanding whether delivery speed is a conversion factor for specific queries.
One note: SQP captures Amazon search performance across organic and paid exposure. It is not an ads-only report, but it's also not cleanly labeled as "organic only" by Amazon. Don't treat it as a direct replacement for your PPC Search Term Report — treat it as a broader search funnel diagnostic.
Search Catalog Performance: How Your Products Perform in Search Results
SQP starts with a keyword: "how does my brand show up?" Search Catalog Performance flips the question — it starts with an ASIN: "how does this product perform across all search traffic?"
The report shows impressions, clicks, click rates, median prices at each funnel stage, cart adds, purchases, search traffic sales, and conversion rates for your catalog. Source: Amazon Brand Analytics blog.
Use this when the question is ASIN-centric: "Which of my products are leaking clicks?" or "Which have traffic but weak conversion?" The median price fields at impression, click, cart, and purchase stages are directional signals for competitive pricing — they show you the price context shoppers are seeing alongside your listing. They're not a full competitive price history, but paired with Buy Box data and coupon analysis, they're genuinely useful.
SP-API fields confirm same-day and one/two-day shipping counts here too, so delivery speed analysis carries across both search reports. Source: SP-API Analytics Reports.
Top Search Terms: Spot Trends Before Your Competitors Do
Unlike the previous two reports, Top Search Terms is broader than your brand. It surfaces popular search terms across the entire Amazon marketplace — search frequency rank, the top three clicked ASINs for each term, and each ASIN's click share and conversion share.
The SP-API documentation describes an approximately 12 million item limit across search-term/department/clicked-ASIN rows — significantly larger than the "top 1 million terms" figure that older guides cite. Time-range options span daily through quarterly.
Most sellers underuse this report because they don't realize it covers the entire marketplace, not just their own brand. That makes it a trend-spotting tool. Is "biodegradable phone case" surging this quarter? Is a competitor suddenly appearing in the top three clicked ASINs for your core keywords?
You can catch these shifts here before they show up in your sales reports.
Practical application: export weekly or monthly, track search frequency rank movement over time, and flag terms where a competitor enters the top three. Feed rising terms into PPC campaigns and listing SEO before the rest of your category catches on.
Market Basket Analysis: What Customers Buy Alongside Your Products
Ever wonder what else lands in the cart alongside your product? Market Basket Analysis answers that. It reveals the top products customers most frequently purchase in the same order as your ASINs. Amazon's UI includes a "Products displayed" dropdown that can include or exclude other brands, and the SP-API fields are asin, purchasedWithAsin, purchasedWithRank, and combinationPct. Source: SP-API Market Basket report.
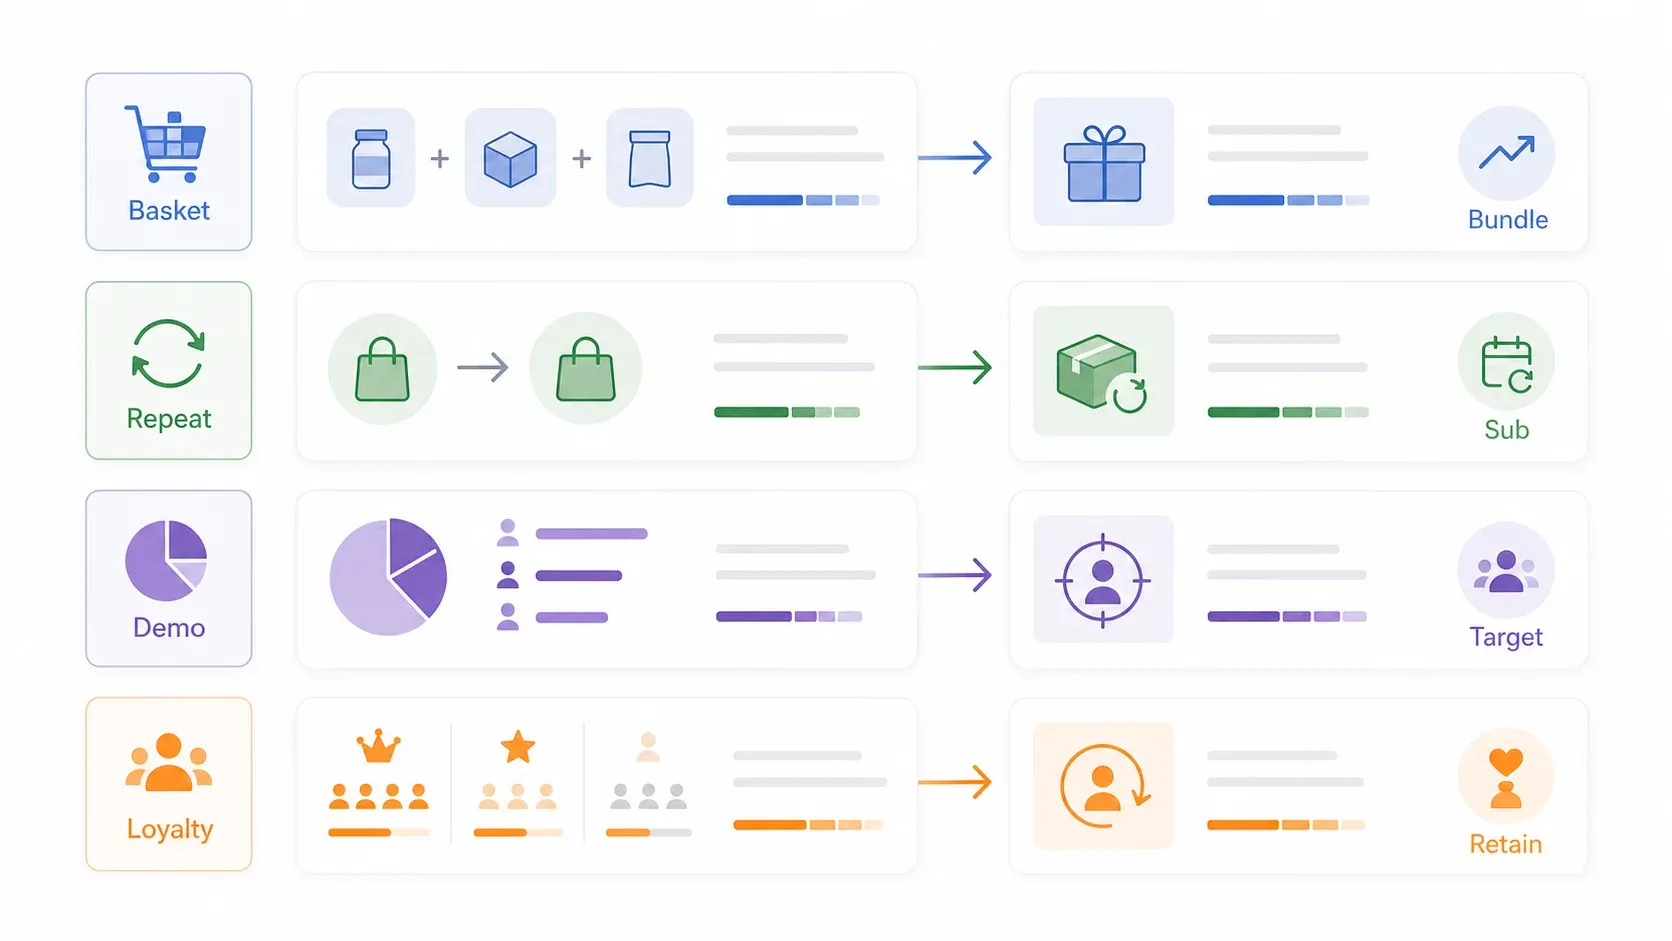
HexClad's Jason Panzer has said Market Basket helped determine which items to cross-sell or upsell by identifying typical purchase combinations. Source: Amazon Brand Analytics.
If you sell yoga mats and discover 30% of buyers also purchase a foam roller, that's a bundle opportunity. Test a virtual bundle, cross-promote in Sponsored Brands, add a comparison module in A+ Content, and then watch the Repeat Purchase dashboard to see if the bundle drives retention.
Amazon explicitly suggests using this report for inventory decisions, Virtual Bundles, and cross-marketing opportunities. Source: Amazon Brand Analytics blog.
Repeat Purchase, Demographics, and Customer Loyalty Reports
These three Consumer Behavior reports share a customer-profiling purpose, so they earn a joint section.
Repeat Purchase Behavior
This one shows total orders, unique customers, repeat customer percentage, and repeat purchase revenue per ASIN over a selected period. SP-API fields include orders, uniqueCustomers, repeatCustomersPctTotal, and repeatPurchaseRevenuePctTotal.
The use case is straightforward: which ASINs are subscription candidates versus one-time purchases? If your protein powder has a 35% repeat rate but your shaker bottle is at 3%, the protein powder is your Subscribe & Save candidate.
Demographics
US-only. Requires 100+ unique customers for ASINs in the selected time range. Displays aggregate data for age, household income, education level, gender, and marital status. Data goes back about three years.
Honest take: this is a "nice to have." Useful context for ad creative and audience targeting, but it rarely changes weekly decisions. If you discover 60% of your buyers are women aged 25–34 with household income above $75K, that should inform your Sponsored Display targeting and maybe your packaging — but you're not checking this dashboard every Monday.
Customer Loyalty Analytics
Segments buyers into Top Tier, Promising, At Risk, and Hibernating cohorts. Shows new customers, orders, sales, and recommended engagement actions like promo codes. Source: Amazon Brand Analytics blog.
Availability caveat: Customer Loyalty and Customer Journey Analytics are prominent in Amazon's current Brand Analytics page, but I did not find matching SP-API Brand Analytics report types for them. Treat these as Seller Central dashboard-only features unless your account's API documentation says otherwise.
Beyond Dashboards: Other Data and Tools You Unlock
Brand Analytics gets the headline here, but enrollment also unlocks several other data-adjacent tools worth a quick mention:
- A+ Content: Enhanced product descriptions with images, comparison charts, and brand stories. Amazon says Basic A+ Content can increase sales by up to 8%, and well-implemented Premium A+ Content up to 20%. These are Amazon's figures, not guarantees.
- Manage Your Experiments: Native A/B testing for titles, images, bullet points, descriptions, and A+ Content. Now supports multi-attribute experiments. Real test data, not gut feel.
- Sponsored Brands and Sponsored Display: Ad types exclusive to registered brands.
- Brand Store: A custom storefront on Amazon with its own analytics (Brand Store Insights — different from Brand Analytics).
- IP Enforcement Tools: Project Zero, Transparency, Report a Violation, and the Impact Dashboard that shows blocked/removed infringing listings by country and category. Amazon's 2024 Brand Protection Report says Transparency has enrolled 88,000 brands and verified over 2.5 billion units.
Supporting tools, not the focus. The data story lives in Brand Analytics.
How to Export and Extract Amazon Brand Registry Data
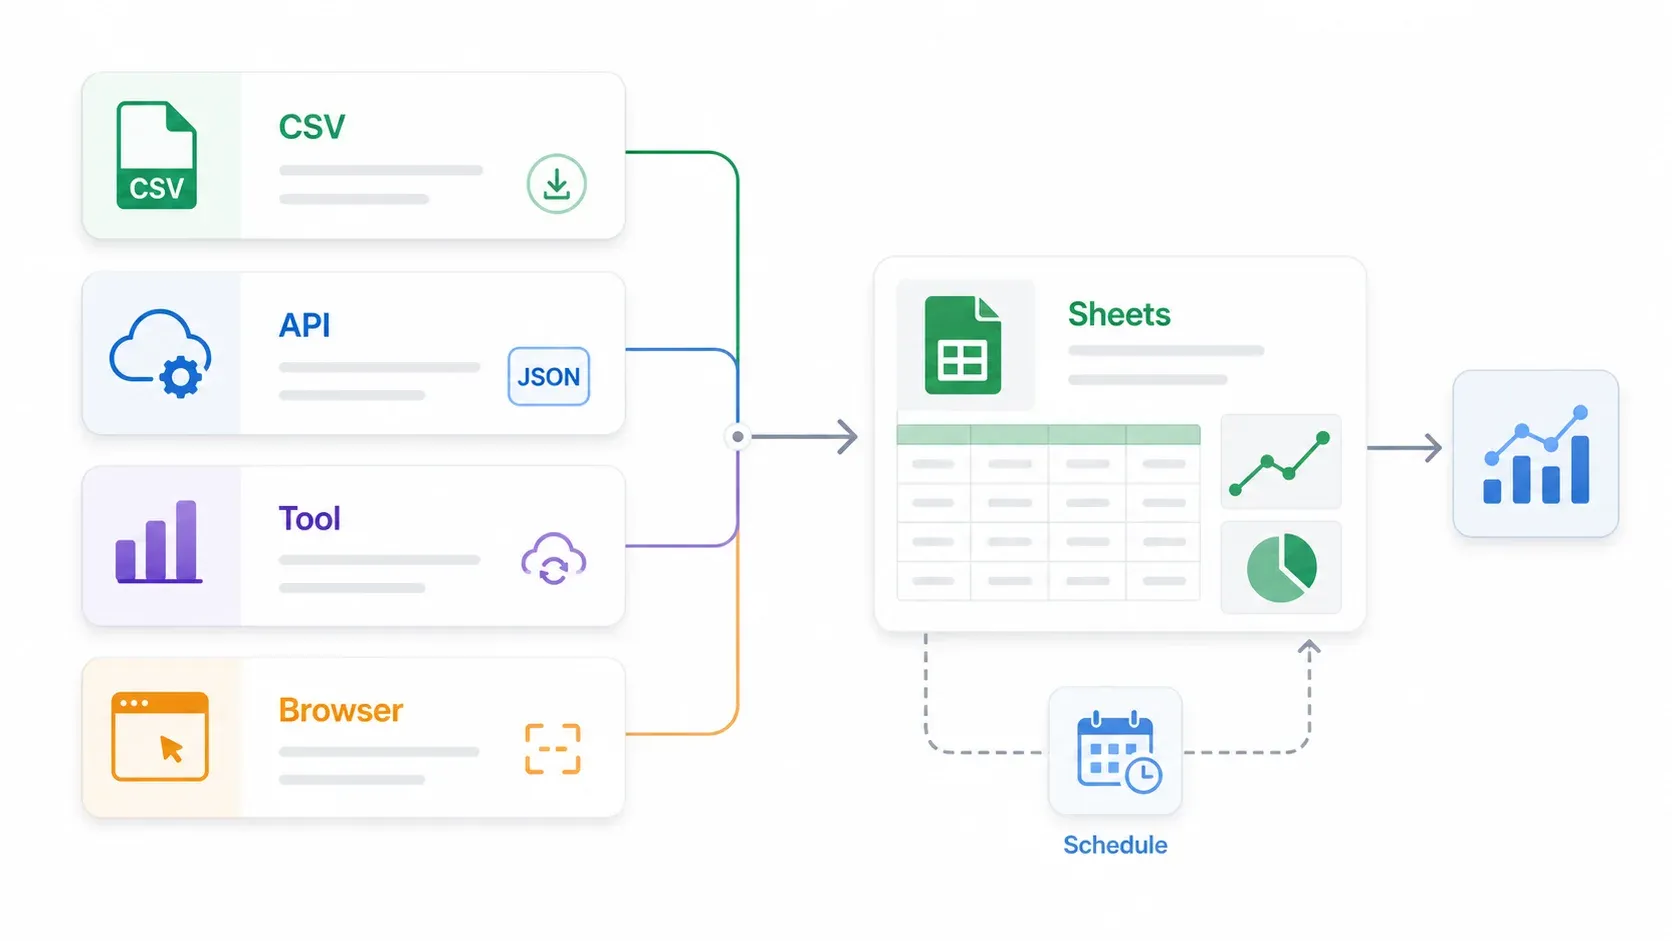
Ugh, I don't want to admit how long I spent looking for this in other articles. I read every top-ranking result for "amazon brand registry data" and not one explains how to get the data out of Seller Central for external analysis.
So here's the full spectrum.
Manual CSV Export
Several Brand Analytics dashboards expose download/export controls inside Seller Central. Availability varies by marketplace, account, and report — I won't claim "all seven support CSV." Search and Consumer Behavior reports commonly support download, but verify per dashboard because Amazon changes UI and permissions without much fanfare.
Limitations: date-range restrictions, row limits, and the tedium of manually clicking download every week.
For a solo seller, this is fine. For a team managing 50+ ASINs across multiple marketplaces, it gets old fast.
Amazon Selling Partner API (SP-API)
Five Brand Analytics report families are currently confirmed in the SP-API: Search Catalog Performance, Search Query Performance, Market Basket, Amazon Search Terms, and Repeat Purchase. All are request-only JSON reports.
Important: Amazon's Reports API FAQ explicitly states that Seller Central and the Reports API are not identical — some reports are exclusive to one or the other, and similar reports may not contain the same attributes. This option requires developer resources and SP-API authorization.
Third-Party Tools
Tools like Helium 10, Jungle Scout, and DataDoe can ingest Brand Analytics data through various methods — official SP-API ingestion, Advertising API connections, or their own data pipelines. These are worth evaluating if you want pre-built dashboards and trend tracking without building your own infrastructure.
Browser-Based Extraction with Thunderbit
For sellers who need to extract dashboard data that isn't available via API or CSV — custom date ranges, cross-marketplace comparisons, or console-only reports like Customer Loyalty — a browser-based approach can fill the gap.
Since Brand Analytics requires login, Thunderbit is well-suited here. It operates in the user's authenticated session, so there's no credential sharing. You navigate to any Brand Analytics page, click "AI Suggest Fields" to auto-detect the table structure, and export to Google Sheets, Excel, Airtable, or Notion. For recurring exports — say, auto-exporting Top Search Terms every Monday — Thunderbit's scheduled scraping can handle that.
Try Thunderbit for Brand Analytics Exports
A compliance note: prioritize Amazon's native exports and SP-API where available. Only extract your own account data, avoid high-frequency automation, do not collect PII, and review Amazon's current Business Solutions Agreement and automation policies before scheduling. This is your data in your account, but Amazon's rules still apply.
For more on web scraping without coding or how AI web scraping works in practice, we've covered both topics in depth on the Thunderbit blog.
What Amazon Brand Registry Data Does NOT Tell You
Every top-ranking article skips this section. Meanwhile, it's the one sellers in forums ask about most.
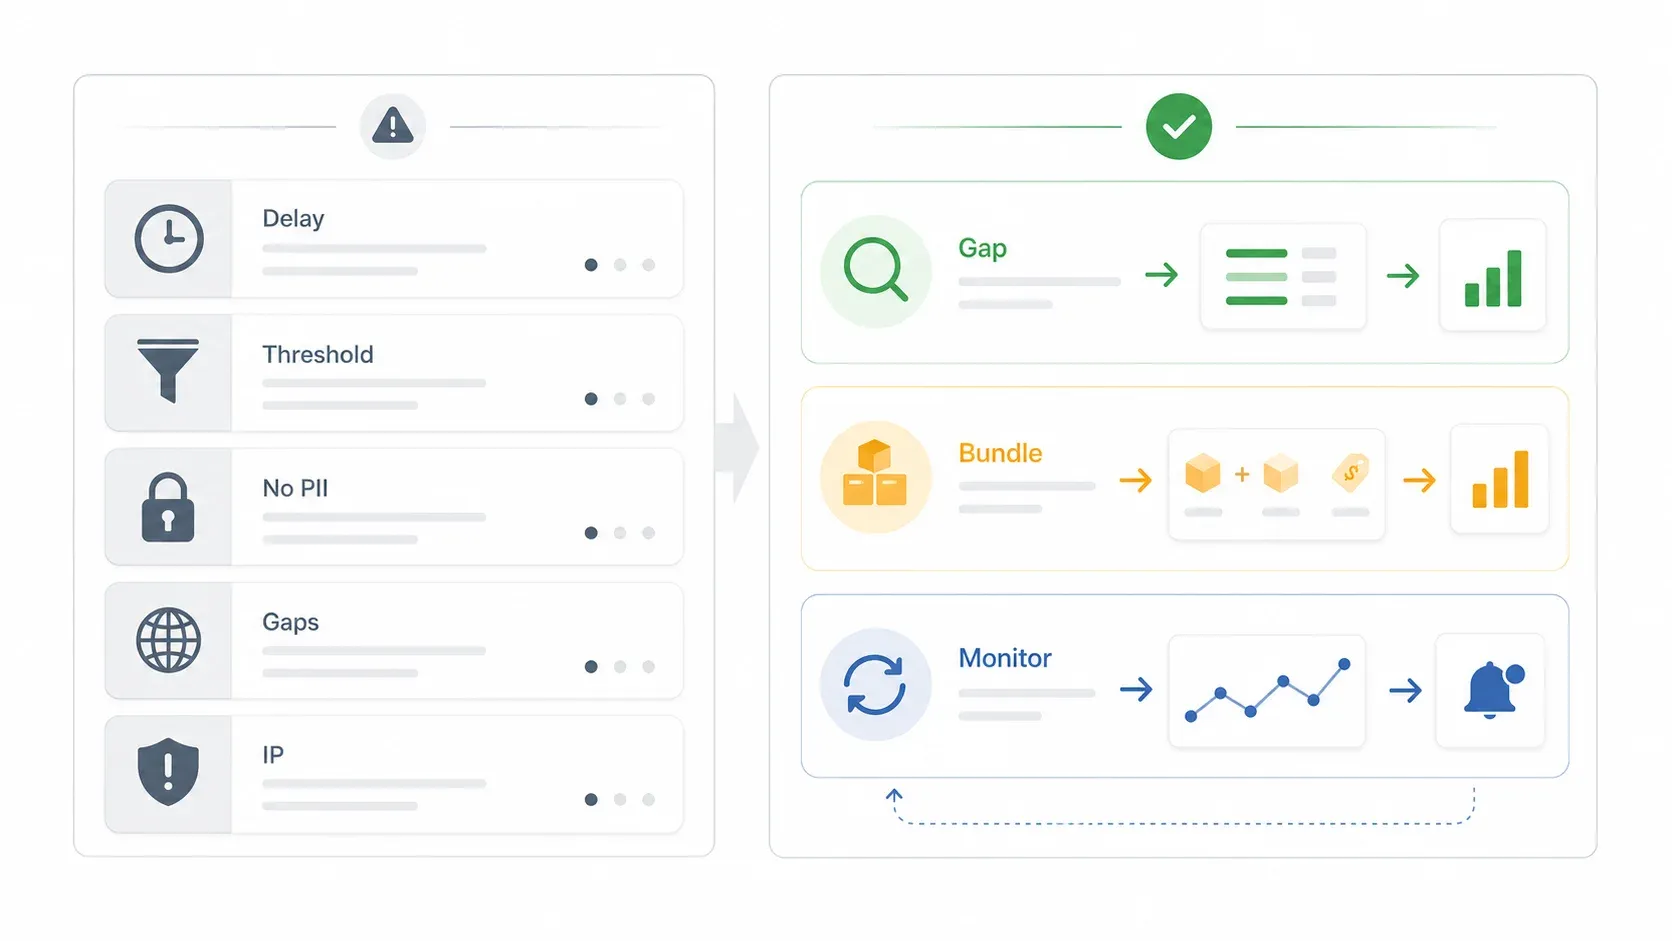
Brand Analytics is powerful. It also has real limitations.
Data Freshness and Retention
Brand Analytics data is generally available within 3 days, with quarter-end data typically within one week. These are weekly snapshots, not real-time feeds. The SP-API documentation for monthly SQP reports indicates a maximum reporting period of 17 months. Amazon says data usually goes back about three years in the UI, but older data can be harder to access or may not be available for all reports. If you don't export proactively, you may lose access to historical data you need.
Aggregation Thresholds
Search terms with low volume are suppressed. You won't see long-tail terms below a certain threshold. Demographics requires 100+ unique customers in the selected range. You get relative share metrics (percentages and ranks), not exact search volumes.
No Individual-Level Data
All Brand Analytics data is aggregate. No raw clickstream, no session-level data, no individual shopper behavior, no customer emails or PII. This is aggregate customer data by design.
Marketplace Availability Gaps
Demographics is US-only. Repeat Purchase is available in a specified marketplace list (US, MX, CA, BR, several EU countries, IN, SG, AU, JP). Customer Loyalty and Customer Journey may not be equally available everywhere.
Brand Protection Data Is Reactive
Amazon's automated systems scan billions of attempted detail-page changes daily, and brand infringement notices are down about 35% since 2020. But Brand Registry does not auto-remove every hijacker. Report a Violation is still the path when proactive controls miss issues. As forum users regularly note: you still have to file reports manually.
| What Brand Registry Data CAN Do | What It CANNOT Do |
|---|---|
| Show relative search term share | Provide exact search volumes |
| Reveal which ASINs capture clicks per keyword | Show individual customer journeys |
| Identify frequently co-purchased products | Predict future demand |
| Segment customers by aggregated demographics | Give customer-level PII or emails |
| Track repeat purchase rates | Explain why customers return (or don't) |
| Show Amazon proactive IP actions | Eliminate all manual enforcement work |
From Amazon Brand Registry Data to Action: 3 Practical Workflows
Data in a dashboard is just a screensaver. Here's how to turn it into Monday-morning action — three workflows no competitor article provides.
Workflow 1: Keyword Gap Discovery
- Open Search Query Performance → switch to ASIN View → filter to your target ASIN.
- Sort by queries where your impression share is above 5% but click share is below 2%.
- These are keywords where shoppers see your listing but choose competitors. The gap is in your search-result-page presence: main image, title, price, rating, coupon, or delivery badge.
- Update the weakest element for those keywords. (If your main image is identical to three competitors, that's your problem.)
- Re-check in two weekly periods. One week is often too noisy to draw conclusions.
Workflow 2: Bundle Opportunity from Market Basket Data
- Open Market Basket Analysis → identify the top 3 products bought alongside your hero ASIN.
- Separate your own catalog items from other-brand complements.
- Evaluate feasibility of a multi-pack or virtual bundle. Amazon's own Market Basket section explicitly recommends Virtual Bundles.
- Launch the bundle → track Search Catalog Performance conversion rate for the new ASIN → monitor Repeat Purchase Behavior to see if the bundle drives retention.
Workflow 3: Weekly Export-and-Monitor Loop
- Export Top Search Terms weekly — via CSV download, SP-API, or Thunderbit's scheduled scraping for automated recurring exports.
- Load into a Google Sheet.
- Track week-over-week search frequency rank changes and top-three clicked ASIN movement.
- Flag keywords where your ASIN drops from the top three or a competitor gains share.
- Trigger PPC bid adjustments and listing copy updates for flagged terms.
One seller testimonial from Amazon's Brand Analytics page puts this in perspective: thefitguy says quarterly sales "jumped over 40%" after optimizing for best search terms using the Search Terms and Search Query Performance reports. That's a case quote, not a guaranteed benchmark — but it illustrates what happens when you actually act on the data instead of just looking at it.
Is Amazon Brand Registry Data Worth the Trademark Investment?
"I've put this off for a long time… just curious sales wise." That quote shows up in seller forums constantly. People cite costs, worry about the time sink, and want a clear ROI picture before committing.
Here's the honest breakdown.
The Real Costs
- Trademark filing: $350 base application fee per class via USPTO (as of the 2025 fee changes — the older $250/$350 TEAS Plus/Standard split was replaced by a single base model effective January 2025).
- Attorney fees (optional but recommended): $300–$600, though some IP Accelerator providers charge more.
- Packaging updates if needed: ~$200–$500 depending on complexity.
- Time investment: ~2–4 weeks for trademark approval processing, 2–10 days for Brand Registry enrollment after trademark. Amazon's IP Accelerator has helped 16,000+ brands obtain trademark protection and can speed up Brand Registry access.
What You Get in Return
- Full Brand Analytics suite (free — no additional cost once enrolled).
- A+ Content (potential conversion lift).
- Sponsored Brands ad eligibility.
- Brand Store.
- Listing control and IP enforcement tools.
- Manage Your Experiments for A/B testing.
Simple Decision Framework
- Selling private label on Amazon with live ASINs? → Almost certainly worth it. Brand Analytics data alone justifies the trademark cost for most private-label sellers. The compound value of analytics + A+ Content + Sponsored Brands + listing control makes Brand Registry table stakes.
- B2B brand with unauthorized resellers on Amazon? → Worth it for listing control and IP enforcement. The data dashboards are a bonus, but your primary ROI comes from preventing unauthorized sellers from degrading your brand presentation.
- Just starting with no products yet? → Wait. You need ASINs, product images, and a clear brand name before Brand Registry adds value. Get your product and trademark strategy sorted first.
Key Takeaways
- Brand Registry is a data program, not just a brand protection program. For most private-label sellers, the seven Brand Analytics dashboards deliver more day-to-day value than the IP tools.
- Each report serves a different question: SQP for keyword diagnostics, Search Catalog for ASIN health, Top Search Terms for marketplace trends, Market Basket for bundle opportunities, Repeat Purchase for retention, Demographics for audience context, Customer Loyalty for segmentation.
- Export your data proactively. Older data can become inaccessible, and the real analysis happens outside Seller Central. Use CSV downloads, SP-API, or browser-based tools like Thunderbit to get data into spreadsheets where you can actually work with it.
- Know the limitations. No real-time data, no exact search volumes, no individual-level behavior, US-only Demographics, and brand protection that still requires manual effort.
- Act on the data, don't just view it. The keyword gap, bundle opportunity, and weekly export workflows above are where the ROI actually lives.
- The trademark investment is worth it for most active Amazon sellers. But the math changes depending on whether you're private label, B2B, or pre-product.
FAQs
1. Is Amazon Brand Analytics free?
Yes. Brand Analytics is completely free once you're enrolled in Brand Registry with a Professional Seller account and Brand Representative access. There's no additional subscription or per-report fee.
2. What is the difference between Brand Analytics and Brand Store Insights?
Brand Analytics covers search behavior and purchase data across dashboards like Search Query Performance, Top Search Terms, Market Basket, Repeat Purchase, Demographics, and Customer Loyalty. Brand Store Insights is specific to your Brand Store — it tracks page views, visitors, and sales/conversion attributed to your storefront. They're separate tools with different purposes.
3. Can I access Brand Analytics without a registered trademark?
You need at least a pending trademark application to enroll in Brand Registry. Amazon's IP Accelerator can connect you with vetted legal service providers and may speed up Brand Registry access while your trademark is still processing.
4. How often is Amazon Brand Registry data updated?
It varies by report. Search dashboards (SQP, Search Catalog, Top Search Terms) support weekly, monthly, and quarterly periods. Consumer Behavior reports (Market Basket, Repeat Purchase) also support weekly through quarterly. Demographics uses week/month/quarter filters. Amazon states data is generally available within 3 days, with quarter-end data typically within one week.
5. Can I export Amazon Brand Analytics data to Excel or Google Sheets?
Some reports support CSV download inside Seller Central. Five Brand Analytics report families are available through the SP-API as JSON reports. For console-only dashboards or custom export needs, browser-based tools like Thunderbit can structure visible table data and export directly to Sheets, Excel, Airtable, or Notion — subject to Amazon's policies.
Try Thunderbit for Amazon Data Exports
Try AI Web Scraper for Amazon Data Exports Get Started Free
Learn More