अगर आपने कभी किसी मीटिंग में यह सवाल सुना हो — "क्या हमें Shopify पर और ज़ोर देना चाहिए या Amazon पर ज़्यादा फोकस करना चाहिए?" — तो आप जानते होंगे कि यह बहस कितनी गरम (और उलझाने वाली) हो सकती है। 2026 में दांव पहले से कहीं ज़्यादा ऊँचे हैं। ई-कॉमर्स तेज़ी से बढ़ रहा है, लेकिन खेल के नियम भी उतनी ही तेज़ी से बदल रहे हैं। मैंने बिक्री और ऑपरेशंस टीमों के लिए ऑटोमेशन और एनालिटिक्स टूल्स बनाने में सालों बिताए हैं, और मैंने खुद देखा है कि सही डेटा कैसे एक अंदाज़े को जीतने वाली रणनीति में बदल सकता है — और गलत डेटा आपको बस इधर-उधर भागते रहने पर मजबूर कर सकता है।
तो चलिए, शोर को अलग रखते हैं। 2026 में Shopify और Amazon सेलर डेटा की तुलना करने के लिए मैंने नवीनतम, सबसे भरोसेमंद आँकड़े और मार्केट इनसाइट्स इकट्ठा किए हैं। चाहे आप फाउंडर हों, सेल्स लीड हों, या बस वही "डेटा वाले" व्यक्ति हों जिनसे सब राय लेते हैं, यह गाइड आपको सही, डेटा-आधारित फैसले लेने के लिए ज़रूरी आँकड़े, संदर्भ और व्यावहारिक सीख देगी। और हाँ, मैं आपको दिखाऊँगा कि Thunderbit जैसे टूल्स कैसे डैशबोर्ड से आगे जाकर पूरी तस्वीर देखने में मदद कर सकते हैं।
क्रॉस-प्लेटफ़ॉर्म डेटा विश्लेषण के लिए Thunderbit आज़माएँ
Shopify बनाम Amazon सेलर डेटा: 2026 के शीर्ष आँकड़े एक नज़र में
आइए सबसे महत्वपूर्ण संख्याओं से शुरू करें। अगर आप अगली टीम मीटिंग में कुछ तेज़ आँकड़े बताना चाहते हैं (या बस बॉस को प्रभावित करना चाहते हैं), तो 2026 के लिए Shopify बनाम Amazon सेलर डेटा के ये सबसे अहम बिंदु हैं:
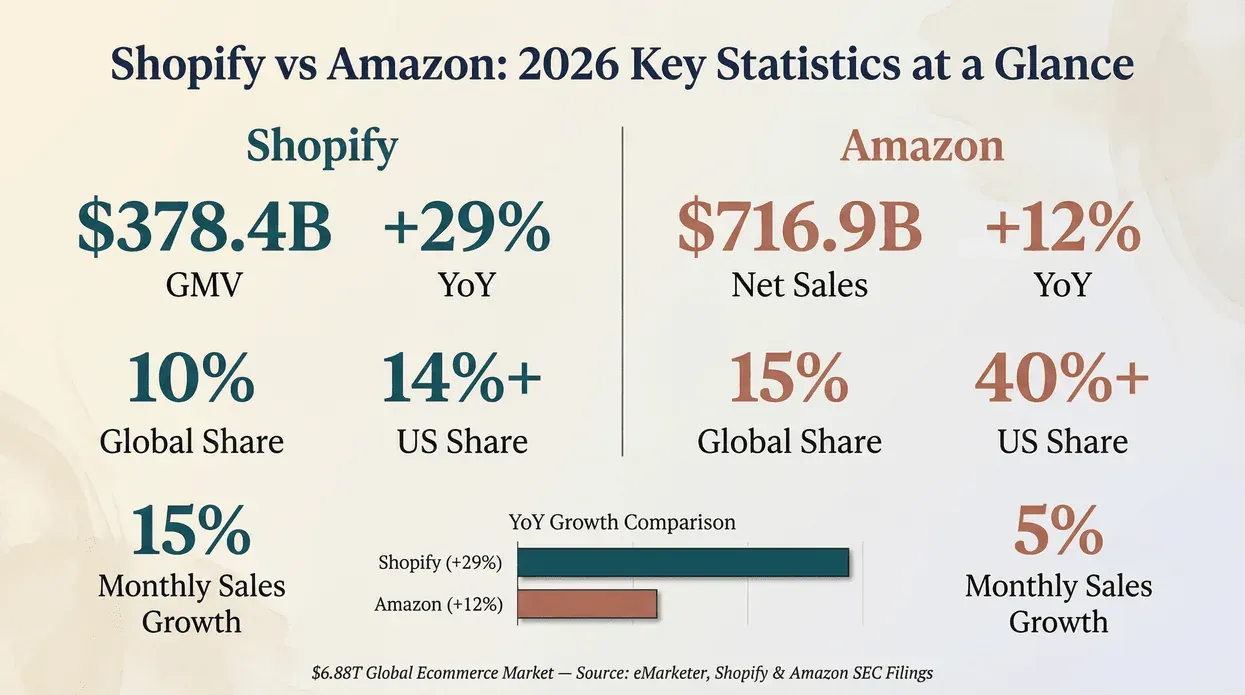
- 2026 में वैश्विक रिटेल ई-कॉमर्स बिक्री $6.88 ट्रिलियन तक पहुँचेगी, जो साल-दर-साल 7.2% की वृद्धि है।
- Shopify का 2025 ग्रॉस मर्चेंडाइज़ वॉल्यूम (GMV) $378.4B तक पहुँचा, यानी YoY 29% की बढ़त। Q1 2026 में एक और $100.7B जुड़ा, जबकि राजस्व YoY 34% बढ़कर $3.17B हुआ — यह पहली बार था जब Shopify ने एक ही तिमाही में $100B GMV का आंकड़ा पार किया।
- Amazon की 2025 शुद्ध बिक्री $716.9B तक पहुँची, यानी YoY 12% की वृद्धि। Q1 2026 में शुद्ध बिक्री 17% बढ़कर $181.5B हो गई, जो FY2025 की गति से तेज़ी दर्शाती है।
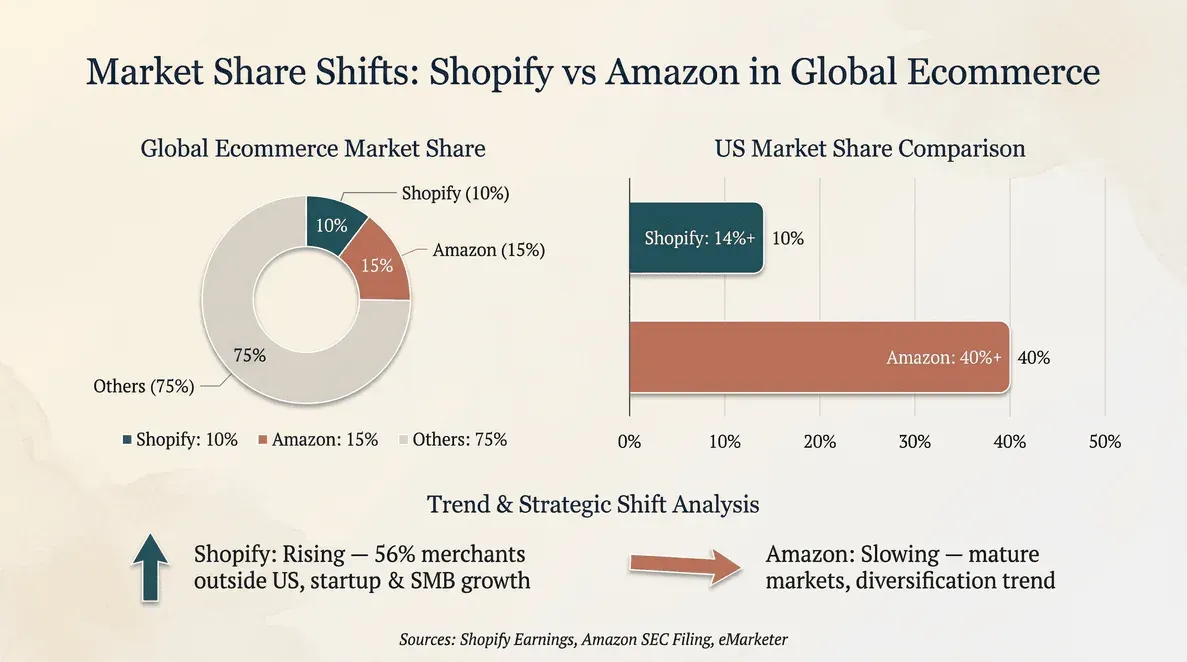
- Shopify की अनुमानित वैश्विक बाज़ार हिस्सेदारी अब 10% है, जबकि अमेरिका में यह 14% से ऊपर है। Amazon की वैश्विक हिस्सेदारी 15% है, लेकिन इसकी वृद्धि दर धीमी हो रही है।
- 2026 में Shopify विक्रेताओं की औसत मासिक बिक्री वृद्धि दर 15% रही, जबकि Amazon विक्रेताओं के लिए यह 5% रही।
- दोहराई गई खरीद दर: Shopify स्टोर्स औसतन 28–35% रहती है, जबकि Amazon की करीब 20% है।
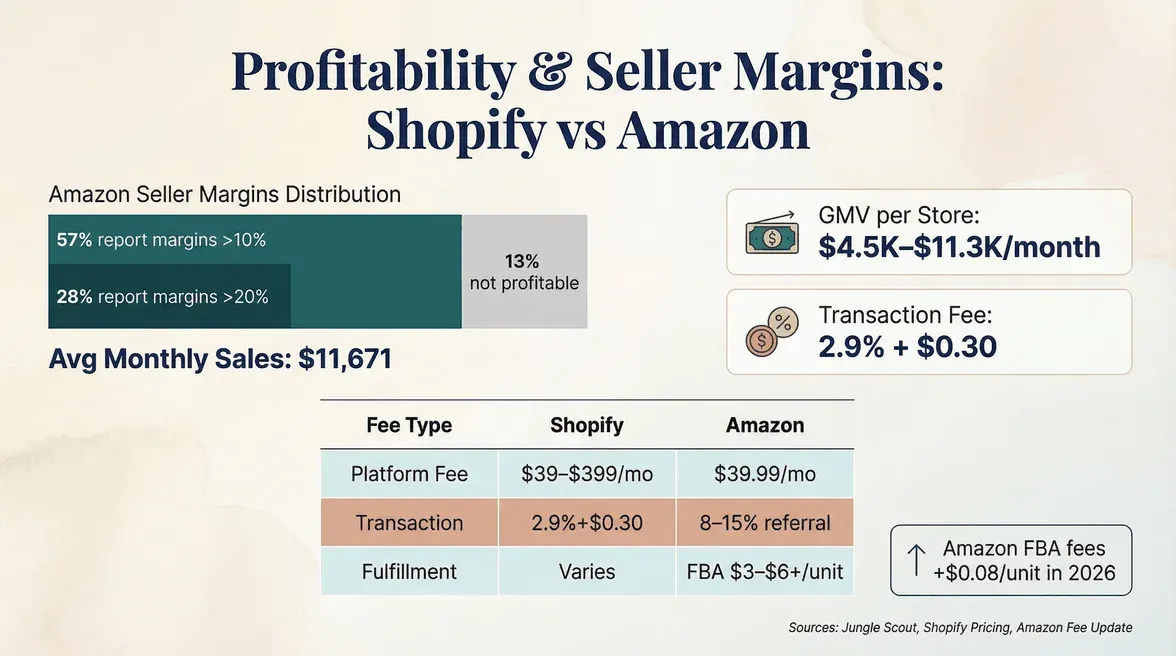
- Amazon के छोटे और मध्यम व्यवसाय (SMB) विक्रेता की औसत मासिक बिक्री: $11,671। स्टोर की संख्या के अनुमान के अनुसार Shopify GMV प्रति स्टोर $4.5K–$11.3K/माह के बीच है।
- Amazon विक्रेता लाभ मार्जिन: 57% का कहना है >10%, और 28% का कहना है >20%। Shopify के लाभ मार्जिन व्यवसाय मॉडल के अनुसार काफ़ी अलग-अलग होते हैं।
- Shopify Analytics गहरी, स्टोर-स्तरीय डेटा विज़िबिलिटी देता है; Amazon Seller Central इन्वेंट्री और बिक्री प्रदर्शन पर ध्यान देता है। Thunderbit क्रॉस-प्लेटफ़ॉर्म डेटा विश्लेषण और प्रतिस्पर्धी निगरानी संभव बनाता है।
- Amazon के FBA शुल्क 2026 में औसतन $0.08 प्रति यूनिट बढ़ेंगे; Shopify के कार्ड रेट 2.9% + $0.30 प्रति लेनदेन से शुरू होते हैं।
यह बहुत सारी संख्याएँ हैं, लेकिन ये एक कहानी सुनाती हैं: Shopify तेज़ी से बढ़ रहा है, Amazon अभी भी दिग्गज है, और दोनों प्लेटफ़ॉर्म पर जीतने के लिए डेटा पर पैनी नज़र रखनी पड़ती है।
Shopify बनाम Amazon बिक्री वृद्धि रुझान: 2026 का डेटा
आइए वृद्धि के आँकड़ों को गहराई से देखें। अगर आप अपना कारोबार किसी प्लेटफ़ॉर्म पर दाँव पर लगा रहे हैं, तो आप जानना चाहेंगे: गति किसके पास है?
Shopify का ग्रोथ इंजन
Shopify का 2025 GMV $378.4 बिलियन तक उछला, यानी साल-दर-साल 29% की बढ़त। यह सिर्फ़ एक अस्थायी उछाल नहीं है — यह लगातार, वैश्विक विस्तार का संकेत है। राजस्व इससे भी तेज़, YoY 30% बढ़ा, और अंतरराष्ट्रीय राजस्व 36% बढ़ा। B2B GMV लगभग दोगुना हो गया (96% की वृद्धि), जो दिखाता है कि Shopify की पहुँच सिर्फ़ DTC ब्रांड्स तक सीमित नहीं है।
यह गति 2026 में भी जारी रही। Q1 2026 में Shopify मर्चेंट्स ने एक ही तिमाही में $100.7 बिलियन GMV पार किया (YoY 35% की वृद्धि, स्थिर-करेंसी आधार पर 30%), राजस्व 34% बढ़कर $3.17 बिलियन हुआ, और B2B GMV साल-दर-साल 80% बढ़ा। Shop Pay ने $35 बिलियन GMV प्रोसेस किया (+59% YoY), जबकि अमेरिका के बाहर Shop Pay की वृद्धि 70% से ऊपर रही — यह संकेत है कि Shopify का अंतरराष्ट्रीय फ़्लाईव्हील अभी भी गति पकड़ रहा है, थम नहीं रहा।
इसकी वजह क्या है? कुछ बातें साफ़ दिखती हैं:
- व्यक्तिगत स्टोर नियंत्रण: Shopify ब्रांड्स को अपने ग्राहक अनुभव पर पूरा नियंत्रण देता है, जो लॉयल्टी और रिटेंशन के लिए बहुत बड़ा फ़ायदा है।
- वैश्विक पहुँच: Shopify मर्चेंट अब 175+ देशों में फैले हैं, जिनमें 44% अमेरिका में, 31% EMEA में, और 16% APAC में हैं (SEC फाइलिंग)।
- लचीला इकोसिस्टम: ऐप इंटीग्रेशन, पेमेंट्स, और एनालिटिक्स दिन-ब-दिन ज़्यादा उन्नत हो रहे हैं।
Amazon की स्थिर, लेकिन धीमी चढ़ाई
Amazon की 2025 शुद्ध बिक्री $716.9 बिलियन तक पहुँची, यानी YoY 12% की बढ़त। "ऑनलाइन स्टोर्स" बिक्री 9% बढ़ी, और "थर्ड-पार्टी सेलर सर्विसेज़" (जो ज़्यादातर SMBs की रीढ़ हैं) 10.3% बढ़ीं। Amazon अभी भी सबसे बड़ा खिलाड़ी है, लेकिन इसकी वृद्धि दर Shopify की आधी से भी कम है।
Amazon की रफ़्तार क्यों धीमी हो रही है?
- मार्केटप्लेस संतृप्ति: अधिक प्रतिस्पर्धा, कठिन विज्ञापन अर्थशास्त्र, और शुल्क वृद्धि।
- सेलर पंजीकरण में सुस्ती: 2025 में केवल ~165,000 नए सेलर पंजीकृत हुए, जो 2024 से 44% कम है (Marketplace Pulse)।
- बढ़ती लागतें: FBA शुल्क बढ़ रहे हैं, और विज्ञापन खर्च मार्जिन खा रहा है।
वृद्धि का विज़ुअलाइज़ेशन
यहाँ एक तेज़ तुलना है:
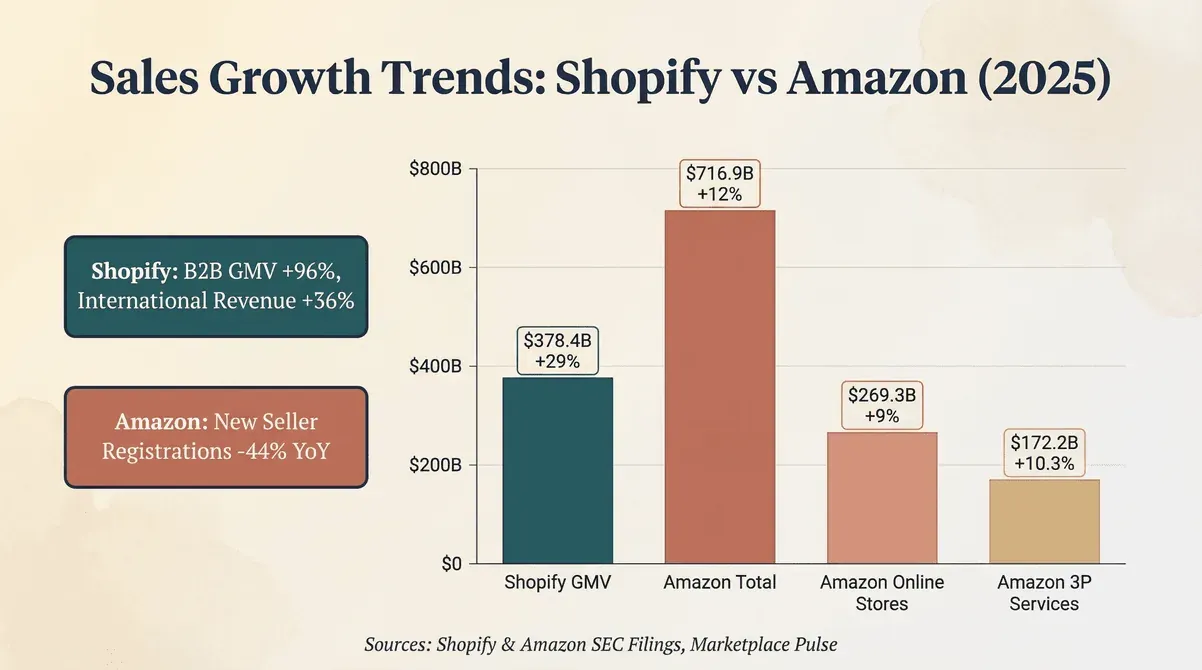
| प्लेटफ़ॉर्म | FY 2025 बिक्री/GMV | FY 2025 YoY | Q1 2026 YoY | उल्लेखनीय रुझान |
|---|---|---|---|---|
| Shopify (GMV) | $378.4B | +29% | +35% (सिर्फ़ Q1 में $100.7B) | अंतरराष्ट्रीय, B2B (Q1 में +80%), DTC, इकोसिस्टम लचीलापन |
| Amazon (कुल शुद्ध बिक्री) | $716.9B | +12% | +17% ($181.5B Q1 में) | Q1 2026 में फिर तेज़ी, AWS (+28%) और विज्ञापनों की अगुवाई में |
| Amazon (ऑनलाइन स्टोर्स) | $269.3B | +9% | +5% (FX को छोड़कर, Q1 2026: $64.3B) | 3P से धीमा |
| Amazon (3P सेलर सर्विसेज़) | $172.2B | +10.3% | +12% FX को छोड़कर ($41.6B Q1 में) | 3P मजबूत, वृद्धि फिर से तेज़ हो रही है |
निष्कर्ष: Shopify अभी भी तेज़ी से बढ़ रहा है (+35% Q1 GMV बनाम Amazon की +17% शुद्ध बिक्री)। Amazon वॉल्यूम का नेता है और — Q1 2026 के आधार पर — ठंडा नहीं हो रहा, बल्कि अधिक केंद्रित हो रहा है: नए सेलर कम हैं, लेकिन बड़े सेलर ज़्यादा हिस्सा ले रहे हैं।
खरीदार व्यवहार तुलना: 2026 में Shopify और Amazon
अब बात करते हैं असली मुद्दे की: आपके सामान को खरीदने वाले लोग। क्या Shopify या Amazon के खरीदार ज़्यादा वफ़ादार हैं? कौन ज़्यादा खर्च करता है? आप असली ब्रांड कहाँ बनाते हैं?
Shopify: लॉयल्टी मशीन
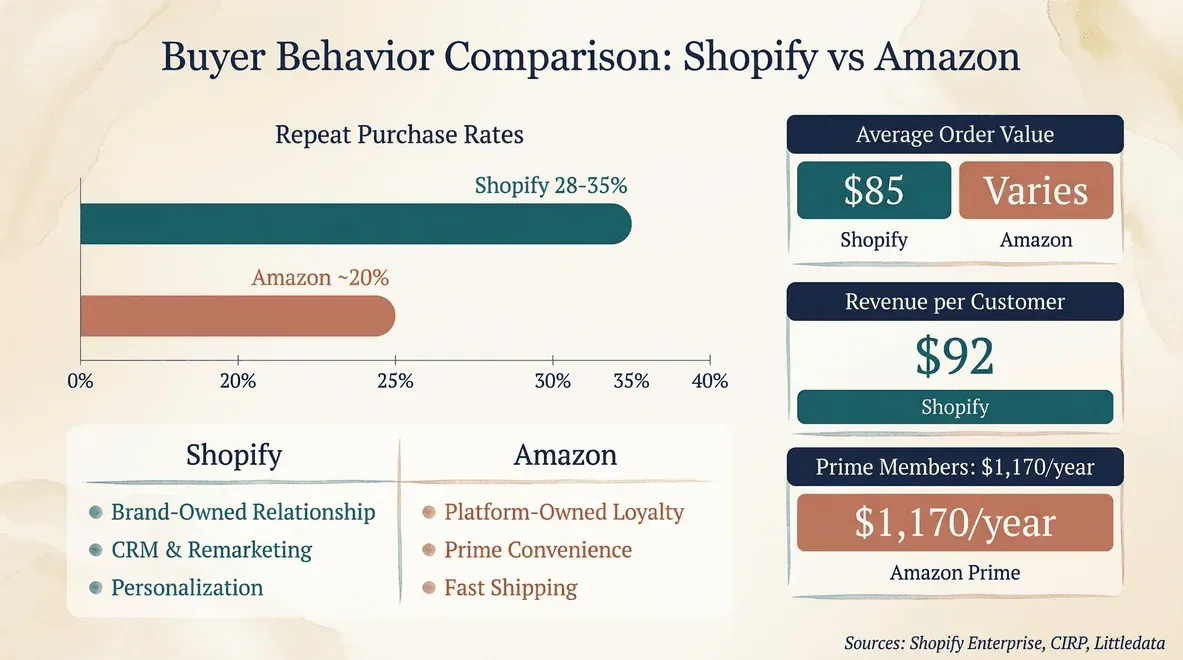
Shopify मर्चेंट्स को ग्राहक बनाए रखने में बड़ा फ़ायदा मिलता है। औसत दोहराई गई ग्राहक दर 28.2% है, और शीर्ष प्रदर्शन करने वाले 35% या उससे अधिक तक पहुँचते हैं। इसका मतलब है कि एक चौथाई से अधिक ग्राहक दूसरी (या तीसरी, या दसवीं) खरीद के लिए वापस आते हैं।
यह इतना ऊँचा क्यों है?
- ब्रांड अनुभव: Shopify स्टोर्स अपने लुक, फ़ील और संदेश पर खुद नियंत्रण रखते हैं। ग्राहक याद रखते हैं कि उन्होंने कहाँ से खरीदा था।
- CRM और रीमार्केटिंग: Shopify का इकोसिस्टम ईमेल, SMS और लॉयल्टी प्रोग्राम चलाना आसान बनाता है।
- व्यक्तिकरण: ब्रांड ऑफ़र, बंडल और खरीद के बाद के अनुभव को अपनी तरह ढाल सकते हैं।
Shopify स्टोर्स के लिए औसत ऑर्डर वैल्यू (AOV) लगभग $85 है, जबकि प्रति ग्राहक राजस्व $92 है।
Amazon: सुविधा का राजा
Amazon की दोहराई गई खरीद की कहानी थोड़ी अलग है। यहाँ वफ़ादारी प्लेटफ़ॉर्म के प्रति होती है, ब्रांड के प्रति नहीं। Prime सदस्य प्रति वर्ष $1,170 खर्च करते हैं और लगभग महीने में दो बार ऑर्डर करते हैं — गैर-Prime खरीदारों की तुलना में दोगुना। लेकिन उनकी निष्ठा Amazon के लिए होती है, आपके स्टोरफ़्रंट के लिए ज़रूरी नहीं।
- अलग-अलग सेलरों के लिए दोहराई गई खरीद दर करीब 20% है।
- औसत ऑर्डर वैल्यू बहुत बदलती है, लेकिन Amazon के पैमाने का मतलब है ज़्यादा बार, छोटे ऑर्डर।
चुनौती क्या है? ग्राहक के साथ सीधा रिश्ता बनाना मुश्किल है। डेटा, संचार, और खोज — सब Amazon के नियंत्रण में है।
खरीदार व्यवहार एक नज़र में
| मेट्रिक | Shopify | Amazon |
|---|---|---|
| दोहराई गई खरीद दर | 28–35% | ~20% |
| औसत ऑर्डर वैल्यू | $85 | अलग-अलग (अक्सर कम, लेकिन बारंबारता अधिक) |
| ग्राहक संबंध | ब्रांड-स्वामित्व | प्लेटफ़ॉर्म-स्वामित्व |
| लॉयल्टी के चालक | अनुभव, CRM, व्यक्तिकरण | Prime, सुविधा, तेज़ शिपिंग |
मुख्य सीख: अगर आप एक वफ़ादार ग्राहक आधार बनाना और lifetime value अधिकतम करना चाहते हैं, तो Shopify आपको उसके लिए टूल्स देता है। अगर आप विशाल इम्पल्स-खरीदारों के समूह तक पहुँचना चाहते हैं, तो Amazon अब भी राजा है।
सेलर एनालिटिक्स टूल्स: Shopify Analytics बनाम Amazon Seller Central बनाम Thunderbit
थोड़ा गीक मोड में चलते हैं — क्योंकि असली बढ़त एनालिटिक्स से आती है।
Shopify Analytics
Shopify के बिल्ट-इन एनालिटिक्स का मक़सद आपको अपने स्टोर का 360° दृश्य देना है:
- बिक्री रुझान: समय के साथ GMV, राजस्व, और कन्वर्ज़न रेट ट्रैक करें।
- ग्राहक इनसाइट्स: दोहराई गई खरीद दर, cohort analysis, और customer lifetime value देखें।
- कस्टम रिपोर्ट्स: ShopifyQL का उपयोग करके अपने डेटा में गहराई से जाएँ, उत्पाद, क्षेत्र, या अभियान के आधार पर segmentation करें।
- विज़ुअलाइज़ेशन: आगे के विश्लेषण के लिए डैशबोर्ड, चार्ट, और एक्सपोर्ट विकल्प।
Shopify के एनालिटिक्स खास तौर पर DTC ब्रांड्स के लिए मज़बूत हैं, जो रिटेंशन, AOV, और personalized marketing को बेहतर बनाना चाहते हैं।
Amazon Seller Central
Amazon का Seller Central ऑपरेशनल प्रदर्शन पर केंद्रित है:
- बिक्री और ट्रैफ़िक रिपोर्ट्स: बिके यूनिट्स, पेज व्यूज़, और कन्वर्ज़न रेट देखें।
- इन्वेंट्री प्रबंधन: स्टॉक स्तर, FBA शिपमेंट, और रीस्टॉक अलर्ट ट्रैक करें।
- Brand Analytics: रजिस्टर्ड ब्रांड्स के लिए शीर्ष खोज शब्द, फ़नल प्रदर्शन, और प्रतिस्पर्धी बेंचमार्क की इनसाइट्स मिलती हैं।
- CSV एक्सपोर्ट: अपने विश्लेषण के लिए कच्चा डेटा डाउनलोड करें।
Amazon के एनालिटिक्स इन्वेंट्री प्रबंधन और प्रदर्शन ट्रैकिंग के लिए बहुत अच्छे हैं, लेकिन गहरे ग्राहक इनसाइट्स या क्रॉस-चैनल विश्लेषण के लिए कम लचीले हैं।
Thunderbit: क्रॉस-प्लेटफ़ॉर्म गेम चेंजर
यही वह हिस्सा है जहाँ मैं उत्साहित हो जाता हूँ। Thunderbit एक AI-संचालित वेब स्क्रैपर है, जो आपको Shopify और Amazon — और उससे आगे — दोनों से डेटा इकट्ठा करने, एकीकृत करने और विश्लेषण करने देता है:
- AI फ़ील्ड सुझाव: बस बताइए आपको क्या चाहिए ("इन Shopify स्टोर्स और Amazon लिस्टिंग्स से सभी प्रोडक्ट कीमतें और रिव्यूज़ स्क्रैप करो"), और बाकी काम Thunderbit खुद समझ लेता है।
- सबपेज स्क्रैपिंग: प्रोडक्ट डिटेल पेज, रिव्यू सेक्शन, या प्रतिस्पर्धी लिस्टिंग्स पर अपने-आप जाएँ और डेटा समृद्ध करें।
- कहीं भी एक्सपोर्ट करें: डेटा सीधे Google Sheets, Airtable, Notion, या Excel में भेजें।
- शेड्यूल्ड स्क्रैपिंग: प्रतिस्पर्धी कीमतों, स्टॉक, या नए प्रोडक्ट लॉन्च की निगरानी के लिए दोहराए जाने वाले काम सेट करें।
- एकीकृत दृश्य: Shopify और Amazon डेटा को एक ही तालिका में जोड़ें ताकि सेब-से-सेब तुलना हो सके।
Thunderbit खास तौर पर उन बिक्री और ऑपरेशंस टीमों के लिए उपयोगी है जो बिल्ट-इन डैशबोर्ड से आगे बढ़कर पूरा बाज़ार देखना चाहती हैं — सिर्फ़ अपना स्टोर नहीं।
प्रो टिप: अगर आप Thunderbit को काम करते देखना चाहते हैं, तो हमारे YouTube चैनल पर walkthroughs देखें।
बाज़ार हिस्सेदारी में बदलाव: वैश्विक ई-कॉमर्स परिदृश्य में Shopify और Amazon (2026)
2026 में ई-कॉमर्स प्लेटफ़ॉर्म रेस कौन जीत रहा है? इसका जवाब इस पर निर्भर करता है कि आप डेटा को कैसे काटते हैं।
Shopify का उभरता सितारा
Shopify की वैश्विक बाज़ार हिस्सेदारी 2026 में 10% तक पहुँच गई है, और अमेरिका में हिस्सेदारी 14% से ऊपर है (Shopify earnings)। यह कुछ साल पहले की तुलना में बड़ा उछाल है, और इसके पीछे ये कारण हैं:
- ब्रांड-निर्माण वाले स्टार्टअप्स: नए DTC ब्रांड्स और SMEs, जो नियंत्रण चाहते हैं, उनके लिए Shopify पहली पसंद है।
- अंतरराष्ट्रीय विस्तार: Shopify का मर्चेंट बेस अब अमेरिका के बाहर 56% है।
- इकोसिस्टम वृद्धि: पेमेंट्स, ऐप्स, और इंटीग्रेशन स्केल करना आसान बना रहे हैं।
Amazon: अभी भी दिग्गज, लेकिन धीमा
Amazon की वैश्विक बाज़ार हिस्सेदारी 15% है, लेकिन इसकी वृद्धि दर धीमी हो रही है — खासकर अमेरिका और पश्चिमी यूरोप जैसे परिपक्व बाज़ारों में। यह प्लेटफ़ॉर्म अभी भी कई खरीदारों की पहली पसंद है, लेकिन ज़्यादा ब्रांड अब खुद को "सिर्फ़ एक और Amazon सेलर" बनने से बचाने के लिए विविधीकरण कर रहे हैं।
मार्केट शेयर तालिका
| प्लेटफ़ॉर्म | वैश्विक बाज़ार हिस्सेदारी (2026) | अमेरिकी बाज़ार हिस्सेदारी | वृद्धि रुझान |
|---|---|---|---|
| Shopify | 10% | 14%+ | बढ़ रहा है |
| Amazon | 15% | 40%+ (रिटेल ई-कॉमर्स) | धीमा पड़ रहा है |
सीख क्या है? Shopify ज़मीन बना रहा है, खासकर उन स्टार्टअप्स और SMBs के साथ जो अपना ब्रांड बनाना चाहते हैं। Amazon अब भी वॉल्यूम लीडर है, लेकिन "बस लिस्ट करो और लोग खुद आ जाएँगे" वाले दिन अब धुंधले पड़ रहे हैं।
लाभप्रदता और सेलर मार्जिन: Shopify बनाम Amazon डेटा
अब पैसे की बात करते हैं। कौन सा प्लेटफ़ॉर्म आपकी जेब में ज़्यादा लाभ छोड़ता है?
Amazon सेलर लाभप्रदता
Jungle Scout के 2025 सेलर सर्वे के अनुसार:
- Amazon के 57% सेलर 10% से ऊपर लाभ मार्जिन की रिपोर्ट करते हैं।
- 28% 20% से ऊपर मार्जिन की रिपोर्ट करते हैं।
- 13% कहते हैं कि वे अभी लाभदायक नहीं हैं।
- 58% अपने पहले वर्ष में लाभदायक हो जाते हैं।
- प्रति सेलर औसत मासिक बिक्री: $11,671।
- औसत मासिक लाभ (21% मार्जिन पर): लगभग $2,451।
लेकिन एक दिक्कत है: Amazon की फीस संरचना और भारी हो रही है। 2026 में FBA शुल्क औसतन $0.08 प्रति यूनिट बढ़ रहे हैं, और विज्ञापन लागतें भी बढ़ रही हैं।
Shopify सेलर लाभप्रदता
Shopify लाभ मार्जिन का डेटा प्रकाशित नहीं करता (यह व्यवसाय मॉडल के अनुसार बहुत अलग होता है), लेकिन हम अनुमान लगा सकते हैं:
- प्रति स्टोर GMV $4.5K–$11.3K/माह के बीच है, यह इस पर निर्भर करता है कि आप स्टोर काउंट के लिए BuiltWith या StoreLeads का उपयोग करते हैं (Shopify earnings)।
- फ़ीस संरचना: Shopify मासिक सब्सक्रिप्शन लेता है ($39 Basic, $105 Grow, $399 Advanced, मासिक बिलिंग पर; Plus $2,300/माह से शुरू), साथ ही Basic पर 2.9% + 30¢ और Advanced पर 2.5% + 30¢ कार्ड रेट लेता है (Shopify pricing)।
- कोई मार्केटप्लेस फ़ीस नहीं: प्रत्येक बिक्री का ज़्यादा हिस्सा आपके पास रहता है, लेकिन आपको ट्रैफ़िक खुद लाना पड़ता है (यानी ज़्यादा मार्केटिंग खर्च)।
लागत संरचना तुलना तालिका
| लागत घटक | Shopify | Amazon |
|---|---|---|
| प्लेटफ़ॉर्म फ़ीस | $39–$399/माह (Basic / Grow / Advanced, मासिक बिलिंग); Plus $2,300/माह से शुरू | $39.99/माह (Pro) |
| लेनदेन शुल्क | 2.9% + $0.30 | 8–15% रेफ़रल फ़ीस (श्रेणी पर निर्भर) |
| फ़ुलफ़िलमेंट शुल्क | अलग-अलग (Shopify Fulfillment/3PL) | FBA: $3–$6+/यूनिट (साथ में 2026 की बढ़ोतरी) |
| विज्ञापन खर्च | वैकल्पिक (Meta, Google, TikTok, आदि) | Amazon Ads (बढ़ती CPCs) |
| अन्य शुल्क | ऐप सब्सक्रिप्शन, पेमेंट गेटवे | स्टोरेज, रिटर्न, प्रीमियम प्लेसमेंट |
मुख्य अंतर्दृष्टि: Shopify सेलर लागतों पर ज़्यादा नियंत्रण रखते हैं, लेकिन उन्हें मार्केटिंग में निवेश करना पड़ता है। Amazon सेलरों को प्लेटफ़ॉर्म फ़ीस ज़्यादा देनी पड़ती है, लेकिन ट्रैफ़िक पहले से मिलता है।
रणनीतिक प्रभाव: 2026 में SMBs के लिए डेटा-आधारित प्लेटफ़ॉर्म चयन
तो, छोटे और मध्यम व्यवसायों के लिए इसका क्या मतलब है? डेटा और मैदान में जो मैं देखता हूँ, उसके आधार पर मेरी राय यह है:
- Shopify उन ब्रांड्स के लिए सबसे अच्छा है जो लंबे समय के ग्राहक संबंध बनाना, अपना डेटा नियंत्रित करना, और दोहराई गई खरीद को बेहतर बनाना चाहते हैं। इसकी लचीलापन और एनालिटिक्स गहराई परीक्षण, सीखने और बढ़ने को आसान बनाती है।
- Amazon तुरंत पहुँच और बड़े पैमाने के लिए बेजोड़ है, लेकिन आप ग्राहकों को किराए पर लेते हैं, उन्हें अपने पास नहीं रखते। बदले में नियंत्रण कम, शुल्क ज़्यादा, और प्रतिस्पर्धा कड़ी होती है।
- सबसे समझदार टीमें मल्टी-चैनल हो रही हैं। वे ब्रांड-निर्माण और रिटेंशन के लिए Shopify, वॉल्यूम और खोज के लिए Amazon का उपयोग करती हैं, और दोनों के डेटा को एक साथ जोड़कर ऑप्टिमाइज़ करती हैं।
प्रो टिप: प्लेटफ़ॉर्म का चुनाव सिर्फ़ अंदाज़े के आधार पर न करें। रणनीति तय करने के लिए डेटा — दोहराई गई खरीद दर, मार्जिन विश्लेषण, और प्रतिस्पर्धी निगरानी — का उपयोग करें। यहीं पर Thunderbit जैसे AI टूल्स काम आते हैं।
Shopify और Amazon डेटा की तुलना के लिए AI का उपयोग करें Get Started Free
यहीं Thunderbit सबसे ज़्यादा चमकता है। एक AI वेब स्क्रैपर के रूप में, Thunderbit आपको Shopify और Amazon — और यहाँ तक कि आपके प्रतिस्पर्धियों — दोनों से डेटा इकट्ठा करने और उसे एकसमान बनाने देता है:
- बिक्री रुझान ट्रैकिंग: प्लेटफ़ॉर्म्स पर अपनी और प्रतिस्पर्धियों की बिक्री, कीमतें, और स्टॉक स्तर निगरानी करें।
- प्रतिस्पर्धी निगरानी: कीमतों, रिव्यूज़, और प्रमोशन गतिविधि के लिए Amazon SERPs, Shopify कलेक्शन्स, और प्रोडक्ट पेजेज़ स्क्रैप करें।
- ग्राहक व्यवहार विश्लेषण: रिव्यू डेटा, रेटिंग, और सेंटिमेंट निकालकर रुझान और अवसर पहचानें।
- एकीकृत रिपोर्टिंग: अपनी सारी जानकारी Google Sheets, Airtable, Notion, या Excel में एक्सपोर्ट करें ताकि साथ-साथ विश्लेषण हो सके।
Thunderbit वर्कफ़्लो उदाहरण
- Thunderbit Chrome Extension खोलें।
- Shopify और Amazon URLs की एक सूची पेस्ट करें (प्रोडक्ट, कलेक्शन, या सर्च पेज)।
- "AI Suggest Fields" पर क्लिक करें ताकि Thunderbit सबसे अच्छे कॉलम सुझा सके (कीमत, रिव्यूज़, स्टॉक, आदि)।
- सबपेज स्क्रैपिंग सक्षम करें ताकि प्रोडक्ट पेज या रिव्यू सेक्शन से विवरण लिया जा सके।
- अपना एकीकृत डेटा सेट अपनी पसंदीदा स्प्रेडशीट या डेटाबेस में एक्सपोर्ट करें।
- अंतर का विश्लेषण करें: प्लेटफ़ॉर्म्स के बीच कीमत, प्रमोशन फ़्रीक्वेंसी, शिपिंग स्पीड, और रिव्यू घनत्व की तुलना करें।
Thunderbit के साथ आप सिर्फ़ Shopify या Amazon के डैशबोर्ड तक सीमित नहीं रहते। आप पूरा बाज़ार देख सकते हैं, रुझान जल्दी पकड़ सकते हैं, और बेहतर निर्णय ले सकते हैं — बिना किसी कोडिंग के।
मुख्य निष्कर्ष: 2026 में Shopify बनाम Amazon सेलर डेटा
चलते-चलते बड़ी बातों को समेटते हैं:
- 2026 में Shopify, Amazon से तेज़ बढ़ रहा है, खासकर स्टार्टअप्स और SMBs के बीच। इसकी 29% YoY GMV वृद्धि, Amazon की 12% वृद्धि से आगे है।
- Shopify सेलरों को अधिक दोहराई गई खरीद दर (28–35%) और ग्राहक संबंधों पर ज़्यादा नियंत्रण मिलता है। Amazon सेलरों को विशाल पहुँच तो मिलती है, लेकिन ब्रांड लॉयल्टी कम होती है।
- दोनों प्लेटफ़ॉर्म पर लाभ मार्जिन दबाव में हैं, लेकिन Amazon की फ़ीस संरचना भारी और बढ़ती हुई है। Shopify सेलरों को मार्केटिंग में ज़्यादा निवेश करना पड़ता है, लेकिन प्रति बिक्री ज़्यादा हिस्सा रखते हैं।
- एनालिटिक्स की गहराई मायने रखती है। Shopify Analytics DTC के लिए अच्छा है, Amazon Seller Central ऑपरेशनल फोकस रखता है, और Thunderbit क्रॉस-प्लेटफ़ॉर्म, AI-संचालित डेटा एक्सट्रैक्शन से दोनों के बीच पुल बनाता है।
- सबसे अच्छी रणनीति डेटा-आधारित और मल्टी-चैनल होती है। ब्रांड निर्माण के लिए Shopify, स्केल के लिए Amazon, और वृद्धि व लाभप्रदता अधिकतम करने के लिए अपने डेटा को एकीकृत करें।
कार्रवाई योग्य सुझाव: अभी से अपना क्रॉस-प्लेटफ़ॉर्म डेटा इकट्ठा करना शुरू करें। यह जानने के लिए त्रैमासिक रिपोर्ट का इंतज़ार न करें कि क्या हो रहा है — Thunderbit जैसे टूल्स का उपयोग करके हमेशा एक कदम आगे रहें।
FAQs: Shopify बनाम Amazon सेलर डेटा विश्लेषण
1. मैं कैसे अनुमान लगाऊँ कि मेरे प्रोडक्ट के लिए Amazon फ़ीस ज़्यादा है या Shopify फ़ीस?
Amazon रेफ़रल फ़ीस (श्रेणी के अनुसार 8–15%) के साथ FBA और स्टोरेज फ़ीस लेता है — और 15 जनवरी 2026 से FBA शुल्क औसतन $0.08 प्रति यूनिट बढ़ गए। Shopify मासिक सब्सक्रिप्शन ($39 Basic से लेकर Plus $2,300/माह से शुरू) और 2.9% + 30¢ से शुरू होने वाली ट्रांज़ैक्शन फ़ीस लेता है (Shopify pricing)। कम कीमत, ज़्यादा वॉल्यूम वाले प्रोडक्ट्स के लिए Amazon की फ़ीस जल्दी बढ़ सकती है। सटीक तुलना के लिए हर प्लेटफ़ॉर्म का फ़ीस कैलकुलेटर उपयोग करें और अपनी यूनिट इकोनॉमिक्स मॉडल करें।
2. Shopify और Amazon पर वास्तव में कितने विक्रेता सक्रिय हैं?
Shopify 175+ देशों में "मिलियन्स" मर्चेंट्स की रिपोर्ट करता है, लेकिन सटीक संख्या नहीं बताता। थर्ड-पार्टी अनुमान 2.8M (StoreLeads) से 6.9M (BuiltWith) लाइव स्टोर्स तक जाते हैं। Amazon पर 2025 में केवल ~165,000 नए सेलर पंजीकृत हुए (दशक का निचला स्तर, YoY 44% नीचे), और Marketplace Pulse का अनुमान है कि सक्रिय सेलर 2021 के 2.4M से घटकर 2025 के अंत तक 1.65M रह गए — जबकि अब 100,000 से अधिक सेलर सालाना $1M+ कर रहे हैं (2021 के ~60,000 से ऊपर)।
3. खरीदार की वफ़ादारी Shopify या Amazon पर कहाँ ज़्यादा मज़बूत है?
Shopify स्टोर्स में औसतन 28–35% दोहराई गई खरीद दर होती है, क्योंकि वहाँ ब्रांड-स्वामित्व वाले संबंध और CRM टूल्स होते हैं। Amazon खरीदार प्लेटफ़ॉर्म के प्रति वफ़ादार होते हैं (खासकर Prime), लेकिन अलग-अलग सेलरों के लिए यह दर करीब 20% है (Shopify retention, CIRP Amazon Prime)।
4. कौन सा एनालिटिक्स डेटा first-party है और कौन सा अनुमानित?
Shopify Analytics और Amazon Seller Central/Brand Analytics आपके अपने स्टोर के लिए first-party डेटा देते हैं। मार्केट शेयर, सेलर संख्या, और प्रतिस्पर्धी डेटा आम तौर पर थर्ड-पार्टी स्रोतों या वेब स्क्रैपिंग से आने वाले अनुमान होते हैं (Shopify Analytics, Amazon Seller Analytics)।
5. मैं Shopify और Amazon डेटा की साथ-साथ तुलना कैसे कर सकता हूँ?
Thunderbit जैसे क्रॉस-प्लेटफ़ॉर्म टूल का उपयोग करें, जो Shopify और Amazon दोनों से डेटा स्क्रैप, एकीकृत, और एक्सपोर्ट कर सकता है। इससे आप कीमतों, रिव्यूज़, स्टॉक, और प्रमोशन्स की तुलना एक ही स्प्रेडशीट या डैशबोर्ड में कर सकते हैं, और आपको सच्चा apples-to-apples दृश्य मिलता है।
और पढ़ें एवं संसाधन
और गहराई में जाना चाहते हैं? Shopify बनाम Amazon सेलर एनालिटिक्स और ई-कॉमर्स प्लेटफ़ॉर्म डेटा विश्लेषण के लिए ये सबसे अच्छे स्रोत हैं:
- eMarketer: वैश्विक रिटेल ई-कॉमर्स पूर्वानुमान 2026
- U.S. Census Bureau: त्रैमासिक ई-कॉमर्स बिक्री
- Shopify FY 2025 आय प्रेस विज्ञप्ति
- Shopify Q1 2026 वित्तीय परिणाम
- Shopify SEC फाइलिंग 2025
- Amazon FY 2025 SEC फाइलिंग
- Amazon Q1 2026 आय रिलीज़
- Amazon 2024 स्मॉल बिज़नेस एंपावरमेंट रिपोर्ट
- Jungle Scout: Amazon सेलर लाभप्रदता और बिक्री बेंचमार्क्स
- Shopify Enterprise: ग्राहक प्रतिधारण बेंचमार्क्स
- Littledata: Shopify कन्वर्ज़न रेट और AOV बेंचमार्क्स
- Thunderbit: Amazon प्रोडक्ट स्क्रैपर टूल
- Thunderbit Blog: ई-कॉमर्स एनालिटिक्स और ऑटोमेशन