
If you’ve ever tried to keep tabs on what’s happening across a sprawling city, a busy logistics hub, or even a single construction site, you know how quickly things can get out of hand. Unauthorized buildings pop up overnight, zoning rules get bent (or broken), and environmental regulations are sometimes more like suggestions than hard rules. In today’s world, where a single compliance slip can mean millions in fines or lost reputation, businesses are turning to a new ally: map violation monitoring.
I’ve spent years in SaaS and automation, and I’ve seen firsthand how the old ways—manual inspections, paper records, and endless site visits—just can’t keep up. The rise of geographic information systems (GIS), satellite imagery, and AI-powered tools is changing the game for industries like real estate, transportation, and public safety. Map violation monitoring isn’t just a buzzword; it’s fast becoming a must-have for organizations that want to stay compliant, efficient, and ahead of the curve.
Let’s dive into what map violation monitoring really means, why it matters, and how AI-driven solutions (including , the tool my team and I built) are making it easier than ever to spot, analyze, and act on violations—before they become costly problems.
What is Map Violation Monitoring? A Simple Guide
At its core, map violation monitoring is the process of using digital maps, satellite images, and geographic data to detect, track, and manage activities that break the rules—think unauthorized construction, illegal land use, or environmental breaches. Instead of relying solely on inspectors walking the beat, organizations now leverage GIS platforms and AI to scan vast areas, flag anomalies, and keep detailed records.
Here’s how it works in plain English:
- Geographic data is collected from sources like satellite imagery, drones, public records, and IoT sensors.
- AI and GIS tools analyze this data to spot changes or patterns—like a new building where there shouldn’t be one, or a forest suddenly cleared for development.
- Violations are flagged in real time, often with precise coordinates, photos, and historical context.
- Teams can act quickly, sending inspectors to the right spot or triggering automated alerts.
Compared to traditional manual inspections, map violation monitoring offers broader coverage, faster detection, and a digital trail that’s easy to audit. In places like Kigali, Rwanda, satellite tech recently detected in a single sweep—something that would’ve taken months (or years) with boots on the ground.
Why Map Violation Monitoring Matters for Businesses
So, why should businesses care? The answer is simple: compliance isn’t optional anymore. Whether you’re a real estate developer, a logistics company, or a city agency, failing to spot violations can mean hefty fines, project delays, or even criminal charges. But there’s more to it than just avoiding trouble.
Key Reasons to Prioritize Map Violation Monitoring
- Regulatory Compliance: Stay on the right side of the law by catching violations early—before they escalate into lawsuits or shutdowns.
- Risk Reduction: Identify and address hazards (like unsafe construction or illegal dumping) before they cause accidents or environmental damage.
- Operational Efficiency: Replace slow, manual checks with automated, scalable monitoring—freeing up your team for higher-value work.
- Brand Reputation: Demonstrate transparency and responsibility to regulators, investors, and the public.
Let’s look at some industry-specific examples:
| Industry | Common Violations Detected | Business Impact if Missed | Benefit of Monitoring |
|---|---|---|---|
| Real Estate | Unauthorized construction, zoning breaches | Fines, demolition orders, lost permits | Faster compliance, project continuity |
| Transportation | Illegal parking, route deviations, encroachment | Delays, penalties, safety risks | Smoother operations, fewer fines |
| Public Safety | Illegal land clearing, hazardous waste dumping | Environmental harm, legal action | Early intervention, safer communities |
| Utilities | Unauthorized connections, easement violations | Service disruption, regulatory sanctions | Reliable service, lower legal risk |
The cost of non-compliance is only going up. In some sectors, fines have , and public scrutiny is intense. Map violation monitoring isn’t just about avoiding penalties—it’s about running a smarter, more resilient business.
Traditional Monitoring vs. Modern Map Violation Monitoring
Let’s be honest: the old way of doing things—manual inspections, paper logs, reactive enforcement—just doesn’t cut it anymore. Here’s how traditional monitoring stacks up against modern, digital approaches:
| Feature/Workflow | Traditional Monitoring | Modern Map Violation Monitoring |
|---|---|---|
| Coverage | Limited (spot checks, random) | Broad (entire regions, 24/7) |
| Speed | Slow (days/weeks) | Real-time or near real-time |
| Data Storage | Paper records, siloed files | Centralized, searchable digital records |
| Detection Accuracy | Prone to human error | AI/algorithm-driven, consistent |
| Response Time | Delayed (after-the-fact) | Immediate alerts, proactive action |
| Analytics & Reporting | Manual, time-consuming | Automated dashboards, trend analysis |
Traditional field inspections—think pen, paper, and lots of driving—are labor-intensive and often miss violations in remote or high-risk areas (). Modern solutions, on the other hand, use AI and GIS to scan thousands of sites in minutes, flagging issues that might otherwise go unnoticed.
The Role of AI and Mapping Technologies
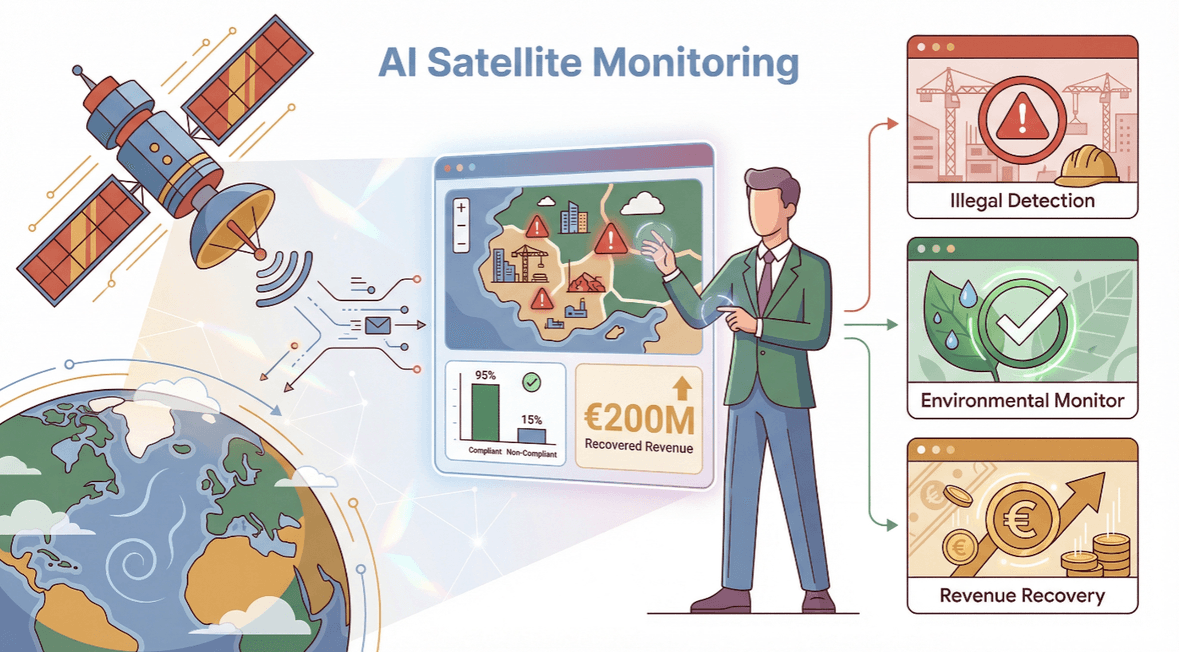
This is where things get exciting. AI isn’t just a buzzword here—it’s a real force multiplier. By analyzing satellite images, drone footage, and GIS layers, AI can:
- Automatically detect changes (like new buildings, illegal pools, or land clearing)
- Spot patterns that indicate recurring violations or emerging risks
- Integrate with remote sensing to monitor hard-to-reach areas
- Trigger real-time alerts for rapid response
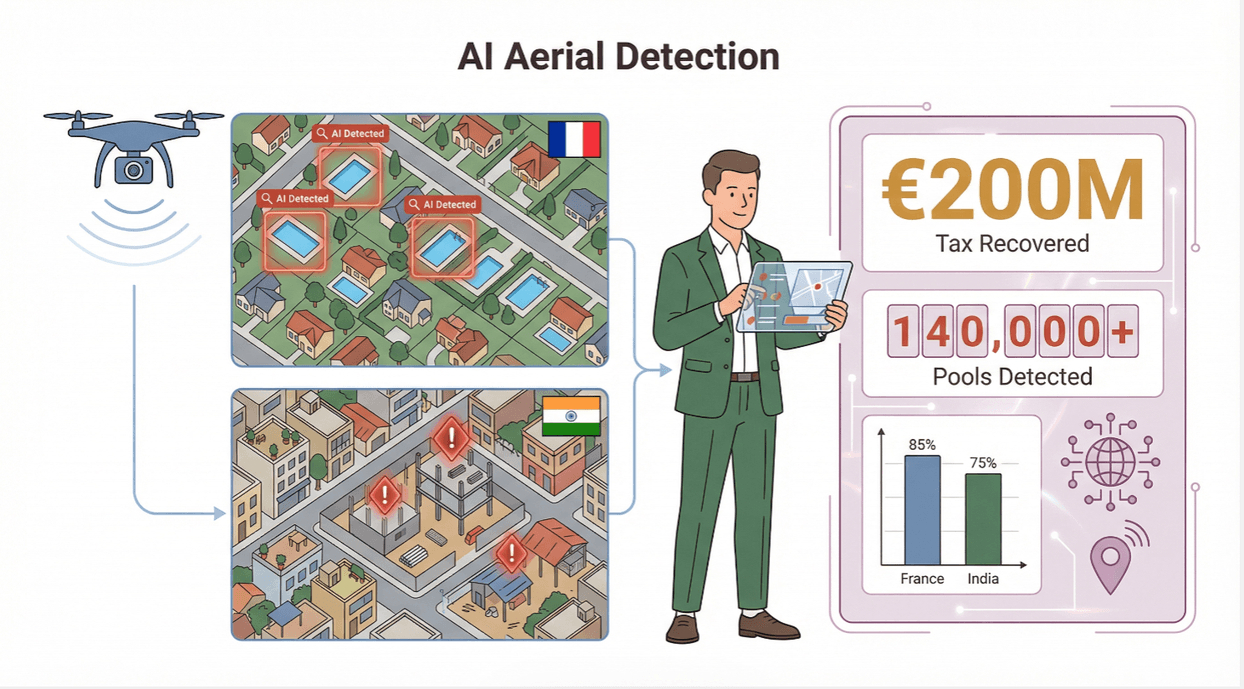
For example, in France, AI helped authorities by detecting via aerial imagery. In India, GIS and AI are being used to in rapidly growing cities.
Key Features of Effective Map Violation Monitoring Tools
Not all map violation monitoring solutions are created equal. Here’s what to look for if you want a tool that actually makes your life easier:
- Real-Time Alerts: Get notified as soon as a violation is detected, not days later.
- Data Integration: Pull in data from multiple sources—satellite, drone, public records, IoT devices—for a complete picture.
- Scalability: Monitor a single site or an entire city with the same platform.
- Automated Reporting: Generate compliance reports, trend analyses, and audit trails with a click.
- User-Friendly Dashboards: Visualize violations, trends, and risk areas on interactive maps.
- Customization: Tailor rules, alerts, and workflows to your specific needs.
- Workflow Integration: Connect with existing business systems (like CRM, ERP, or permitting software) for seamless operations.
Advanced GIS platforms now offer layered data views, batch processing, and automation features that .
How Thunderbit Enhances Map Violation Monitoring
Now, let’s talk about how fits into this picture. Thunderbit is an designed to make data extraction from websites, satellite imagery databases, and public records as easy as possible—even for non-technical users.
Here’s how Thunderbit can supercharge your map violation monitoring efforts:
- AI-Powered Data Extraction: Just describe what you want (“Find all new constructions in this area”), and Thunderbit’s AI suggests the best fields to extract—coordinates, images, permit numbers, and more.
- Subpage Scraping: Need more detail? Thunderbit can automatically visit subpages (like individual property records or permit applications) and enrich your main table with extra info.
- Bulk Scraping: Upload a list of URLs (for example, all properties in a district), and Thunderbit will extract relevant data from each—no manual clicking required.
- Instant Data Export: Export your findings directly to Excel, Google Sheets, Airtable, or Notion for further analysis or reporting.
- Advanced Analysis: Use Thunderbit’s AI to summarize, categorize, or even translate data on the fly—making it easier to spot trends or flag high-risk areas.
Thunderbit isn’t just for coders or GIS pros. If you can use a browser, you can use Thunderbit to automate the grunt work of data collection and focus on what really matters: analysis and action.
Real-World Applications: Thunderbit in Action
Let’s walk through a practical scenario. Imagine you’re part of a city’s code enforcement team, and you want to monitor for unauthorized construction in a fast-growing neighborhood.
- Gather Data Sources: Use Thunderbit to scrape recent satellite images, public permit databases, and local news reports.
- AI Field Suggestion: Click “AI Suggest Fields” to automatically detect and extract key info—property coordinates, construction dates, owner details.
- Subpage Scraping: For flagged properties, use subpage scraping to pull in permit history or inspection records.
- Export and Analyze: Export the structured data to Google Sheets, where you can filter for properties with no valid permits or recent changes.
- Automated Alerts: Set up scheduled scrapes to monitor for new violations weekly or monthly, keeping your team ahead of the curve.
This isn’t just theory—teams around the world are using tools like Thunderbit to , , and from undeclared property changes.
Data Analysis and Reporting in Map Violation Monitoring
Collecting data is just the first step. The real value comes from analyzing trends, identifying hotspots, and generating actionable reports. With structured data in hand, you can:
- Spot recurring violations (e.g., certain neighborhoods with frequent zoning breaches)
- Identify high-risk areas for targeted inspections
- Track compliance over time and measure the impact of interventions
- Generate audit-ready reports for regulators, executives, or the public
Automated dashboards and reporting tools make it easy to visualize violations on a map, drill down into details, and share insights across teams ().
The Future of Map Violation Monitoring: Trends and Innovations
The pace of innovation in this space is wild—in a good way. Here’s what’s on the horizon:
- IoT Integration: Sensors on the ground (think smart meters, cameras, or environmental monitors) feeding real-time data into GIS platforms for even more precise monitoring.
- Augmented Reality (AR): Field teams using AR glasses to overlay violation data on the real world, making inspections faster and more accurate ().
- Predictive Analytics: AI models that don’t just spot violations, but predict where they’re likely to occur next—helping teams allocate resources proactively.
- Seamless Workflow Integration: Map violation monitoring tools connecting directly with permitting, CRM, and compliance systems for end-to-end automation.
Thunderbit is well-positioned to support these trends, thanks to its flexible AI engine, robust data export options, and ability to handle everything from satellite images to IoT feeds. As the technology evolves, I see Thunderbit playing a key role in making advanced monitoring accessible to organizations of all sizes.
Getting Started with Map Violation Monitoring
Ready to take the plunge? Here’s a simple roadmap to get started:
- Assess Your Needs: What types of violations matter most to your business? Where are your current blind spots?
- Choose the Right Tools: Look for solutions that offer AI-driven analysis, real-time alerts, and easy integration with your existing systems. (Yes, I’m biased, but is a great place to start.)
- Train Your Team: Make sure everyone understands the new workflows and how to interpret digital alerts and reports.
- Integrate Data Sources: Connect your GIS, satellite imagery, public records, and IoT devices for a complete view.
- Pilot and Iterate: Start with a small project, measure results, and refine your approach before scaling up.
Checklist for Success:
- [ ] Identify key compliance risks and goals
- [ ] Select a scalable, user-friendly monitoring tool
- [ ] Integrate with existing data and workflows
- [ ] Train staff and set up alerts
- [ ] Review and act on findings regularly
For more on getting started, check out and our .
Conclusion: Key Takeaways for Modern Businesses
Map violation monitoring isn’t just a tech trend—it’s a strategic necessity for any organization that wants to stay compliant, efficient, and competitive. The move from manual inspections to AI-powered, GIS-driven solutions means broader coverage, faster detection, and smarter decision-making.
Here’s what matters most:
- Compliance is getting tougher, not easier. Digital monitoring helps you stay ahead of the curve.
- AI and GIS are a powerful combo. They turn raw data into actionable insights—at scale.
- Tools like Thunderbit make advanced monitoring accessible to everyone. No coding required, just results.
- The future is automated, integrated, and predictive. Start building your digital foundation now.
If you’re still relying on paper logs and spot checks, it’s time to rethink your approach. Map violation monitoring is here to stay—and with the right tools, you can turn compliance from a headache into a competitive advantage.
Curious about how Thunderbit can help? and see for yourself how easy it is to start monitoring what matters. And if you want to dig deeper, our is packed with tips, tutorials, and real-world stories from teams leading the way in digital compliance.
FAQs
1. What is map violation monitoring, and how does it work?
Map violation monitoring uses digital maps, satellite imagery, and AI to detect, track, and manage activities that break zoning, construction, or environmental rules. It automates the process of spotting violations and provides real-time alerts and detailed records.
2. Which industries benefit most from map violation monitoring?
Industries like real estate, transportation, public safety, and utilities all benefit. Any organization that needs to ensure compliance across large or complex areas can use map violation monitoring to reduce risk and improve efficiency.
3. How does Thunderbit support map violation monitoring?
Thunderbit’s AI Web Scraper extracts geographic and compliance data from websites, satellite image databases, and public records. It automates data collection, supports subpage scraping, and exports structured data for analysis and reporting.
4. What are the main advantages of using AI and GIS for compliance monitoring?
AI and GIS provide broader coverage, faster detection, real-time alerts, and automated reporting. They reduce manual effort, improve accuracy, and help organizations spot trends and risks before they become major problems.
5. How can my business get started with map violation monitoring?
Start by identifying your key compliance risks, choosing a scalable monitoring tool (like Thunderbit), integrating your data sources, and training your team. Begin with a pilot project, measure results, and scale up as you refine your process.
Ready to see the future of compliance? and start building a smarter, safer operation today.
Learn More