There’s something almost poetic about the modern online shopping cart. Shoppers fill them with dreams—new sneakers, the latest gadgets, maybe even a fancy espresso machine—only to leave those dreams stranded at the checkout.
If you’ve ever peeked at your store’s analytics and wondered why so many carts are left behind, you’re not alone. In fact, the global shopping cart abandonment rate is now so high, it’s practically a rite of passage for ecommerce teams.
As someone who’s spent years in SaaS and automation (and yes, built a few abandoned carts of my own), I’ve seen firsthand how understanding this one metric can transform your bottom line.
In this post, I’ll break down the latest data, trends, and strategies around shopping cart abandonment rates for 2026—armed with 25 stats that every ecommerce leader, marketer, and ops pro should know.
We’ll dig into why the rate keeps rising, which industries are hit hardest, how mobile is changing the game, and how tools like Thunderbit are helping teams turn abandoned carts into recovered revenue.
Let’s dive in—because every cart left behind is an opportunity waiting to be claimed.
Shopping Cart Abandonment Rate at a Glance: Top 10 Stats for 2026
Let’s kick things off with a rapid-fire look at the most eye-opening shopping cart abandonment rate statistics for 2026. These are the numbers that should be on every ecommerce team’s radar:
- The global average shopping cart abandonment rate is 70.22%, per Baymard's aggregation of 50 studies (last updated September 2025)—more than 7 out of 10 carts left behind.
- In a study of 1,500+ online shops, the abandonment rate hit 71.72% in early 2025.
- Dynamic Yield reports a global average abandonment rate of 77.68% over the trailing twelve months.
Rewrite — "Mobile vs. Desktop" section bullets: 4. On mobile, the average abandonment rate is a whopping 83.22%, compared to 71.81% on desktop. 5. The fashion and travel sectors see the highest rates, both above 84%. 6. Luxury and jewelry have an abandonment rate of 81.4%, while pet care is lowest at 52.8%. 7. 81% of global consumers will abandon a cart if their preferred delivery option isn’t available (DHL). 8. The estimated global ecommerce revenue lost to cart abandonment in 2026 is over $2.35 trillion—for every $100 in completed sales, $235 is left behind in abandoned carts. 9. Abandoned-cart emails have an average open rate of 50.5% and a placed-order rate of 3.33%. 10. The average large ecommerce site could see a 35.26% conversion lift by optimizing checkout design—translating to $260B in recoverable orders across the US and EU.
These numbers aren’t just trivia—they’re a wake-up call. Let’s unpack what’s driving these trends and what you can do about it.
Try Thunderbit for Ecommerce Insights
The Global Rise of Shopping Cart Abandonment Rate
If you feel like shopping cart abandonment is getting worse, you’re not imagining things. The global average has hovered around 70% for years, but recent data shows a subtle upward creep, especially as ecommerce expands into new markets and devices.
- In 2020, the global average was about 69.8%.
- By 2024–2025, studies show rates consistently above 70%—and some datasets, like Dynamic Yield’s, push close to 77%.
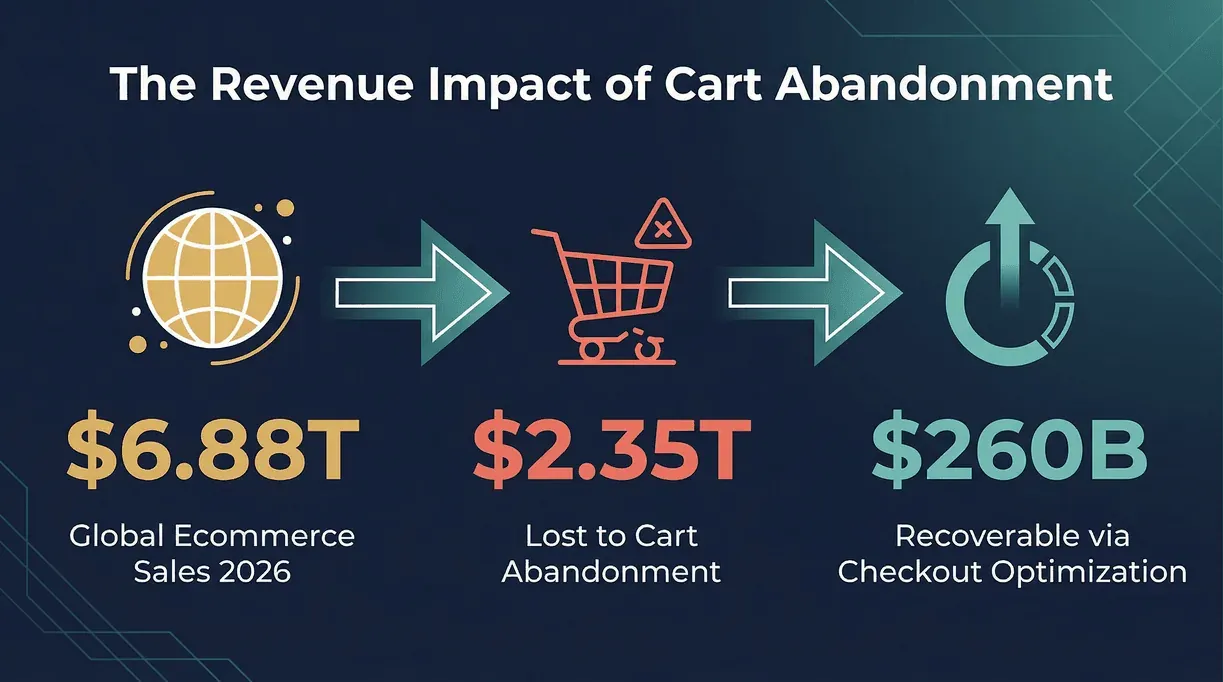
- With global ecommerce sales projected to hit $6.88 trillion in 2026, the scale of lost revenue is staggering.
What’s behind the rise? It’s a mix of factors: more “window shopping” on mobile, higher consumer expectations for delivery and returns, and checkout experiences that haven’t kept pace with shopper demands. As ecommerce matures, the bar for a frictionless checkout keeps getting higher.
And it’s not just a Western phenomenon. In regions like Asia-Pacific and Latin America, cart abandonment rates are even higher—80.05% in APAC, for example—driven by mobile-first shopping and unique payment or logistics challenges.
For ecommerce businesses, this isn’t just a UX problem—it’s a strategic imperative. Every percentage point you recover is real money back in your pocket.
Shopping Cart Abandonment Rate by Product Category
Not all carts are abandoned equally. The type of product you sell has a huge impact on your abandonment rate. Here’s how it breaks down:
| Category | Abandonment Rate |
|---|---|
| Fashion | 84.61% |
| Travel | 84.56% |
| Luxury & Jewelry | 81.4% |
| Beauty & Personal Care | 82.32% |
| Retail (General) | 72.23% |
| Pet Care & Veterinary | 52.8% |
| Grocery/Pharma | Lower end (exact varies, but often <60%) |
Why the big differences? High-consideration, high-ticket items (like travel or luxury) see more abandonment due to longer decision cycles and price sensitivity. Essentials and repeat-purchase categories (like groceries or pet care) have lower rates because shoppers are more decisive and less likely to “just browse.”
If you’re in a high-abandonment sector, don’t panic—but do focus on building trust, simplifying choices, and offering flexible payment or delivery options.
Mobile vs. Desktop: Where Do Shoppers Abandon Carts Most?
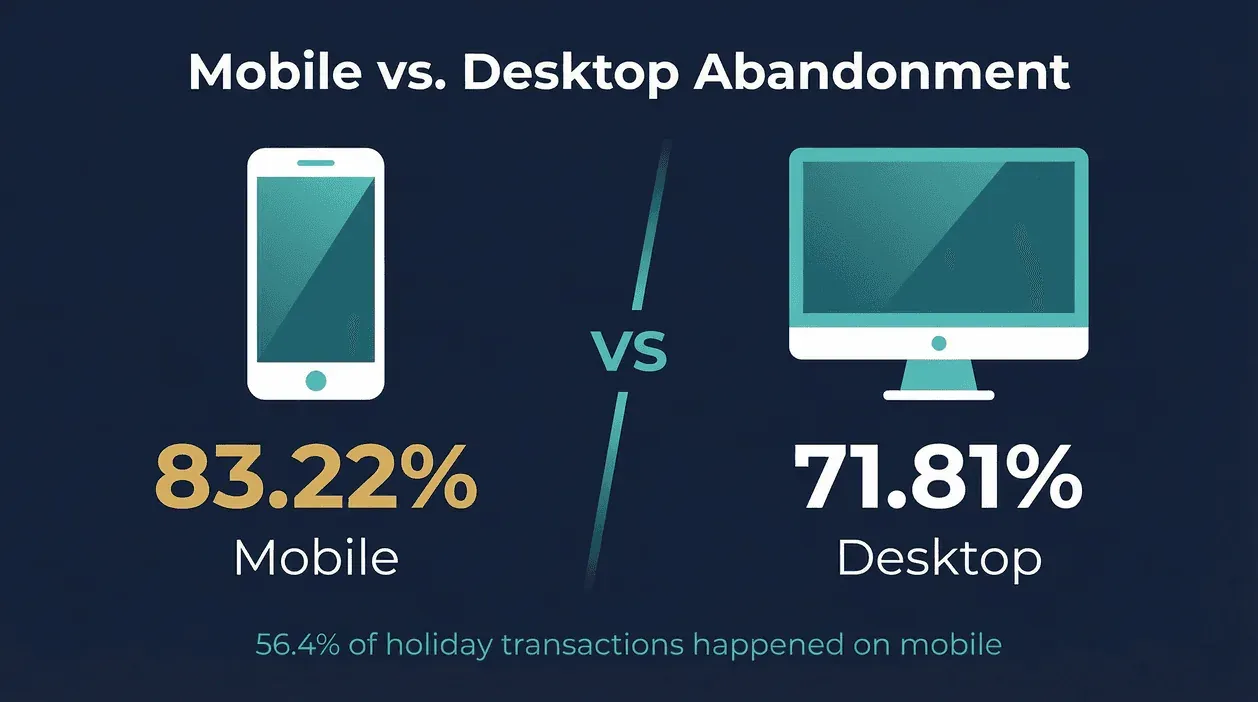
Here’s a stat that should make every ecommerce UX designer sit up straight: Mobile cart abandonment rates are consistently 10–15 percentage points higher than desktop.
- Mobile: 83.22% (SaleCycle), 79.97% (Dynamic Yield)
- Desktop: 71.81% (SaleCycle), 67.56% (Dynamic Yield)
- Tablet: 70.89%
Why is mobile so much worse? Blame small screens, fiddly forms, and checkout flows that weren’t built for thumbs. And yet, mobile now accounts for the majority of ecommerce traffic—and in the 2025 US holiday season, 56.4% of online transactions happened on smartphones.
The lesson: optimizing your mobile checkout isn’t optional anymore. Streamline forms, enable one-click payments, and make sure your site loads fast on every device. Your conversion rate (and your bottom line) will thank you.
Thunderbit: Using AI Web Scraper for Real-Time Shopping Cart Abandonment Insights
Scrape ecommerce insights with Thunderbit Get Started Free
Let’s talk about how to actually get your hands on the data that matters. As someone who’s obsessed with automation, I can tell you: waiting for quarterly reports or generic benchmarks isn’t enough. That’s where Thunderbit comes in.
Thunderbit’s AI Web Scraper lets you pull real-time data from ecommerce sites, user reviews, and even competitor platforms—no coding required. Here’s how sales and ops teams are using it to get ahead:
- Monitor competitors: Scrape cart abandonment rates, checkout flows, and user feedback from top ecommerce sites to benchmark your own performance.
- Track trends: Set up scheduled scrapes to watch how abandonment rates shift during shopping festivals, new product launches, or after UX changes.
- Extract actionable insights: Use Thunderbit’s AI to categorize reasons for abandonment from user reviews or social media—think “delivery too slow,” “checkout confusing,” or “payment method missing.”
A typical workflow looks like this:
- Open the Thunderbit Chrome Extension.
- Navigate to your target site or review page.
- Click “AI Suggest Fields” to let Thunderbit recommend what data to extract (like “abandonment reason,” “device type,” “timestamp”).
- Hit “Scrape”—and watch the data roll in, ready for export to Google Sheets, Excel, Notion, or Airtable.
I’ve seen teams set up daily scrapes to track abandonment trends across dozens of competitors, giving them a real-time edge in a fast-moving market. And because Thunderbit adapts to different site layouts, you’re not stuck rebuilding scrapers every time a site changes.
For more on how Thunderbit can supercharge your ecommerce analytics, check out our Thunderbit Blog or Thunderbit YouTube Channel.
Shopping Festivals & Promotions: How Do They Affect Shopping Cart Abandonment Rate?
If you think shopping cart abandonment goes down during big sales events, think again. Shopping festivals like Black Friday, Singles' Day, and Cyber Monday actually see spikes in abandonment rates—sometimes as high as 85–90% in certain sectors. The volume is the reason it matters: US shoppers spent $257.8B online from Nov. 1 to Dec. 31, 2025, up 6.8% YoY, and Cyber Week alone cleared $44.2B. A few percentage points of recovered carts on a base that size is the entire ROI conversation.
Why? Shoppers are comparison shopping, hunting for deals, and adding items to multiple carts before making a final decision. But here’s the good news: the right promotional strategies can turn those abandoned carts into conversions.
What works:
- Limited-time discounts: Flash sales and countdown timers create urgency, reducing “I’ll come back later” abandonments.
- Free shipping: 81% of shoppers will abandon if their preferred delivery option isn’t available—so offering free or flexible shipping can be a game-changer.
- Exit-intent popups: Shopify cites an average conversion rate of 17.12% for cart-abandonment popups during peak events.
- Cart recovery emails/SMS: Automated reminders sent at 1, 24, and 72 hours post-abandonment can boost recovery rates by up to 30%.
The takeaway: plan your festival strategy with both acquisition and recovery in mind. Track your abandonment rates in real time (with Thunderbit, of course) and be ready to deploy recovery campaigns at scale.
Shopping Cart Abandonment Rate Benchmarks by Region
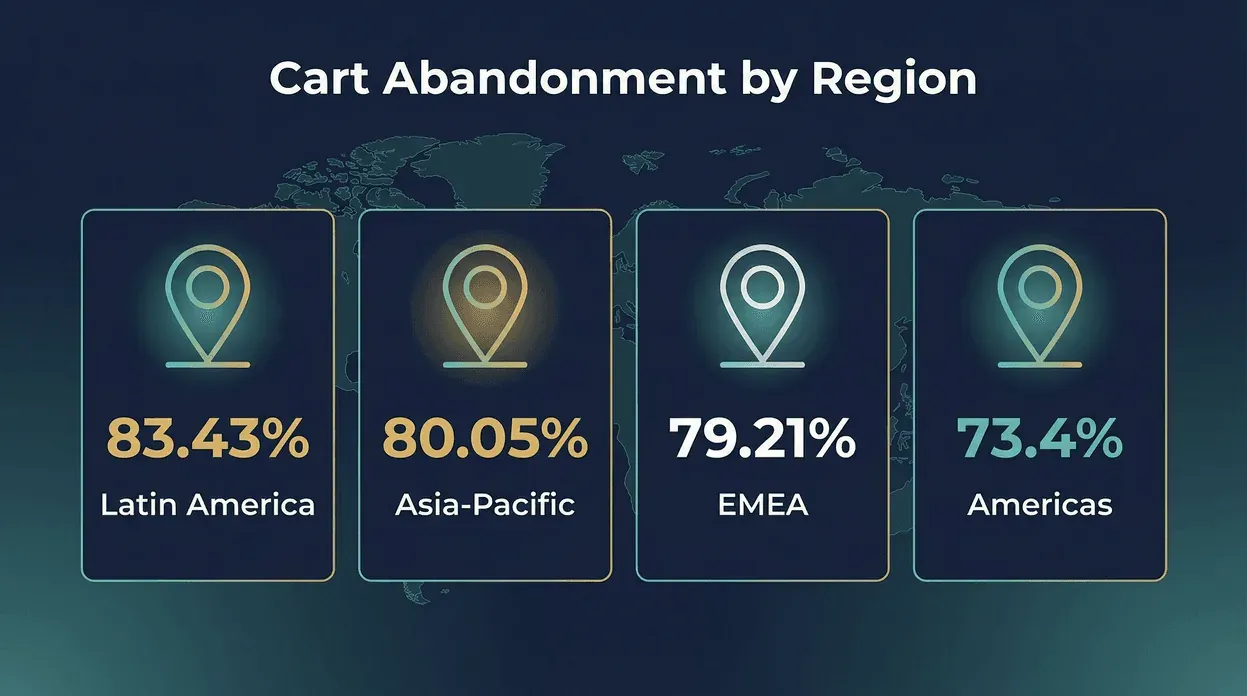
Cart abandonment isn’t just a global problem—it’s a local one, too. Here’s how rates stack up by region:
| Region | Abandonment Rate |
|---|---|
| Asia-Pacific | 80.05% |
| EMEA | 79.21% |
| Americas | 73.4% |
| Latin America | 83.43% (Statista, 2024) |
Why the differences?
- In APAC and Latin America, mobile-first shopping and unique payment or delivery challenges drive higher abandonment.
- In Europe, 90% of shoppers have abandoned a cart due to delivery inflexibility.
- In North America, better logistics and more payment options help keep rates lower—but there’s still plenty of room for improvement.
Pro tip: Always benchmark against your own region and industry first. Global averages are useful, but local realities matter more.
Key Factors Driving Shopping Cart Abandonment Rate
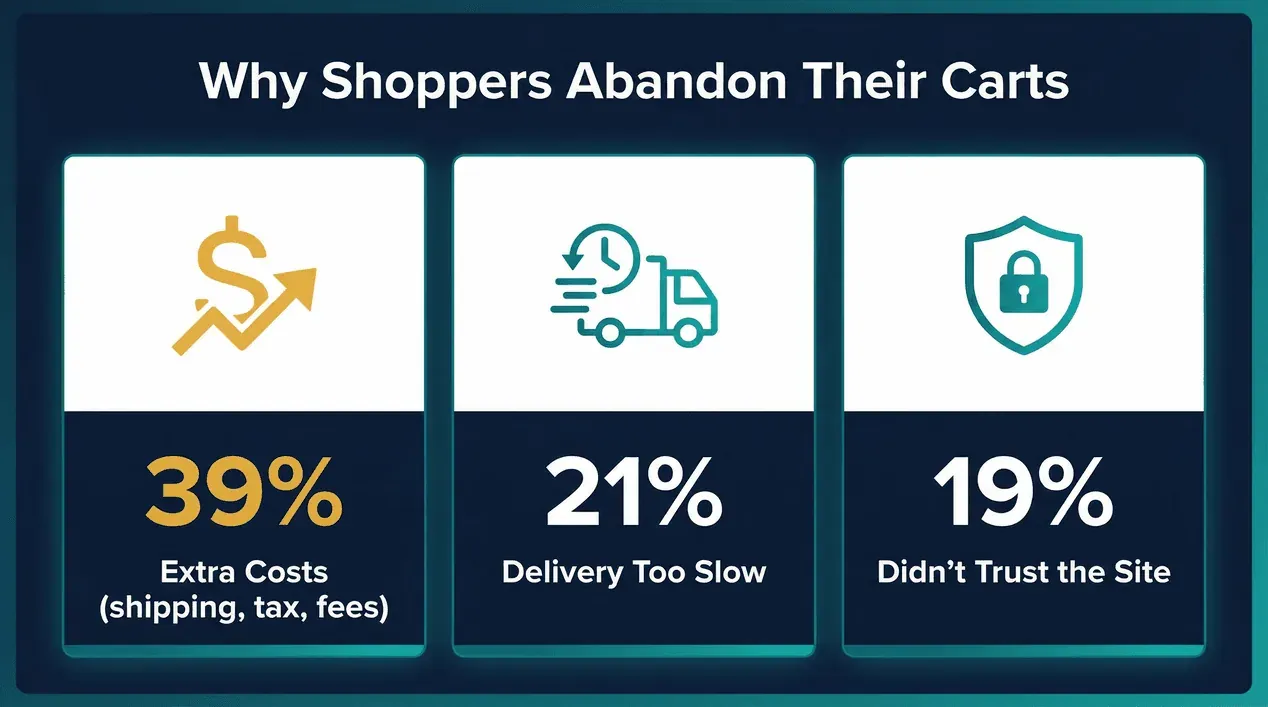
Let’s get to the heart of the matter: why do shoppers abandon their carts? Here’s what the data says (excluding “just browsing”):
| Reason for Abandonment | % of Shoppers |
|---|---|
| Extra costs (shipping, tax, fees) | 39% |
| Delivery was too slow | 21% |
| Didn’t trust the site with card info | 19% |
| Forced account creation | 19% |
| Checkout too long/complicated | 18% |
| Unsatisfactory returns policy | 15% |
| Couldn’t see/calculate total cost | 14% |
| Not enough payment methods | 10% |
Actionable fixes:
- Be transparent about all costs, up front.
- Offer fast, flexible delivery and clear returns.
- Let shoppers check out as guests—forced account creation is a deal-breaker.
- Streamline your checkout: Baymard finds the average US checkout has 23.48 form elements, but “ideal” flows can be as short as 12.
- Support local payment methods and build trust with clear privacy policies.
Shopping Cart Abandonment Rate Recovery: What Actually Works?
Recovering abandoned carts is both art and science. Here’s what the data shows about the most effective tactics:
- Abandoned-cart emails: Per Klaviyo's 2024 Benchmark Report (analysis of 143,000+ flows), average open rate is 50.5%, click rate 6.25%, and placed-order rate 3.33%. The top 10% of brands hit a 7.69% placed-order rate and $28.89 revenue-per-recipient.
- Sequenced reminders: Sending emails/SMS at 1, 24, and 72 hours post-abandonment can boost recovery by up to 30%.
- On-site popups: Cart-abandonment popups average a 17.12% conversion rate.
- One-click payments: Reducing friction at checkout (think Apple Pay, Google Pay) is increasingly effective, especially on mobile.
- Personalized retargeting ads: Dynamic product ads remind shoppers what they left behind, often at a lower cost than cold acquisition.
Best practices:
- Personalize your recovery messages (use the shopper’s name, show the exact items).
- Offer incentives, but don’t train shoppers to always wait for a coupon.
- Make it easy to return to the cart—one click, no login required.
The Revenue Impact: How Much Do Businesses Lose to Shopping Cart Abandonment?
See Thunderbit pricing Get Started Free
Let’s talk dollars and cents. With global ecommerce sales expected to reach $6.88 trillion in 2026, the cost of cart abandonment is mind-boggling.
- For every $100 in completed sales, about $235 is left behind in abandoned carts.
- That means over $2.35 trillion in potential revenue is lost to abandonment each year.
- Baymard estimates that optimizing checkout design alone could recover $260B in the US and EU.
- Real-world recovery campaigns (like abandoned-cart emails) can drive a >4% revenue uplift in sectors like travel.
The ROI on abandonment reduction is clear: even a small improvement in conversion can mean millions in new revenue for large stores—and a lifeline for smaller ones.
Key Takeaways: What the 2026 Shopping Cart Abandonment Rate Stats Mean for Your Business
So, what should you do with all this data? Here are my top recommendations for ecommerce teams in 2026:
- Benchmark against yourself: Track your own abandonment rate over time, and compare to peers in your industry and region.
- Prioritize checkout optimization: Streamline forms, support guest checkout, and be transparent about costs.
- Invest in mobile UX: Mobile is where most carts are abandoned—make it your top priority.
- Leverage automation: Use tools like Thunderbit to monitor trends, benchmark competitors, and automate recovery campaigns.
- Treat delivery and returns as conversion levers: Flexible, fast, and transparent options can make or break the sale.
- Don’t ignore sustainability and AI: One in three shoppers now abandons due to sustainability concerns, and AI-powered features are becoming table stakes.
Remember: every abandoned cart is a story—and with the right data and tools, you can turn more of those stories into successful checkouts.
Further Reading & Resources
If you want to dive deeper into shopping cart abandonment rates, here are some top resources:
- Baymard Institute: Cart Abandonment Rate Benchmarks
- DHL E-commerce Trends Report 2025
- Dynamic Yield: Cart Abandonment Rate Benchmarks
- SaleCycle: 2023 Ecommerce Stats Report
- Klaviyo: Abandoned Cart Benchmarks
- Shopify: Global Ecommerce Sales Forecast
- Thunderbit Blog: Ecommerce Data Insights
- How to Scrape Website Data into Excel using AI
- How to Scrape Any Website Using AI
- What Is Data Scraping and How to Do It in 2025
- The Best Web Scraping Tools & Software in 2025
FAQs
1. What is the average shopping cart abandonment rate in 2026?
The global average is 70.22%, with some datasets reporting rates as high as 77%. Rates are even higher on mobile and in certain product categories.
2. Why do shoppers abandon their carts most often?
The top reasons are extra costs (shipping, tax, fees), slow delivery, forced account creation, complicated checkout, and lack of trust in the site or payment methods (Baymard).
3. How can I reduce my store’s cart abandonment rate?
Focus on transparent pricing, fast and flexible delivery, streamlined checkout, mobile optimization, and automated recovery campaigns (like abandoned-cart emails and popups).
4. How does Thunderbit help with shopping cart abandonment analysis?
Thunderbit lets you scrape real-time data from ecommerce sites and user reviews, track abandonment trends, and benchmark against competitors—all without coding.
5. What’s the financial impact of shopping cart abandonment?
Globally, over $2.35 trillion in potential revenue is lost to abandoned carts each year. Even small improvements in conversion can yield huge returns.
If you’re ready to put these insights into action, give Thunderbit’s AI Web Scraper a try and start turning abandoned carts into completed sales. And for more ecommerce data tips, check out the Thunderbit Blog.
Turn Abandoned Carts into Insights with Thunderbit
Try Thunderbit AI Web Scraper Get Started Free