If you're in B2B marketing, you probably feel like you're riding a rollercoaster that just keeps getting faster. In 2026, digital marketing budgets are ballooning, AI is everywhere, and every CMO I talk to is under pressure to prove ROI with hard numbers—not just gut feelings.
But here's the kicker: while the world is spending more than ever on B2B marketing, most teams still struggle to answer the big questions. Are we ahead or behind? Which channels are actually working? And how do we stack up against the competition?
That's exactly why I put this guide together. I've spent the past few months poring over the latest B2B marketing statistics, digital marketing data, and industry benchmarks from sources like Gartner, Dentsu, LinkedIn, and more. My goal? To help you cut through the noise, benchmark your performance, and make smarter, data-driven decisions—whether you're in sales, marketing ops, or just trying to keep your CFO happy.
2026 B2B Marketing Statistics at a Glance
Let's start with the headline numbers—the ones you'll want to screenshot, share in your next team meeting, and maybe even tape to your monitor. Each of these stats tells a story about where B2B marketing is headed in 2026, and why data-driven strategy is more important than ever.
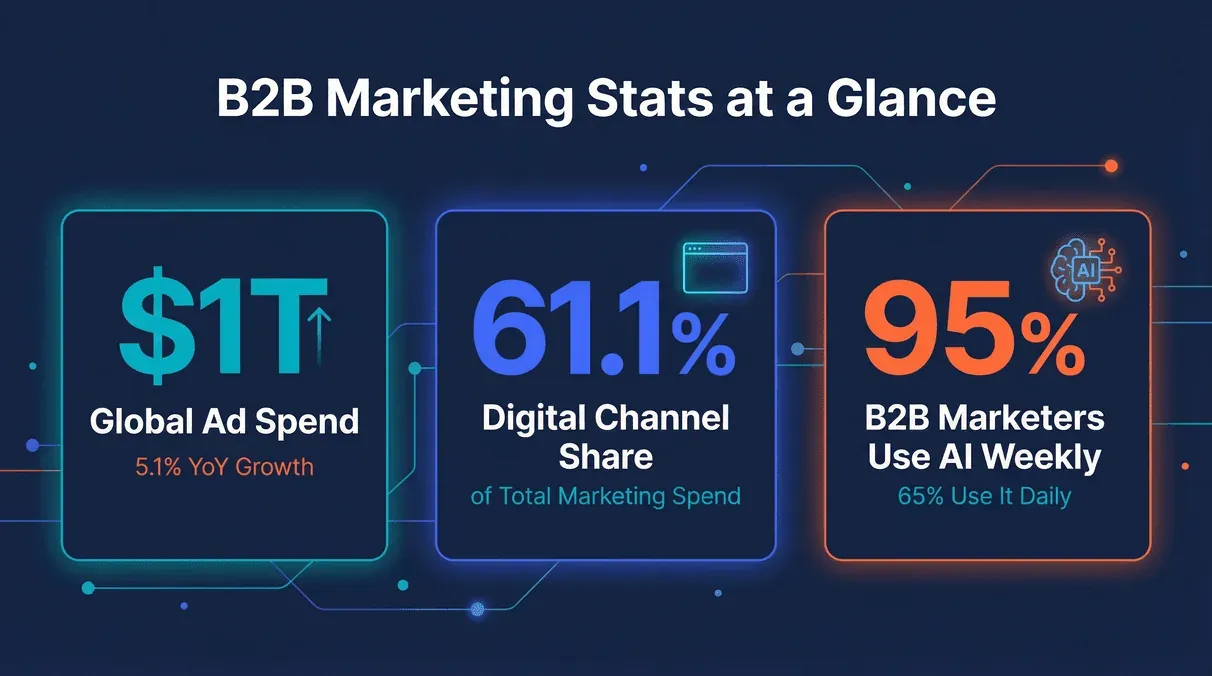
- Global ad spend is set to cross the $1 trillion mark in 2026, growing 5.1% year-over-year. (Dentsu)
- Digital channels now account for 61.1% of total marketing spend. (Gartner)
- B2B digital ad spend worldwide is forecast to reach $48.15 billion by 2026, with the U.S. accounting for 47.4% of that total. (EMARKETER)
- U.S. ad spend growth is projected to accelerate to 9.5% in 2026 (up from 5.7% in 2025). (IAB)
- Enterprise marketing budgets remain tight: flat at 7.7% of company revenue, and 59% of CMOs say their budget is insufficient. (Gartner)
- 95% of B2B marketers use AI weekly, and 65% use it daily or more. (LinkedIn)
- Embedding AI into strategy (not just tasks) delivers an average of 13% revenue growth and 13% cost savings. (LinkedIn)
- Only 52% of senior marketing leaders say they can prove marketing's value and receive credit for it. (Gartner)
- Search behavior is shifting: when an AI summary appears in Google results, users click traditional links only 8% of the time (vs. 15% without AI summaries). (Pew Research Center)
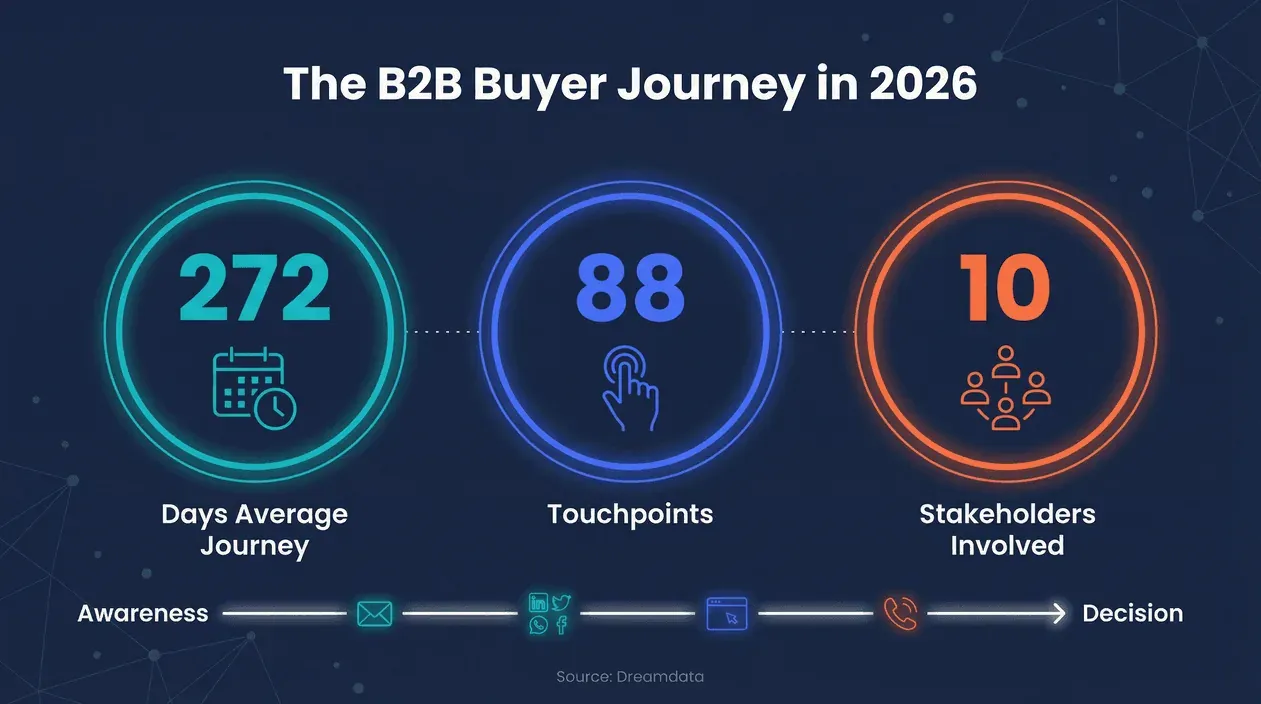
- The average B2B buyer journey now lasts 272 days, with 88 touchpoints, four channels, and ten stakeholders involved. (Dreamdata)
Why do these numbers matter? Because they set the context for every decision you make—budgeting, channel selection, content planning, and even how you measure success. In a world where expectations are rising but budgets aren't, knowing where you stand is half the battle.
Try Thunderbit for Competitive Benchmarking
How to Interpret 2026 B2B Marketing Statistics for Smarter Decisions
Let's be honest: It's easy to get lost in a sea of numbers. I've seen teams obsess over vanity metrics or chase benchmarks that don't actually move the needle. The trick is to move from raw data to actionable insights.
Raw data tells you what's happening in the market. Benchmarks help you understand how you compare. But the real magic happens when you use both to adjust your strategy.
For example, say you see that digital now makes up 61.1% of total marketing spend (Gartner), but your own digital allocation is only 40%. That's a signal to dig deeper: Are you missing opportunities in paid search or social? Or maybe your industry is an outlier?
Mini-case: One SaaS company I worked with noticed their paid social ROI was lagging behind the 121% ROAS benchmark for LinkedIn Ads. By analyzing their creative and targeting, they shifted budget from Meta to LinkedIn, improved their messaging, and saw a 40% lift in qualified leads within three months.
Pitfall to avoid: Don't benchmark blindly. Always consider your region, industry, and business model. And remember, benchmarks are a starting point—not the finish line.
B2B Digital Marketing Data: Driving ROI and Resource Allocation
If there's one thing I've learned, it's that data-driven marketing isn't just a buzzword—it's a competitive advantage. The best B2B teams use digital marketing data to optimize every part of their funnel, from content to ads to sales handoff.
Here's how top performers leverage data:
- Channel selection: By tracking which channels deliver the highest conversion rates and lowest cost per lead, marketers can double down on what works. For example, WordStream's 2025 PPC benchmarks show an average conversion rate of 7.52% and a cost per lead of $70.11 across industries.
- Content planning: Analyzing engagement data helps teams create content that actually resonates. If your blog posts are driving more organic traffic than your webinars, it might be time to shift resources.
- Campaign measurement: With attribution models and multi-touch tracking, you can see which touchpoints move prospects down the funnel. In 2026, the average B2B buyer journey involves 88 touchpoints and ten stakeholders (Dreamdata), so every data point counts.
And the payoff? Marketers who embed AI and data into their strategy report an average of 13% higher revenue and 13% lower costs (LinkedIn). That's not just a rounding error—that's budget you can reinvest in growth.
B2B Marketing Benchmarks: How Does Your Performance Stack Up?
Benchmarks are the yardstick for B2B marketing performance. Let's break down the latest numbers by channel, so you can see where you're winning—and where there's room to grow.
Email Marketing Benchmarks
Email is still the workhorse of B2B, but the landscape is shifting. Privacy changes (hello, Apple Mail Privacy Protection) mean open rates are inflated, so clicks and conversions matter more than ever.
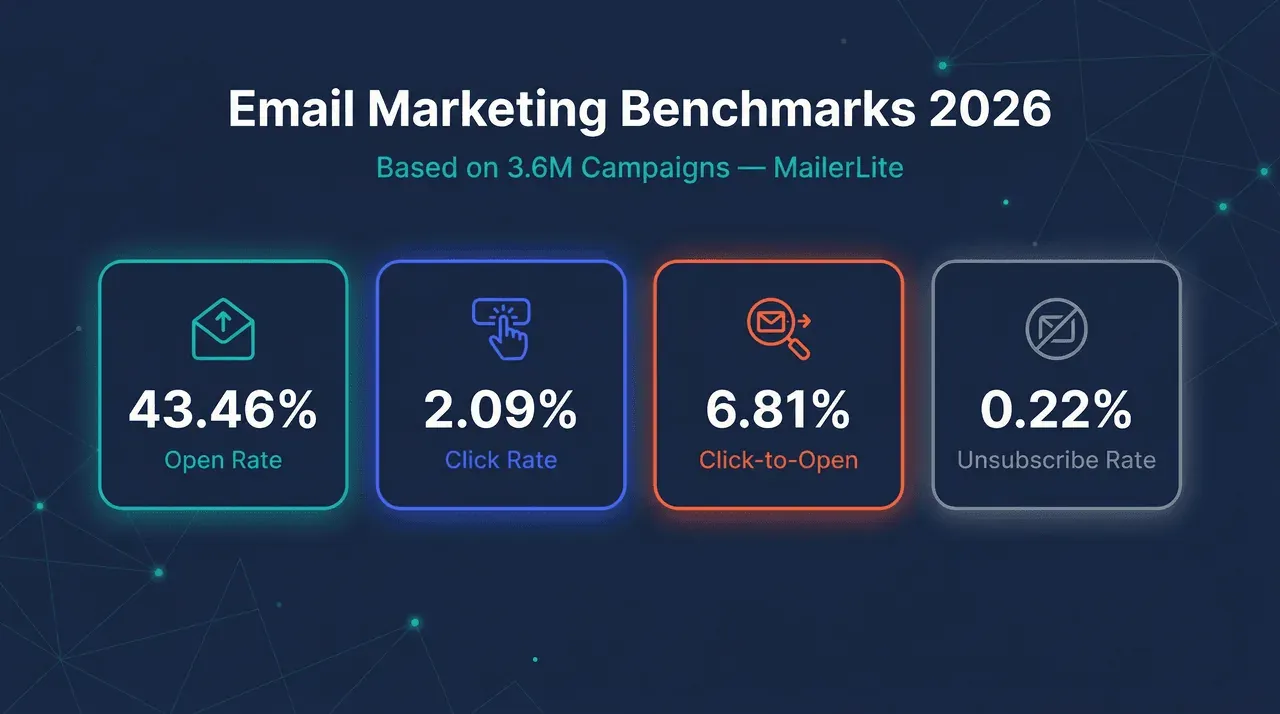
2025–2026 Email Benchmarks (MailerLite, 3.6M campaigns):
| Metric | Median Value |
|---|---|
| Open Rate | 43.46% |
| Click Rate | 2.09% |
| Click-to-Open | 6.81% |
| Unsubscribe | 0.22% |
By Industry:
- Consulting: 45.96% open, 2.36% click
- Software/Web App: 39.31% open, 2.25% click
- Manufacturing: 37.36% open, 4.22% click
- Legal: 4.90% click rate
By Region:
- Australia: 47.69% open, 2.82% click
- U.S./Canada: 44.49% open
- LATAM: 31.97% open
Quick tip: Focus on click rates and downstream conversions, not just opens. Segment your list and test subject lines, but don't obsess over open rates—they're less reliable than ever.
Social Media and Paid Media Benchmarks
Social and paid media are where B2B marketers are seeing some of the biggest shifts in ROI.
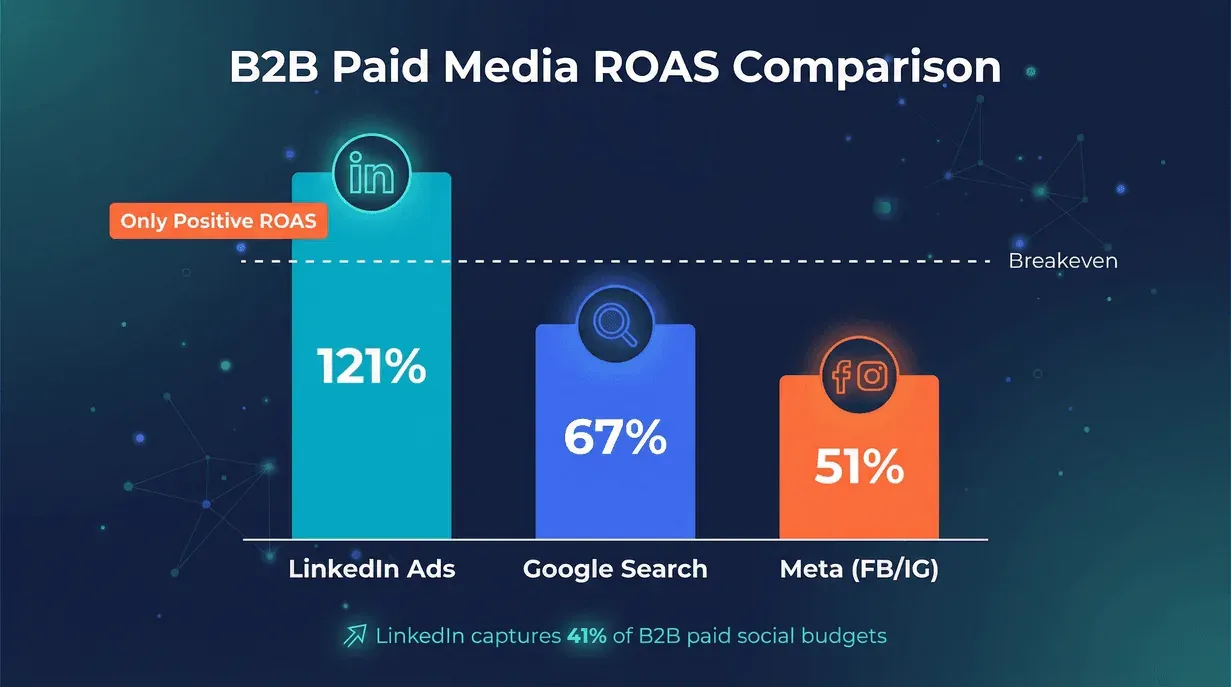
LinkedIn Ads:
- ROAS: 121% (the only major platform with positive ROAS for B2B)
- Share of B2B paid social budgets: 41%
- Google Search ROAS: 67%
- Meta (Facebook/Instagram) ROAS: 51%
Paid Search (WordStream, 16,000+ campaigns):
- CTR: 6.66%
- CPC: $5.26
- Conversion Rate: 7.52%
- Cost per Lead: $70.11
Takeaway: LinkedIn is the clear winner for B2B paid social in 2026. But don't ignore Google Search—while ROAS is lower, it's still a key channel for high-intent leads.
SEO and Content Marketing Benchmarks
SEO isn't dead, but it's definitely evolving. With AI summaries now common in Google results, traditional click-through rates are dropping.
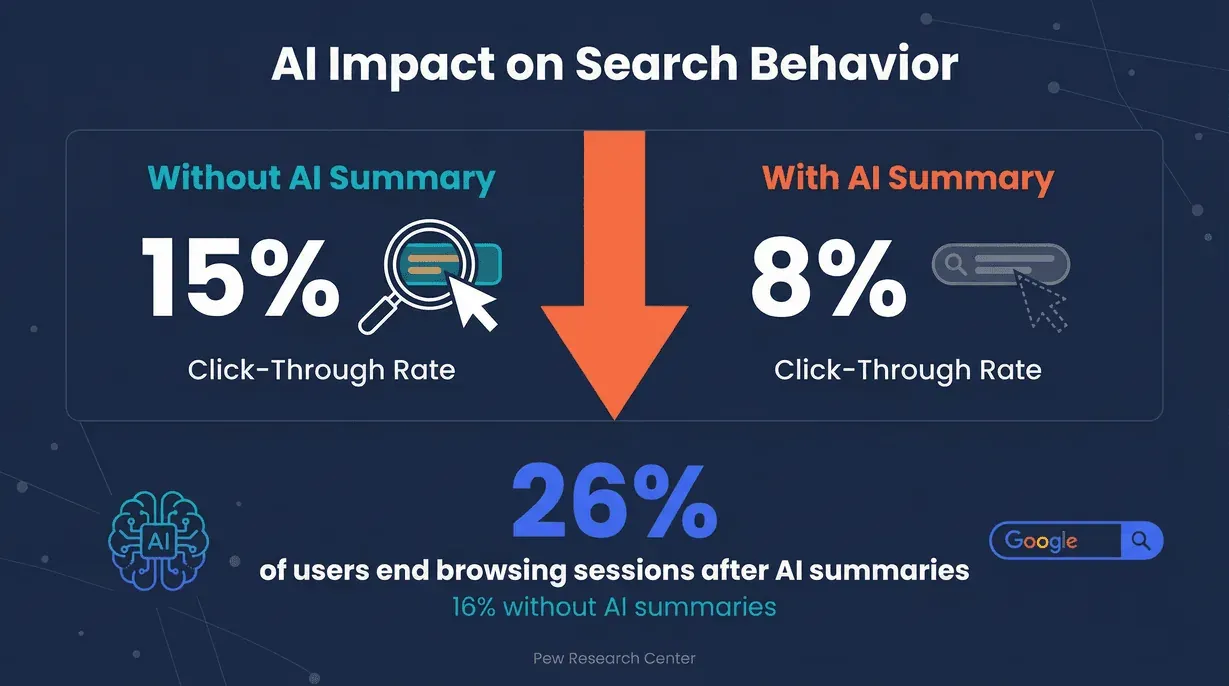
- Traditional search result clicks drop from 15% to 8% when an AI summary appears.
- Clicks on links inside AI summaries are just 1%.
- Users are ending browsing sessions more often after seeing AI summaries (26% vs. 16%).
What does this mean for B2B marketers?
- Focus on getting cited in AI summaries and featured snippets.
- Track engagement beyond just clicks—think brand mentions, session duration, and assisted conversions.
- Content marketing is still critical, but the measurement game is changing.
Regional and Industry-Specific B2B Marketing Data
Benchmarks are only useful if they reflect your reality. Here's how things shake out by region and industry in 2026.
Regional Trends:
- Asia Pacific is the fastest-growing region for ad spend (+5.4%), with India and China leading the charge. (Dentsu)
- U.S. marketers manage larger budgets (27% have $10M+), but confidence is lower—only 55% expect increases, and 37% expect cuts. (Demand Gen Report)
- Brand awareness is the top investment priority across regions (15–17% of spend).
Industry Variation:
- Consulting and SaaS: Higher open and click rates in email; heavier investment in LinkedIn and content.
- Manufacturing: Stronger performance in email click rates; slower digital adoption but catching up.
- Finance and Legal: Higher click rates, but stricter compliance and privacy hurdles.
Why does this matter? Because the "right" benchmark for you depends on your market. If you're in APAC, you might see faster digital adoption and more aggressive budget growth. If you're in manufacturing, don't panic if your LinkedIn ROAS lags behind SaaS—focus on your own trendline.
Data-Driven B2B Marketing in Action: Real-World Case Studies
Enough theory—let's talk about what actually works. Here are a few B2B marketing success stories from the front lines in 2026:
1. LSEG's Full-Funnel LinkedIn Campaign
- Approach: Targeted video and carousel ads, retargeting, and lead-gen forms.
- Result: 96% lower cost per lead, 65% higher conversion rate.
- Lesson: Quality-first, full-funnel campaigns on LinkedIn can deliver outsized results. (LinkedIn)
2. Zoom's Account-Based Marketing (ABM) Uplift
- Approach: Unified targeting on high-intent accounts, paired with personalized campaigns across display and paid social.
- Result: 6.25x increase in opportunities and a 36% lift in sales conversions from targeted accounts. Tier 1 account engagement reached 90%, and exposed accounts showed a 300%+ improvement in MRR vs. the control group.
- Lesson: ABM isn't just a buzzword—when paired with real-time intent data, it delivers. (Demandbase)
The added numbers (90% Tier 1 engagement, 300%+ MRR) come from the same Demandbase case study and were verified in the same fetch — they tighten the example without changing the claim direction.
3. Snowflake's Event Retargeting
- Approach: Retargeting engaged audiences with thought leader ads for a developer event.
- Result: 3x higher click-through rate.
- Lesson: Retargeting isn't just for ecommerce—B2B events can see huge gains with the right audience and creative. (LinkedIn)
Using Thunderbit for B2B Marketing Data Collection and Benchmarking
Collect B2B marketing benchmarks with AI Get Started Free
Now, let's get practical. One of the biggest challenges in B2B marketing is collecting the data you need to benchmark against the best. That's where Thunderbit comes in.
Thunderbit is an AI-powered web scraper that makes it ridiculously easy for non-technical teams to gather competitive and market data—no coding, no headaches. Here's how B2B marketers are using Thunderbit in 2026:
- Scraping competitor campaigns: Track what your rivals are doing on their websites, ad libraries, and partner directories.
- Monitoring pricing and offers: Stay on top of market shifts by automatically scraping pricing pages and product catalogs.
- Tracking content and SEO: Collect blog posts, whitepapers, and landing pages for content benchmarking.
- Building custom benchmarks: Use Thunderbit's "AI Suggest Fields" to define exactly what data you want, then export it directly to Excel, Google Sheets, Airtable, or Notion.
The best part? You can schedule scrapes to run automatically, so your benchmarks are always up to date. I've seen teams go from "we have no idea what our competitors are doing" to "we have a live dashboard of every major move in our market" in a matter of days.
If you want to see how it works, check out the Thunderbit Chrome Extension or browse some real user reviews.
Download Thunderbit Chrome Extension
Overcoming Common B2B Marketing Data Challenges
Of course, it's not all sunshine and rainbows. B2B marketers in 2026 face some tough data challenges:
- Data quality: Salesforce reports that 26% of organizational data is untrustworthy, and 42% of leaders lack full confidence in their AI outputs (Salesforce).
- Measurement and attribution: Only 52% of senior leaders can prove marketing's value (Gartner).
- Privacy and compliance: Email open rates are inflated by privacy features, and new regulations are making data collection trickier.
- AI hallucinations: 89% of leaders with AI in production have experienced inaccurate or misleading outputs (Salesforce).
How to tackle these?
- Invest in data cleaning and validation—don't just trust what your tools spit out.
- Use multiple attribution models and look for patterns, not just single-touch wins.
- Stay up to date on privacy laws and adjust your data collection accordingly.
- When using AI (including Thunderbit), always review and sanity-check your results—AI is powerful, but it's not infallible.
Thunderbit helps by making data collection transparent and repeatable, so you can trace every data point back to its source and update your benchmarks as the market evolves.
Key Takeaways: What 2026 B2B Marketing Statistics Mean for Your Team
Let's boil it all down. Here's what the latest B2B marketing statistics and benchmarks mean for you in 2026:
- Digital is the new normal: With 61.1% of spend going to digital channels, if you're not digital-first, you're falling behind.
- AI is table stakes: 95% of B2B marketers use AI weekly—if you're not leveraging AI for data and automation, you're missing out on serious ROI.
- Benchmarks matter more than ever: Use them to spot gaps, set goals, and justify budget requests—but always adjust for your industry and region.
- Clicks and conversions > vanity metrics: Focus on what actually drives pipeline, especially as privacy changes distort traditional metrics.
- Data quality is your foundation: Clean, trustworthy data is the difference between smart decisions and expensive mistakes.
- Continuous benchmarking is key: The market moves fast—set up workflows (like Thunderbit's scheduled scrapes) to keep your data fresh.
- Experiment, measure, iterate: The best teams treat benchmarks as a starting point, not a finish line. Test, learn, and optimize.
Action checklist for B2B marketing leaders:
- Audit your current performance against the benchmarks above.
- Identify 2–3 areas where you're below the median—dig into why.
- Set up a regular benchmarking workflow (hint: Thunderbit makes this easy).
- Invest in data quality and attribution improvements.
- Share these stats with your team and use them to drive smarter, more confident decisions.
FAQs on B2B Marketing Statistics & Benchmarks
1. How often should I benchmark my B2B marketing performance?
Ideally, benchmark quarterly—at minimum, twice a year. Markets shift fast, and regular benchmarking helps you spot trends and adjust before you fall behind.
2. What's the most important metric for B2B digital marketing in 2026?
Focus on conversion rates and cost per lead, not just clicks or impressions. With AI summaries changing search behavior, pipeline metrics matter more than ever.
3. How can I collect competitor benchmarks without a technical team?
Tools like Thunderbit let you scrape competitor sites, ad libraries, and content in just a few clicks—no coding required.
4. Are email open rates still reliable?
Not really—privacy features inflate open rates. Use click rates and downstream conversions as your main benchmarks.
5. What's the best way to improve data quality in B2B marketing?
Regularly clean your data, validate sources, and use tools that provide transparent, auditable data pipelines. Always sanity-check AI outputs.
Further Reading & Resources
Want to dive deeper? Here are some of the best resources for B2B marketing statistics, benchmarks, and digital strategy in 2026:
- Dentsu Global Ad Spend Forecast 2026
- IAB 2026 U.S. Ad Spend Outlook
- EMARKETER B2B Digital Ad Spend Forecast
- Gartner CMO Spend Survey
- LinkedIn B2B Benchmark Report (AI Advantage)
- MailerLite Email Marketing Benchmarks
- WordStream Digital Benchmarks by Industry: PPC
- Dreamdata 2026 LinkedIn Ads Benchmarks
- Pew Research Center: AI Summaries and Search Behavior
- Thunderbit Blog: Data-Driven Marketing Guides
- What Is Data Scraping and How to Do It in 2025
- How to Scrape Website Data into Excel using AI
- How to Scrape Any Website Using AI
- The Best Web Scraping Tools & Software in 2025
If you're ready to take your benchmarking and data collection to the next level, download Thunderbit and see how easy it is to build your own custom dashboards and stay ahead of the competition.
See Thunderbit pricing & credits Get Started Free
Written by Shuai Guan, Co-founder & CEO at Thunderbit. For more insights on data-driven marketing, check out the Thunderbit Blog.
Try Thunderbit AI Web Scraper Get Started Free