If you’ve ever spent a late night tweaking your Shopify store, wondering if that new product image or checkout tweak would move the needle, you’re not alone. With Shopify powering millions of stores and facilitating a staggering $378.4 billion in GMV in 2025, even the smallest uptick in conversion rate can mean a huge revenue boost. In 2026, the competition is fiercer, acquisition costs are up, and every decimal point in your conversion rate is worth fighting for.
I’ve spent years in SaaS and automation, and I can tell you: understanding your Shopify conversion rate—and how it stacks up against the latest benchmarks—isn’t just a vanity metric. It’s the difference between scaling profitably and spinning your wheels. In this deep dive, I’ll break down the latest Shopify conversion rate statistics for 2026, unpack what’s driving the numbers, and show how tools like Thunderbit can help you analyze, benchmark, and improve your store’s performance.
Try Thunderbit for Shopify Conversion Tracking
Top Shopify Conversion Rate Statistics for 2026
Let’s start with the headline numbers that every Shopify merchant should have on their radar. These are the stats you’ll want to bookmark, cite, and use as your north star for optimization:
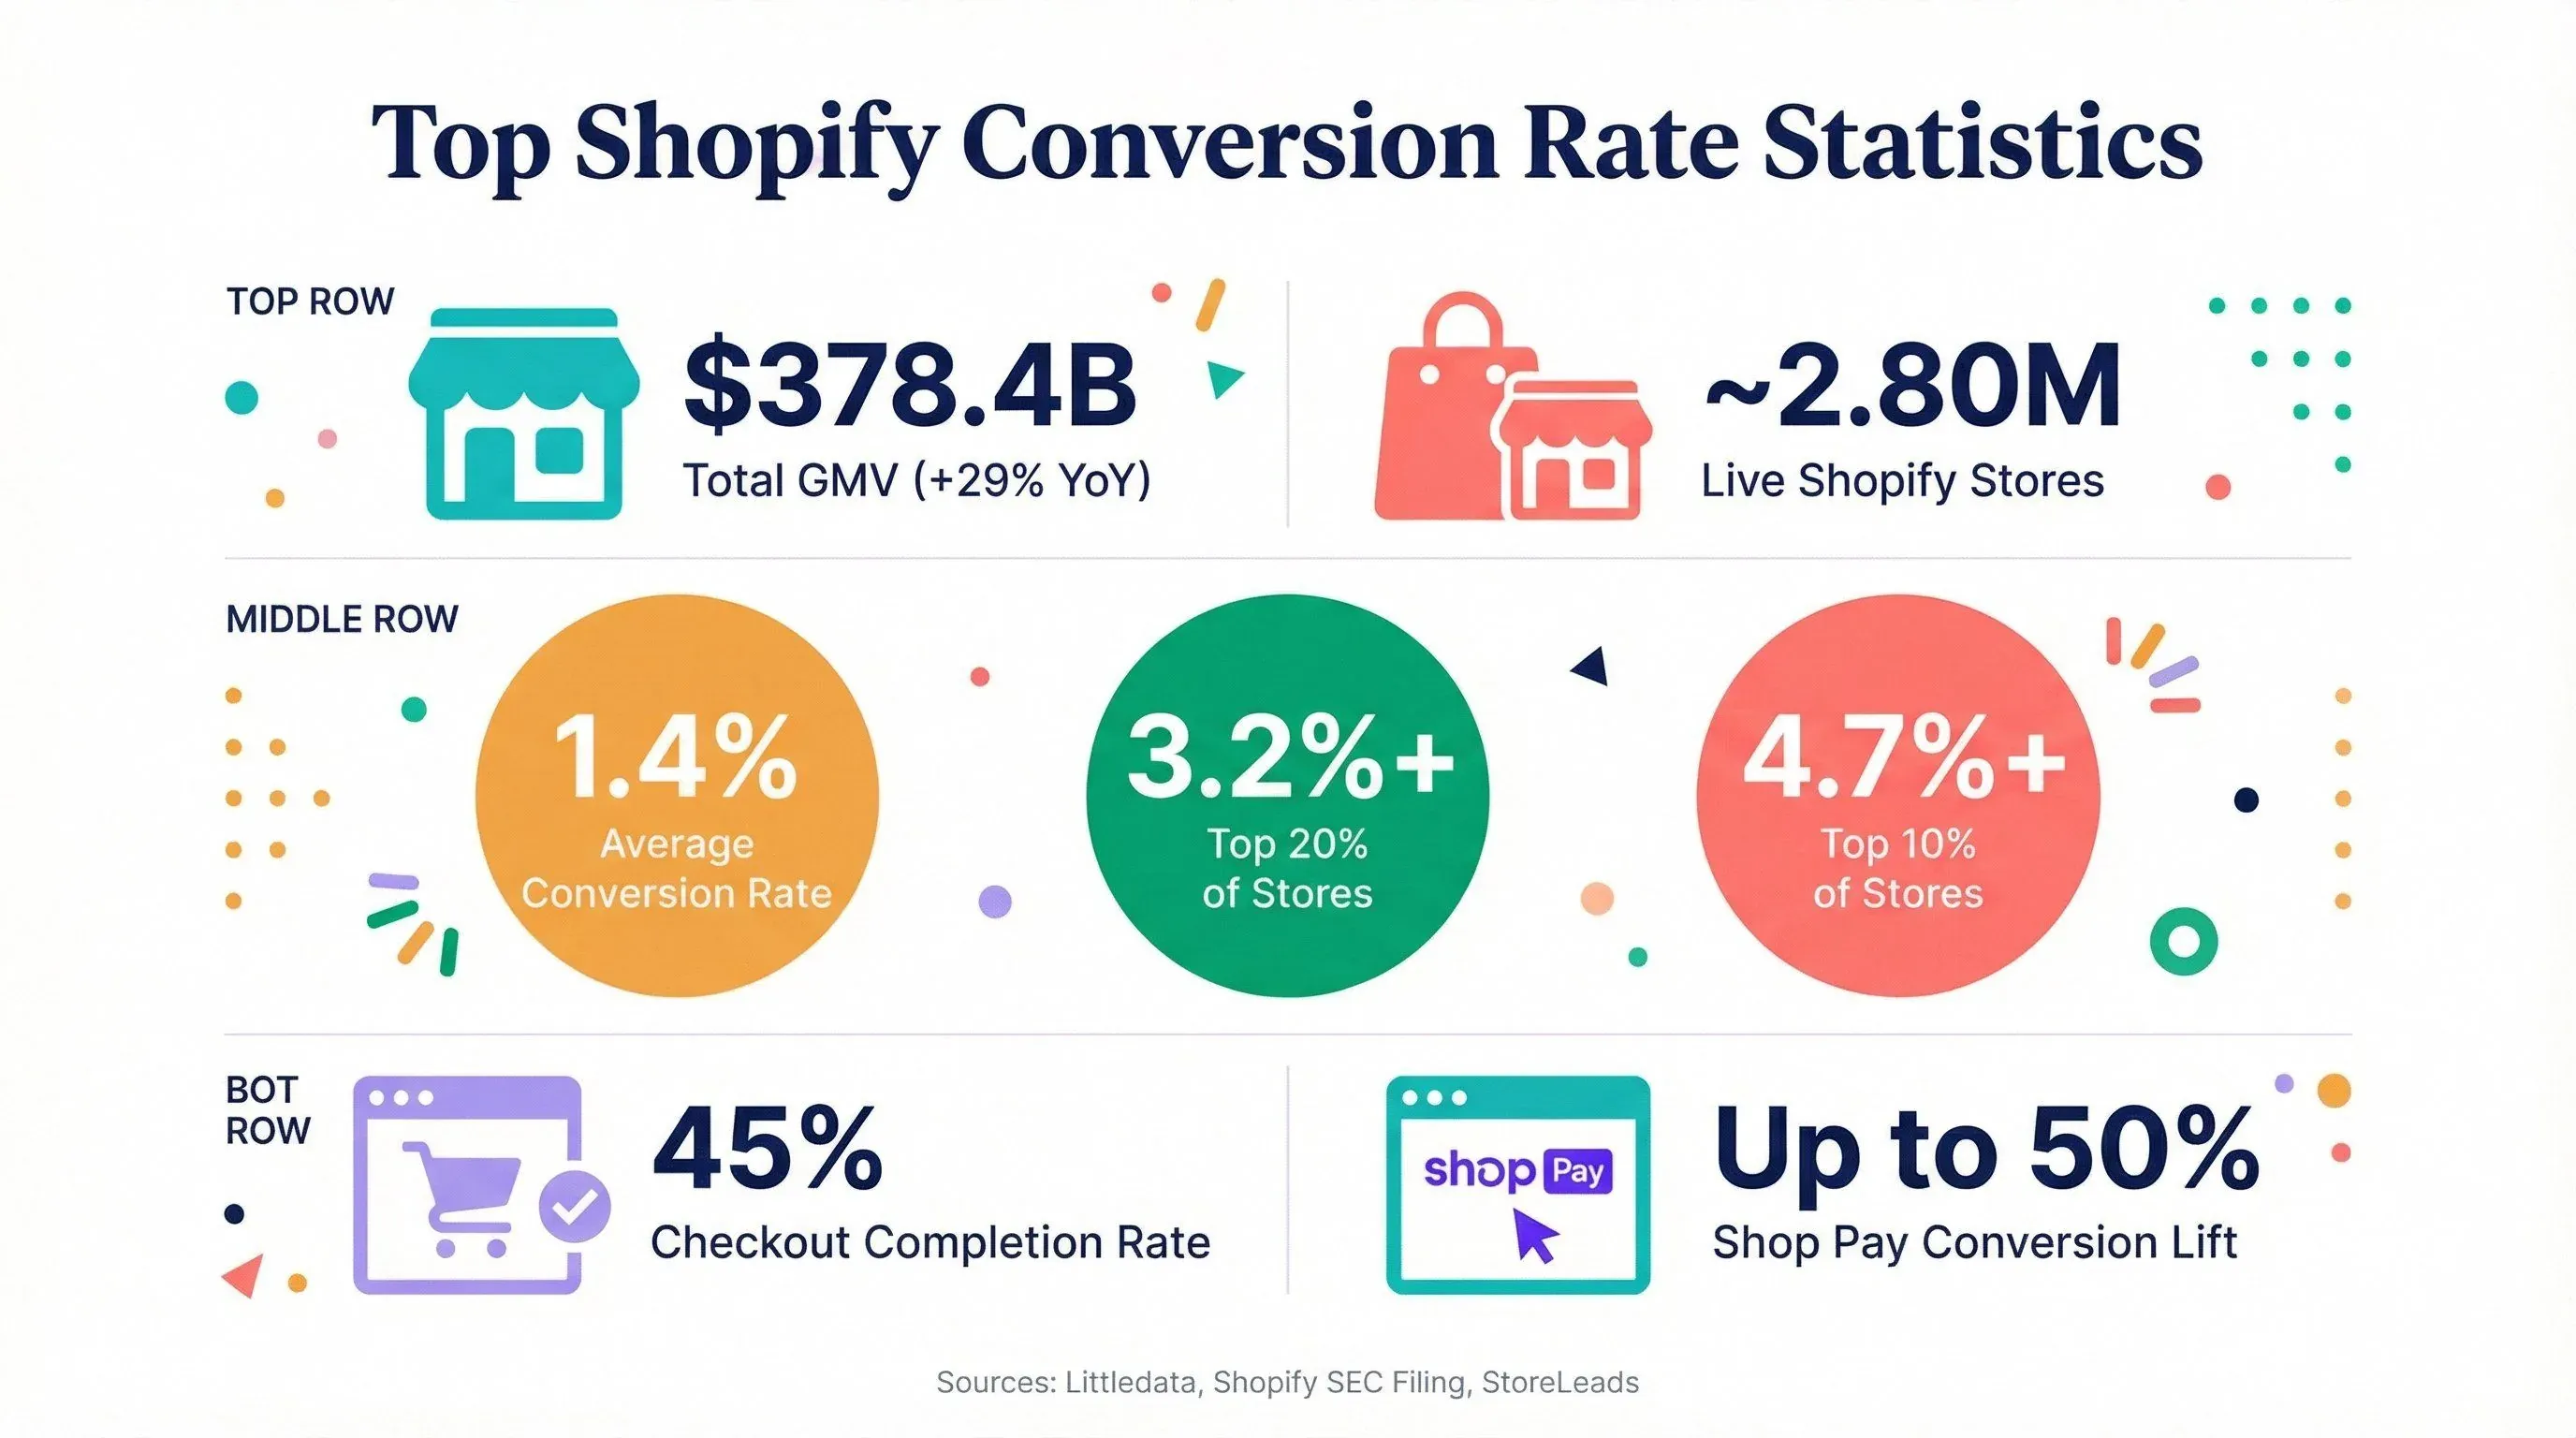
- Shopify’s total GMV in 2025: $378.4 billion (+29% YoY)
- Estimated number of live Shopify stores: ~2.84 million live stores (StoreLeads, as of May 2026) and a broader BuiltWith universe of ~6.9M historical/current installs
- Average Shopify conversion rate: 1.4% (Littledata's benchmark across ~2,800 Shopify sites — the most recent figure they publish)
- Top 20% of Shopify stores: 3.2%+ conversion rate
- Top 10% of Shopify stores: 4.7%+ conversion rate
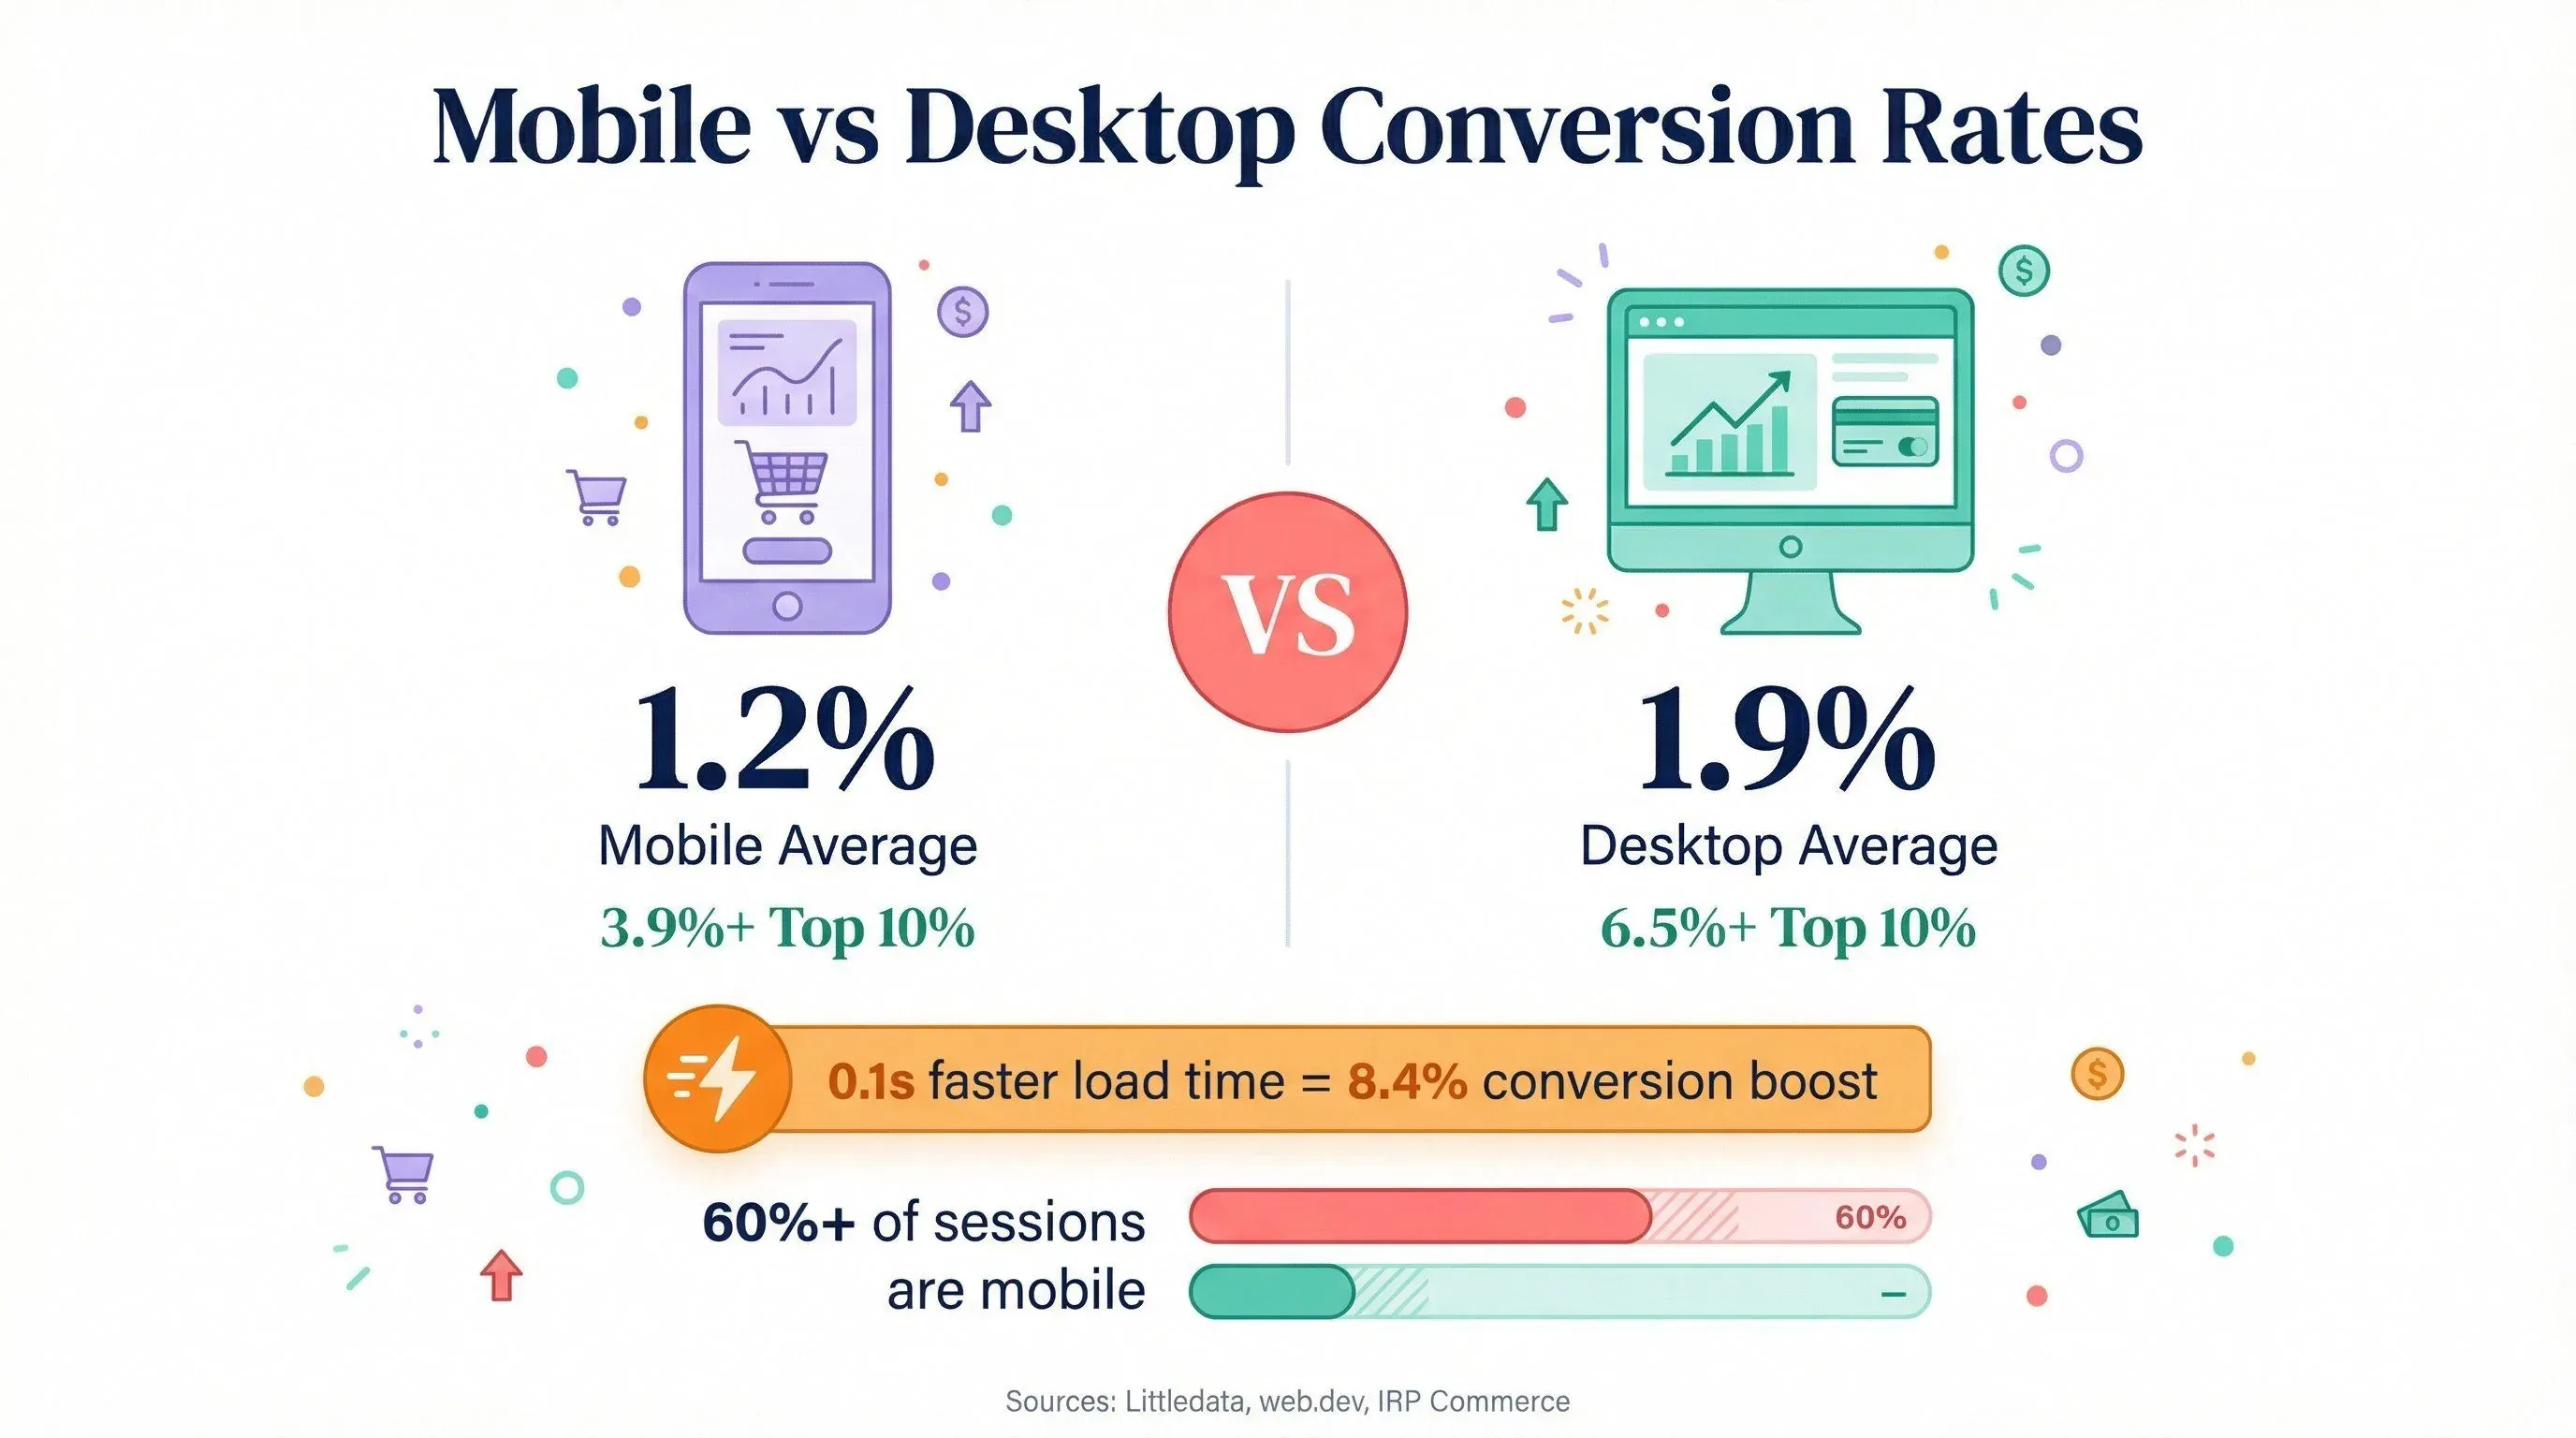
- Mobile conversion rate (average): 1.2%
- Desktop conversion rate (average): 1.9%
- Average checkout completion rate: 45%
- Average cart abandonment rate: 70.22% (Baymard Institute, 2025)
- Shop Pay conversion lift: Up to 50% higher vs. guest checkout
What does this mean for you? If your store is converting at 1.4%, you’re right at the Shopify average. But if you can push into the 3–4% range, you’re outperforming the vast majority of merchants—and likely seeing outsized revenue gains without spending more on traffic.
Understanding the Average Shopify Conversion Rate in 2026
So, what exactly is the “average Shopify conversion rate,” and why does it matter? In Shopify’s world, conversion rate is calculated as the percentage of sessions (visits) that result in an order—not users, not pageviews, but sessions. This distinction is important, especially if you’re comparing Shopify Analytics to Google Analytics 4, which may use different denominators (Shopify’s explanation).
The average Shopify conversion rate sits at 1.4%, based on Littledata's published benchmark of ~2,800 Shopify sites. That means for every 100 visitors, just over one person completes a purchase, and that figure hasn't shifted much in the last few benchmark cycles — which is part of the story: aggregate conversion rates are stable, so the spread between top performers and the median is where the real movement is. But averages can be misleading—there’s a wide distribution:
| Percentile | Conversion Rate |
|---|---|
| Average (All Stores) | 1.4% |
| Top 20% | 3.2%+ |
| Top 10% | 4.7%+ |
Why does this matter? Because small improvements compound fast. For example, if your store gets 100,000 sessions per month and your average order value is $85, moving from 1.4% to 1.8% conversion increases monthly revenue from ~$119,000 to ~$153,000—a 28.6% boost without buying a single extra click (Littledata math).
Conversion rates also vary by store size, region, and product category. Larger, more established stores often outperform newer ones, and certain verticals (like food & beverage or beauty) see higher rates than high-ticket or research-heavy categories (like electronics or travel).
Key Factors Influencing Shopify Conversion Rates
Why do some Shopify stores convert at 4% while others struggle to hit 1%? It’s rarely just luck. Here are the biggest levers that move the needle:
1. Mobile Optimization
Mobile traffic dominates—often over 60% of sessions—but mobile conversion rates lag behind desktop (1.2% vs. 1.9% on average, per Littledata). Why? Smaller screens, slower load times, and clunky checkouts all contribute.
What helps: Fast, responsive design; large, tappable buttons; and streamlined mobile checkout. Even a 0.1s improvement in mobile site speed can boost retail conversion by 8.4%.
2. Product Page Design
Clear images, detailed descriptions, and trust signals (like reviews and guarantees) are table stakes. Displaying 1–100 reviews can lift conversion by ~76.7% vs. none (PowerReviews). Social proof matters—don’t hide your best testimonials.
3. Checkout Flow
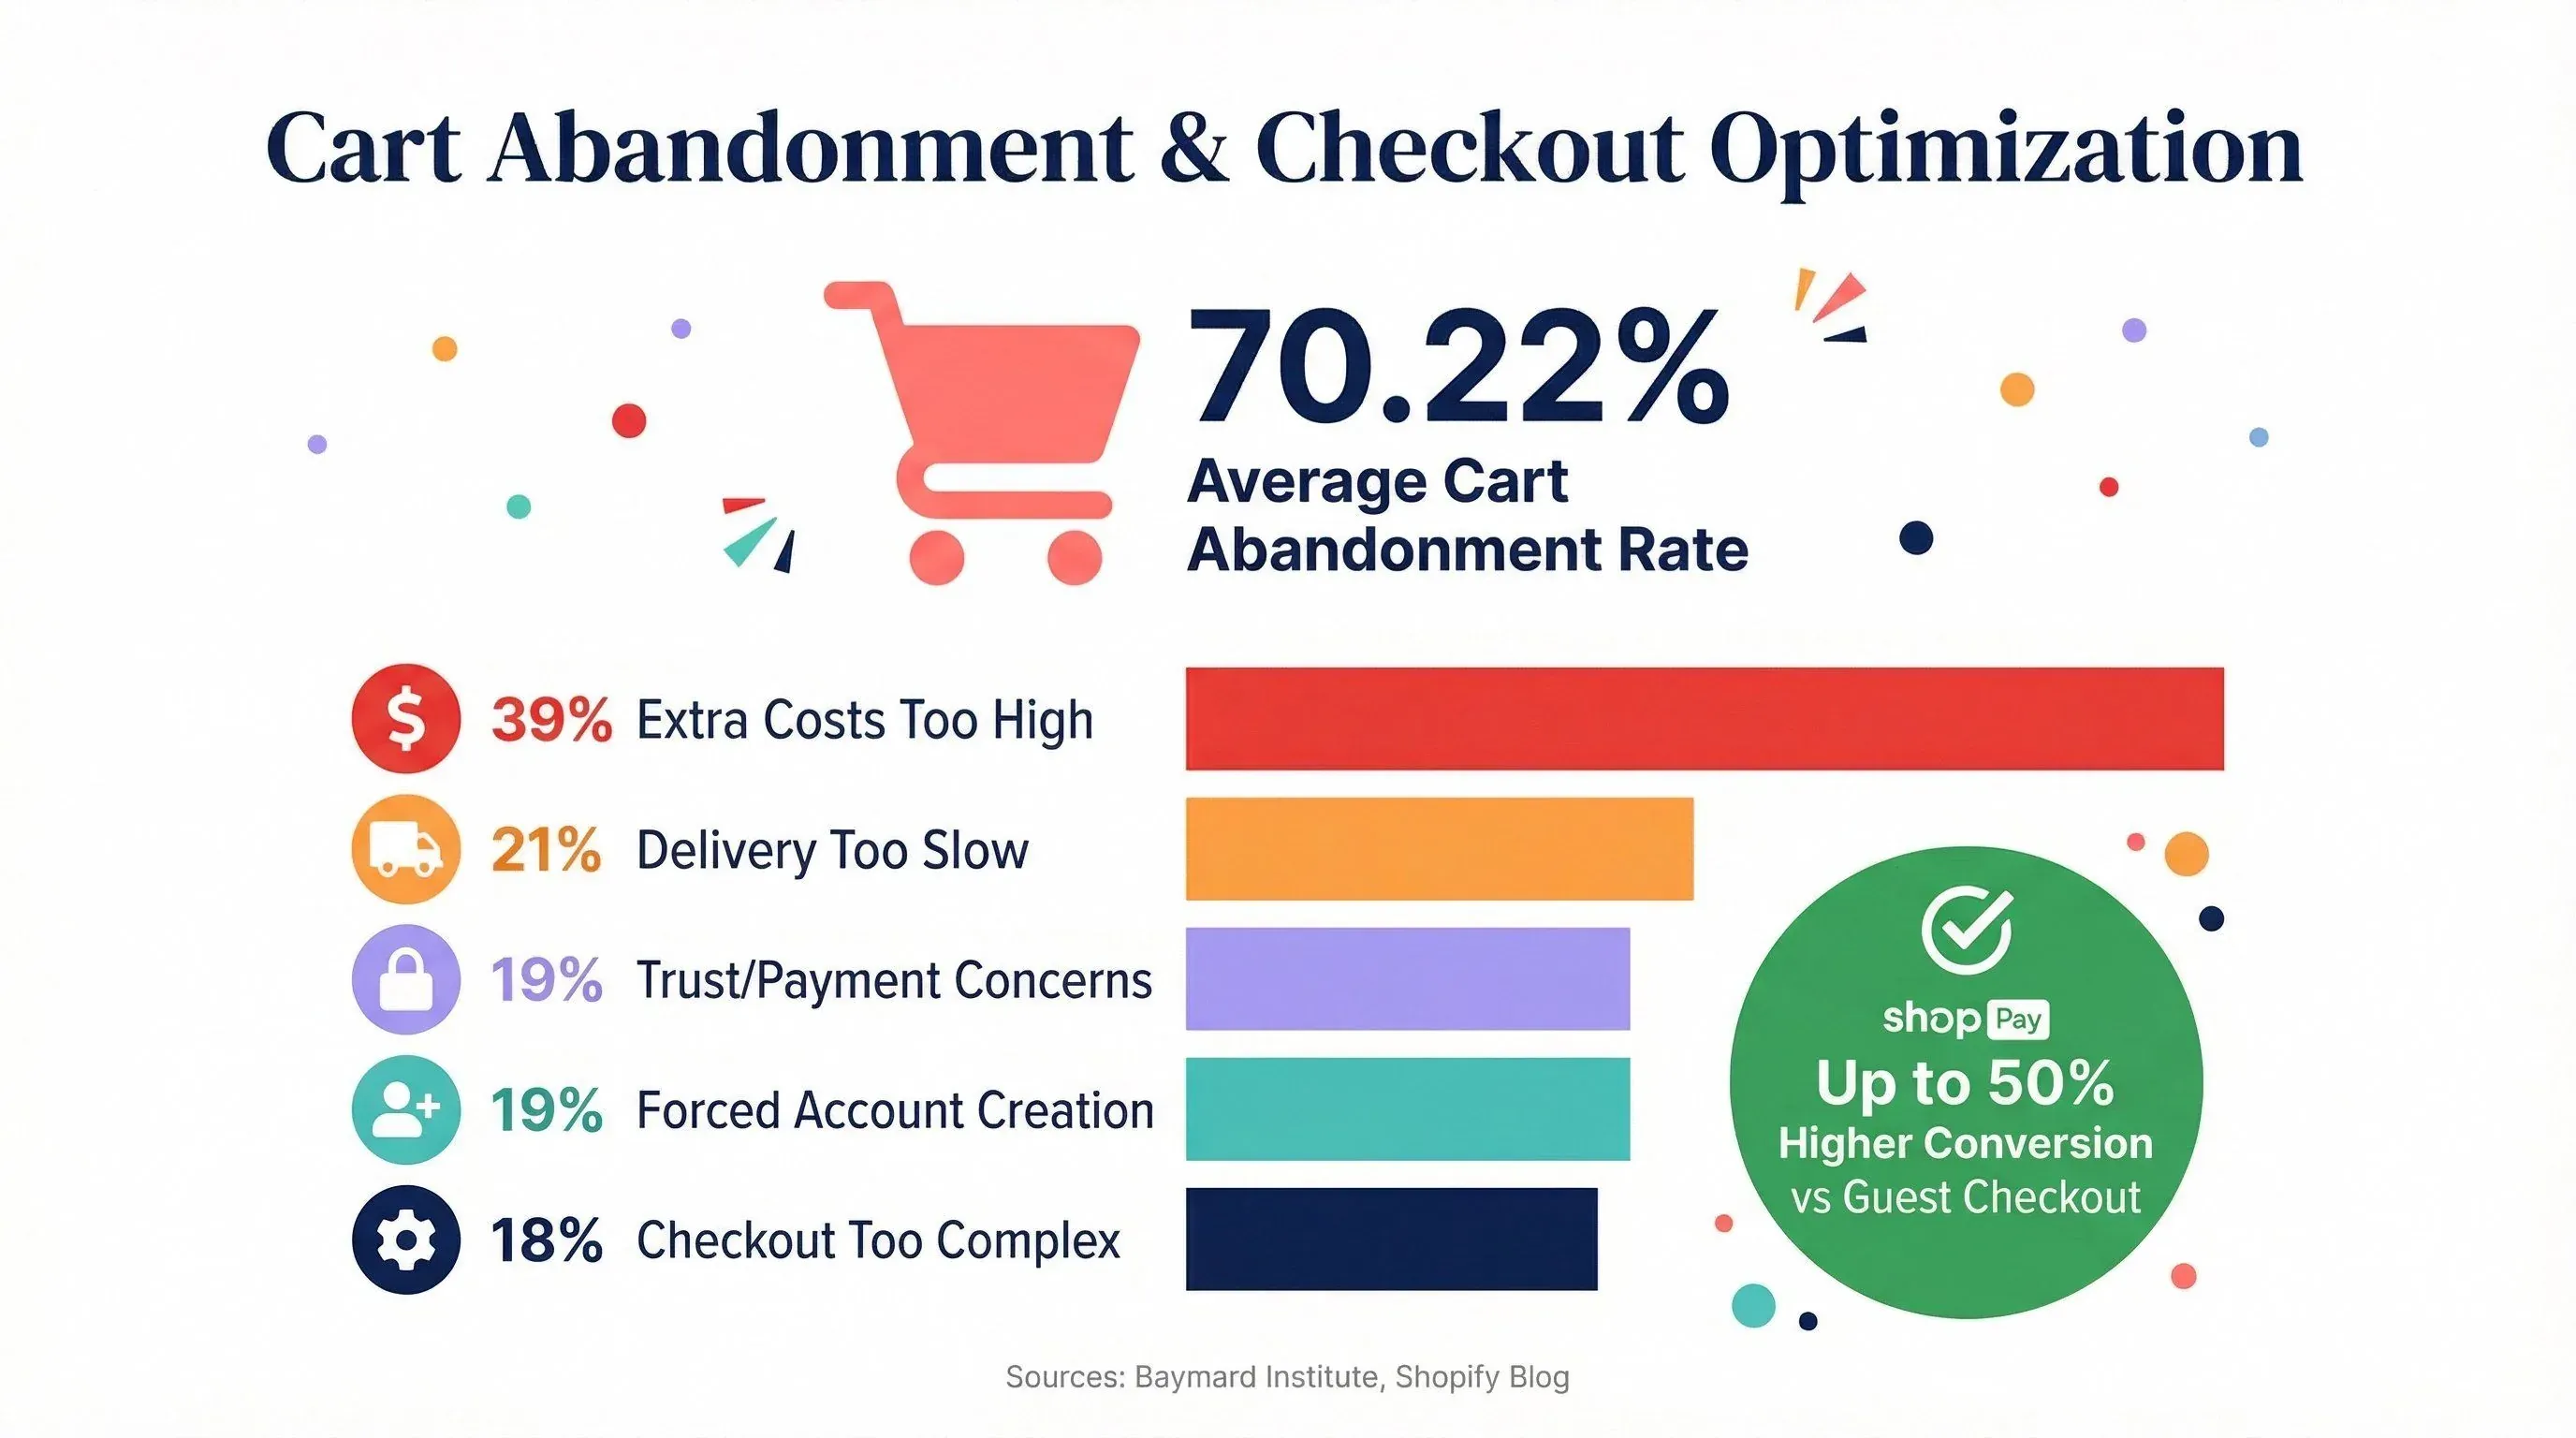
Cart abandonment is brutal: 70.22% of carts are abandoned, with top reasons being extra costs (39%), slow delivery (21%), forced account creation (19%), and complicated checkout (18%) (Baymard). Simplifying checkout, offering guest checkout, and surfacing total costs early can dramatically reduce drop-off.
Shop Pay is a standout: Shopify claims it can lift conversion by up to 50% vs. guest checkout (Shopify blog).
4. Pricing & Competitive Analysis
Your pricing strategy is only as good as your market awareness. That’s where Thunderbit Official Website comes in. With Thunderbit’s Shopify price scraper, you can automatically track competitor prices, discounts, and product reviews—all exported straight to Google Sheets, Notion, or Airtable (Thunderbit Shopify Price Scraper). This lets you react quickly to market changes and optimize your own offers for higher conversion.
Track Shopify Competitor Prices with AI
5. Trust & Payment Methods
Shoppers want to feel safe. 19% abandon carts due to trust concerns with payment (Baymard). Offering a range of payment options—including local methods—can make a big difference. For example, adding Alipay in China can lift conversion by 91% (Stripe).
Mobile vs. Desktop Conversion Rates
The mobile/desktop gap is real—and closing it is a huge opportunity. In 2026:
- Mobile conversion rate (Shopify average): 1.2%
- Desktop conversion rate (Shopify average): 1.9%
- Top 10% of stores achieve: 3.9%+ mobile, 6.5%+ desktop
Why is mobile lower? Checkout friction, smaller screens, and sometimes less trust. But the best stores are closing the gap with one-page checkouts, accelerated payment methods, and mobile-first design (Shopify one-page checkout).
Checkout Process and Cart Abandonment
Cart abandonment is the silent killer of ecommerce. The average Shopify store sees over 70% of carts abandoned (Baymard). Here’s what’s driving it:
| Reason for Abandonment | % of Respondents |
|---|---|
| Extra costs too high | 39% |
| Delivery too slow | 21% |
| Didn’t trust site/payment | 19% |
| Forced account creation | 19% |
| Checkout too long/complex | 18% |
| Unsatisfactory returns | 15% |
| Site errors/crashes | 15% |
| Not enough payment methods | 10% |
Actionable fixes: Be transparent with pricing, offer guest checkout, simplify forms, and provide multiple payment options. Even small tweaks here can yield big conversion wins.
Shopify Conversion Rate Benchmarks by Industry
Not all Shopify stores are created equal. Here’s how conversion rates stack up by industry, using the latest benchmarks from Littledata, Growth Suite, and Dynamic Yield:
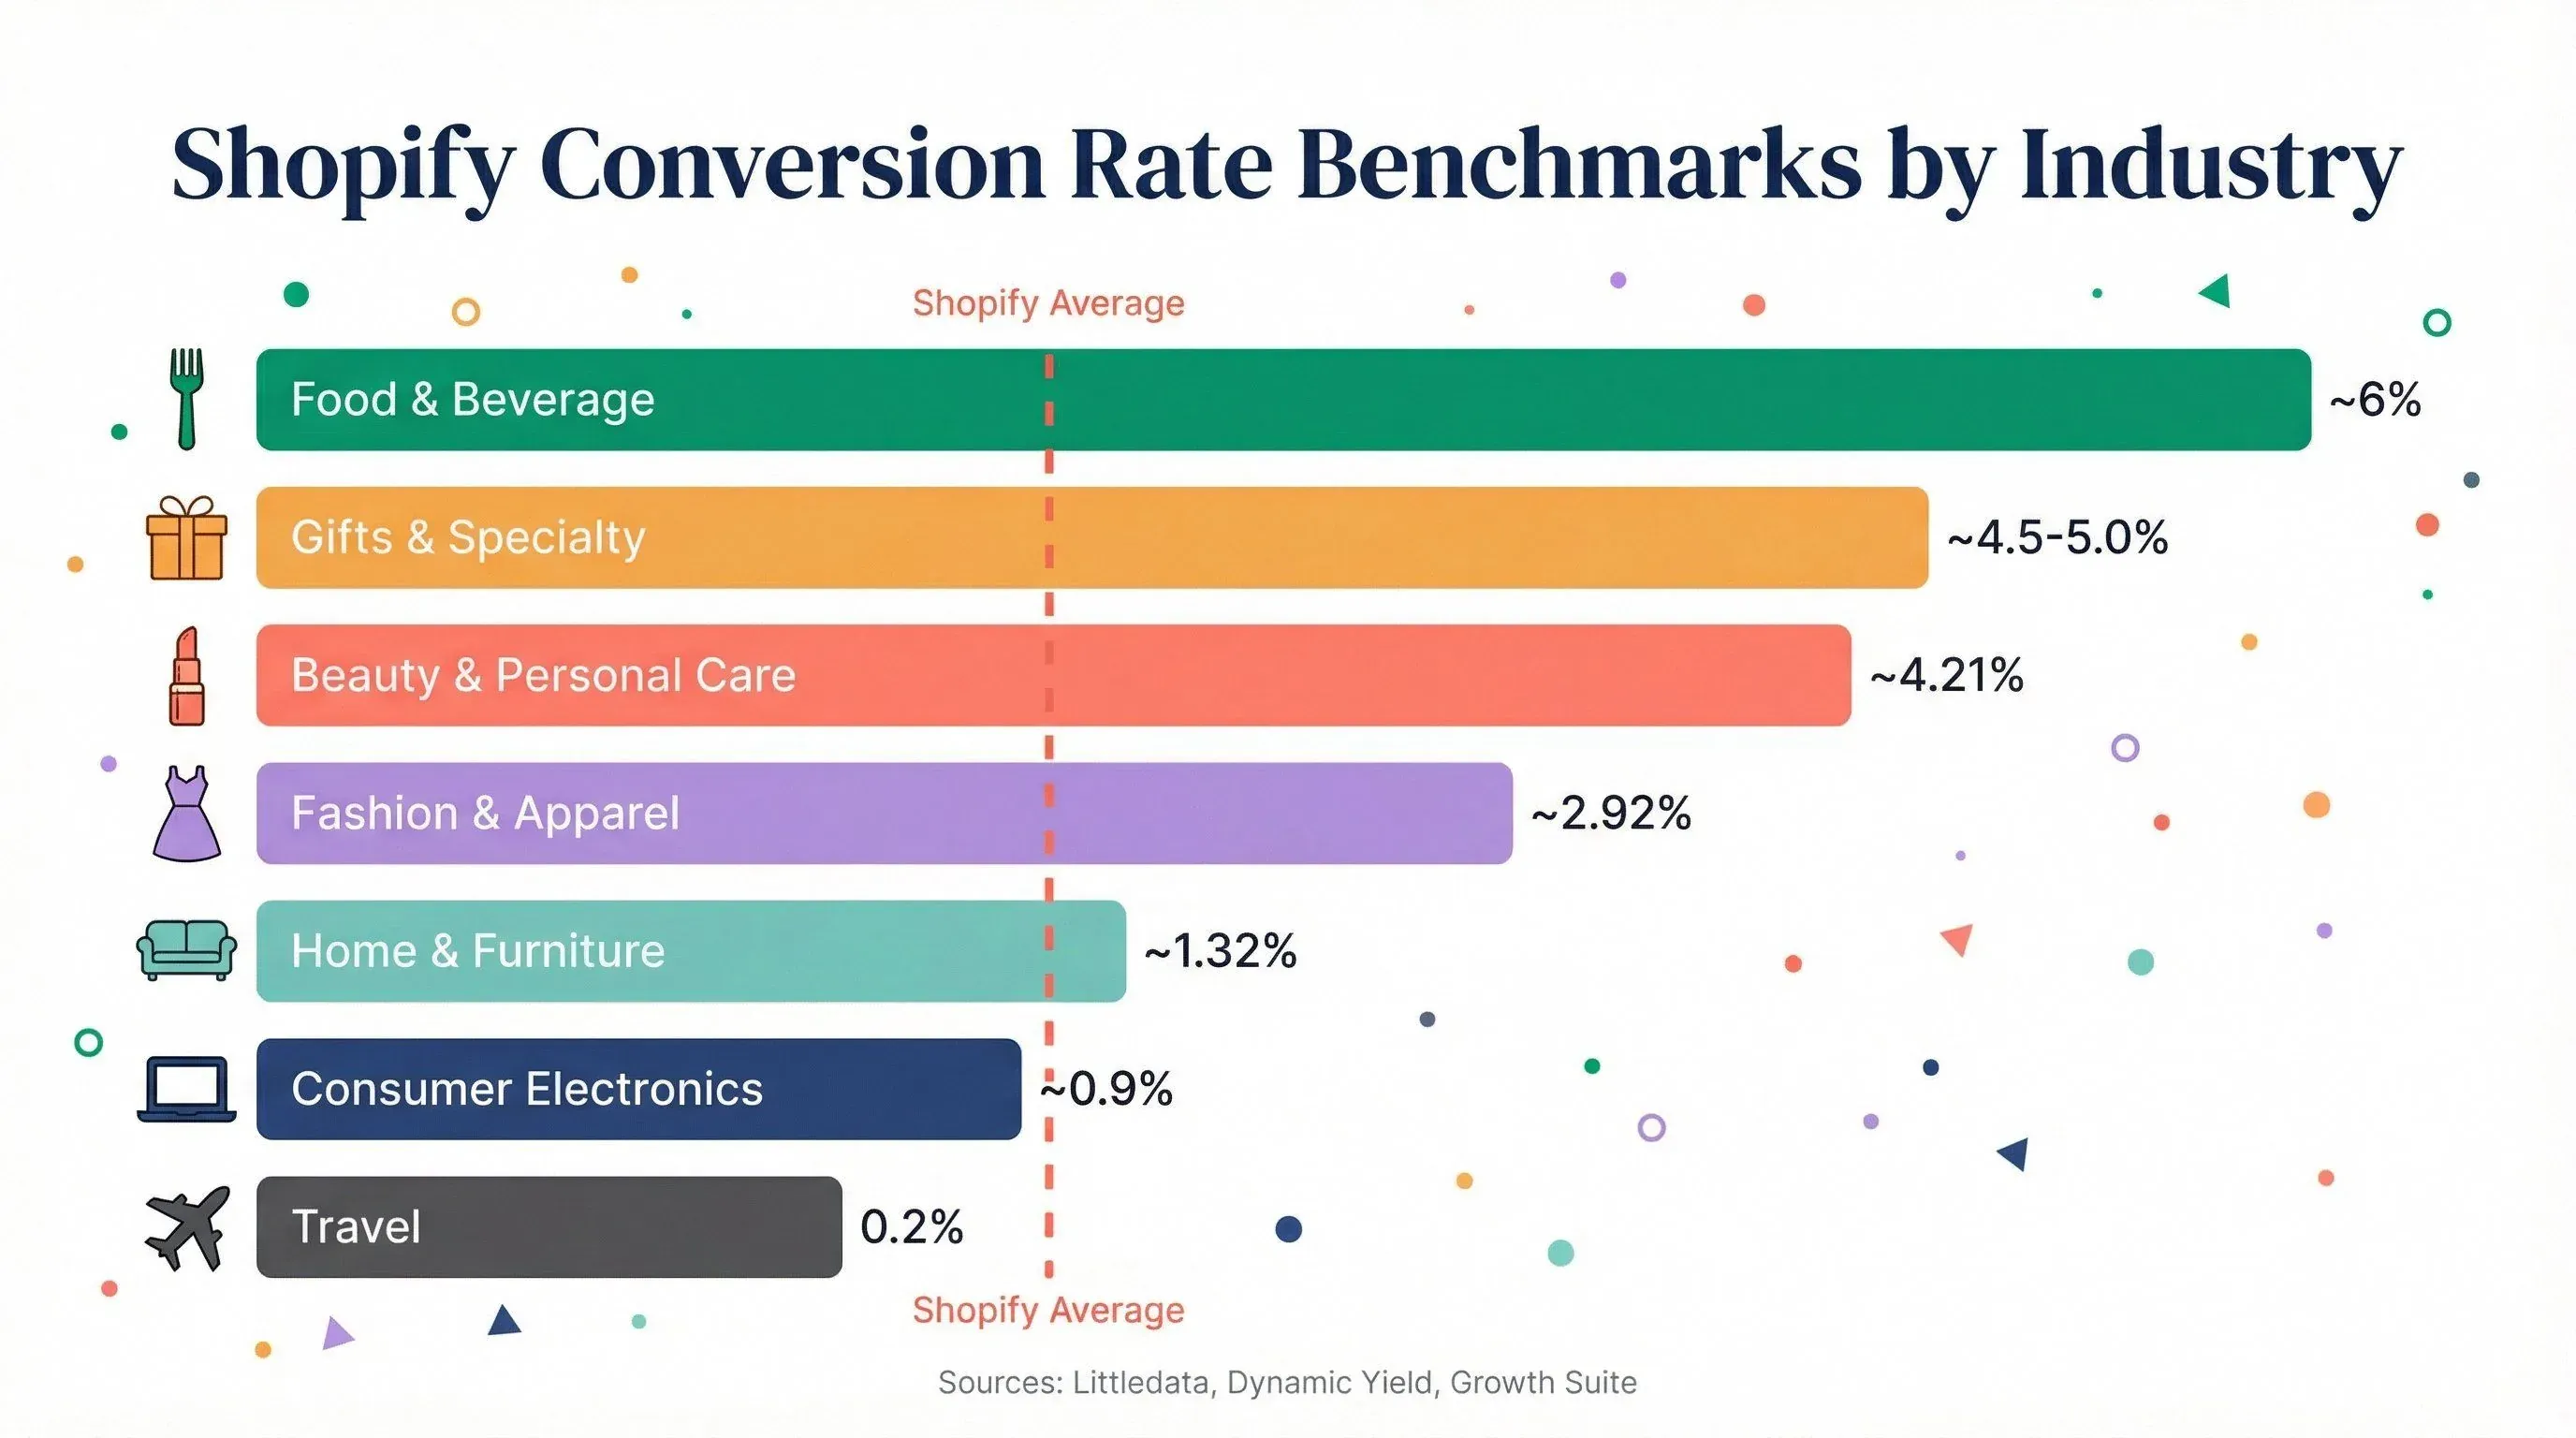
| Industry | Shopify Benchmark | Comparator Benchmark | Why Higher/Lower? |
|---|---|---|---|
| Beauty & Personal Care | — | ~4.21% (Dynamic Yield) | Repeat purchases, replenishment |
| Fashion & Apparel | 1.9% (Littledata) | ~2.92% (Dynamic Yield) | Sizing/fit friction, high intent |
| Food & Beverage | 1.5% (Littledata) | ~6% (Dynamic Yield) | Subscription/reorder frequency |
| Home & Furniture | — | ~1.32% (Dynamic Yield) | High AOV, long consideration |
| Consumer Electronics | — | ~0.9% (Dynamic Yield) | High price, comparison shopping |
| Gifts & Specialty | — | ~4.5–5.0% (Growth Suite) | High intent, urgent need |
| Luxury/Premium | — | ~0.9% (Dynamic Yield) | High AOV, trust barrier |
| Travel | 0.2% (Littledata) | — | Research-heavy, long booking cycle |
Key takeaway: Don’t compare your electronics store to a beauty brand. Set goals based on your vertical—and use tools like Thunderbit to benchmark against direct competitors.
Trends in Improving Shopify Store Conversions for 2026
The playbook for boosting Shopify conversions is evolving fast. Here are the strategies gaining traction in 2026:
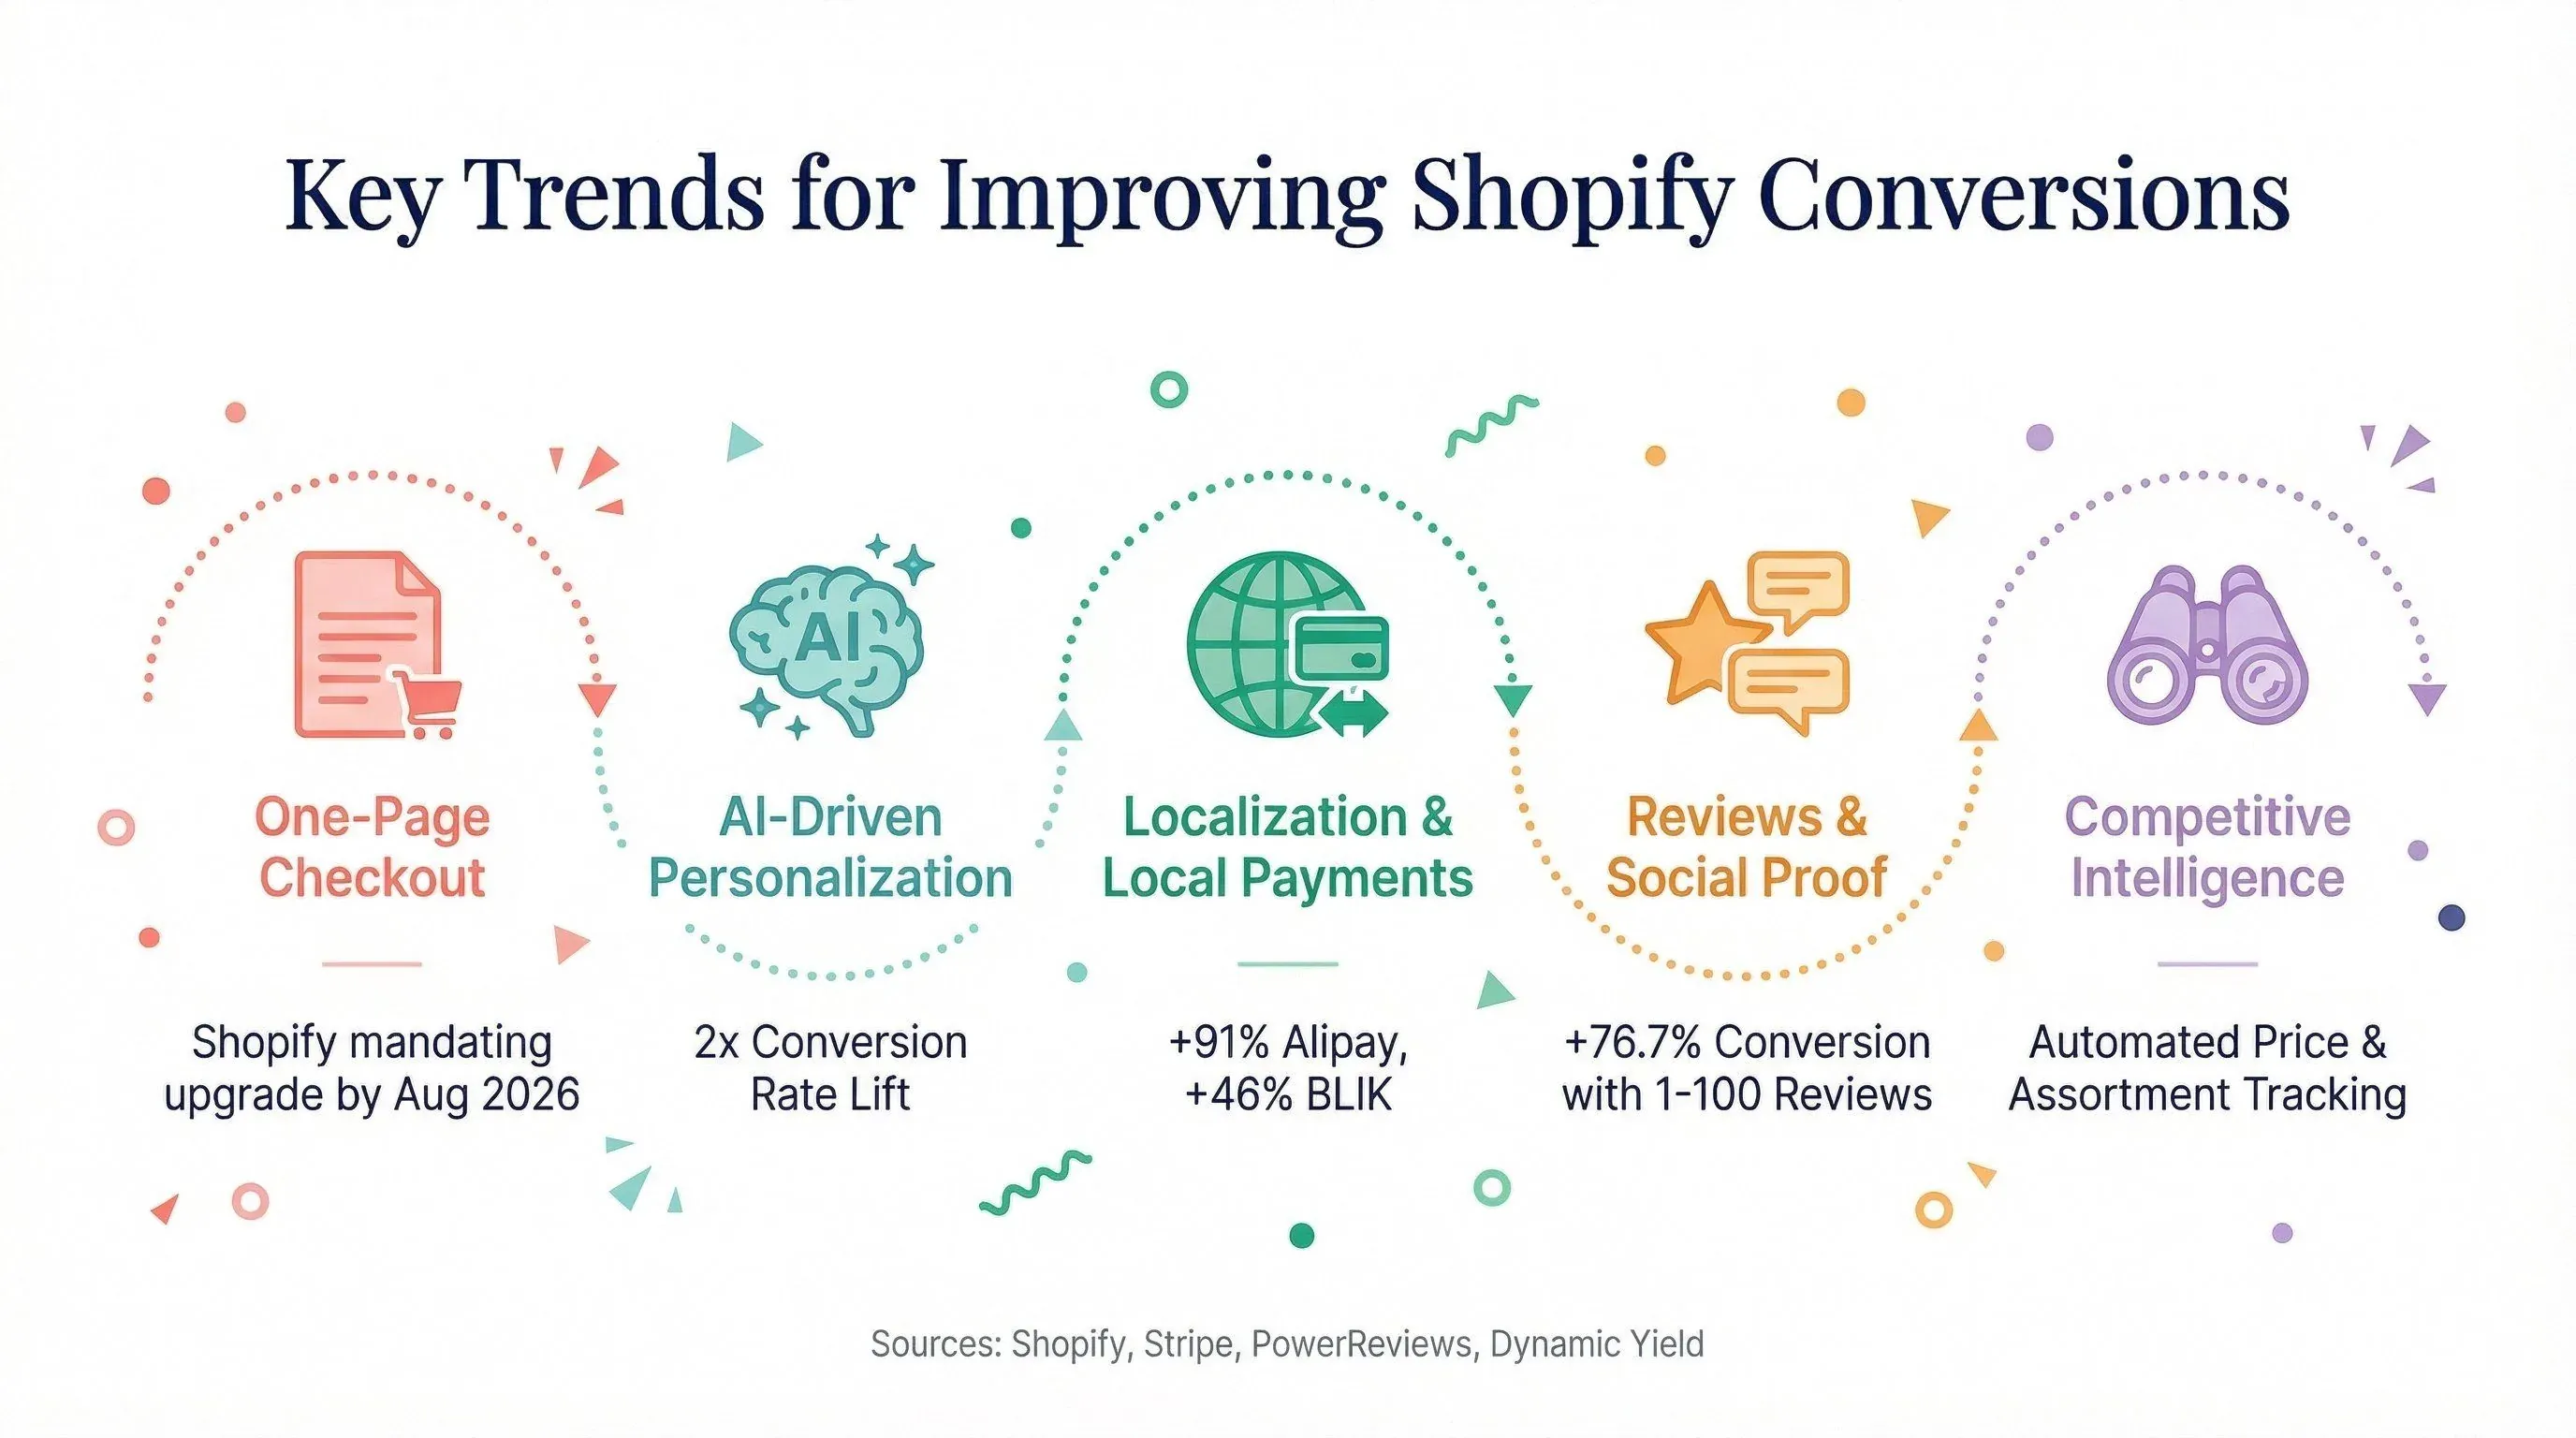
1. Checkout Modernization
Non-Plus Shopify merchants have until August 26, 2026 to upgrade their Thank you and Order status pages to the new checkout extensibility framework (Shopify Help Center). The broader push toward one-page checkout and the new post-purchase pages reduces steps, speeds up the process, and improves tracking accuracy — a win-win for conversion and analytics.
2. AI-Driven Personalization
Personalized product recommendations, dynamic content, and AI-powered search are no longer nice-to-haves. Shopify’s own data shows that AI recommendations can more than double conversion rates (Shopify AI stats). Real-world case studies, like Cotopaxi’s +12% conversion lift, prove the impact.
3. Enhanced Product Page SEO
With organic traffic getting more expensive, optimizing product pages for search is critical. Rich snippets, structured data, and user-generated content (like reviews) all help.
4. Automation & Competitive Intelligence
Staying ahead means knowing what your competitors are doing—on pricing, promotions, and reviews. Thunderbit Official Website lets you automate competitor data collection, track changes, and spot opportunities to improve your own conversion rate. For example, you can set up scheduled scrapes to monitor price drops or new product launches across dozens of competitor stores.
5. Localization & Payment Methods
Offering local payment options can dramatically lift conversion in international markets. Stripe’s tests show +91% conversion with Alipay in China and +46% with BLIK in Poland (Stripe blog).
Thunderbit’s Role in Conversion Rate Optimization
I’ve seen firsthand how data-driven insights can transform a Shopify store’s performance. Thunderbit Official Website is built for exactly this—helping both small DIY shops and high-traffic brands turn competitive intelligence into conversion wins.
How Thunderbit Helps:
- Natural language prompts: Just describe the data you want (“Scrape competitor prices and reviews for these products”), and Thunderbit’s AI does the rest.
- Automated data extraction: Pull pricing, promotions, review counts, and product details from any Shopify store—no coding needed.
- Subpage and pagination scraping: Go beyond the main page—Thunderbit can visit each product page, grab detailed info, and enrich your dataset.
- Instant export: Push data directly to Google Sheets, Notion, Airtable, or Excel for easy analysis and action.
- Scheduled scrapes: Keep tabs on competitors with automated, recurring data pulls—so you’re never caught off guard by a sudden sale or new product launch.
Whether you’re running a one-person shop or managing a portfolio of brands, Thunderbit gives you the same market intelligence that big retailers use—without the IT headaches.
Comparing Shopify Conversion Rates: Store Size, Region, and Traffic Source
Conversion rates aren’t just about what you sell—they’re also shaped by your store’s size, where your customers are, and how they find you.
By Store Size
- Small/new stores: Often below average (sub-1.4%), as they build trust and refine their offer.
- Established/enterprise stores: More likely to hit 2–4%+, thanks to brand recognition, repeat customers, and optimized UX.
By Region
- North America & Western Europe: Typically see higher conversion rates, reflecting mature ecommerce markets and strong logistics.
- Emerging markets: Lower conversion rates, often due to payment friction, trust barriers, or shipping challenges.
By Traffic Source (IRP Commerce)
| Channel | Share of Sales | Typical Conversion Rate |
|---|---|---|
| Paid Search | 65.2% | Lower (high volume, lower intent) |
| Direct | 15.6% | Higher (returning customers) |
| 11.3% | Highest (warm audience) | |
| Social | — | Variable (depends on targeting) |
Takeaway: Focus on nurturing your email list and driving direct traffic for the best conversion rates. Use paid channels for scale, but don’t expect them to convert as well as your loyal base.
Key Takeaways: What the 2026 Shopify Conversion Rate Data Means for Your Store
- The average Shopify conversion rate is 1.4%—but top stores hit 3–5%+.
- Mobile lags desktop, but the gap is closing with better UX and checkout flows.
- Cart abandonment is high (70%+), but most causes are fixable: extra costs, slow delivery, forced account creation, and complex checkout.
- Industry matters: Fashion and food stores convert differently than electronics or luxury.
- Personalization, AI, and automation are the biggest levers for improvement in 2026.
- Competitive intelligence is a must: Use tools like Thunderbit to track prices, reviews, and assortment changes in real time.
- Small improvements compound: A 0.4% lift in conversion rate can mean tens of thousands in extra revenue per month.
FAQs
1. What is a “good” conversion rate on Shopify in 2026?
A “good” conversion rate is anything above the 1.4% average. If you’re hitting 3.2%+, you’re in the top 20% of stores; 4.7%+ puts you in the top 10%.
2. How does Shopify calculate conversion rate?
Shopify uses the number of orders divided by the number of sessions (visits) to your store—not users. (Shopify’s explanation)
3. Why is my mobile conversion rate lower than desktop?
Mobile conversion averages 1.2% vs. 1.9% on desktop, mostly due to checkout friction, smaller screens, and sometimes less trust. Optimizing mobile UX and checkout can help close the gap.
4. What’s the most common reason for cart abandonment?
The top reason is extra costs (shipping, tax, fees) at checkout—39% of shoppers cite this. Other big factors: slow delivery, forced account creation, and complex checkout.
5. How can Thunderbit help improve my Shopify conversion rate?
Thunderbit lets you automate competitor price and review tracking, monitor assortment changes, and benchmark your offers—all with no coding. Use this data to optimize your pricing, product pages, and promotions for higher conversion.
Further Reading & Resources
- Littledata Shopify Benchmarks
- Baymard Cart Abandonment Statistics
- Shopify Investor Reports
- BuiltWith Shopify Usage Stats
- StoreLeads Shopify Store Count
- Shopify Help Center: Checkout Upgrades
- Shopify Blog: Shop Pay Conversion Lift
- Dynamic Yield Industry Benchmarks
- Thunderbit Shopify Price Scraper
- Thunderbit Blog
If you’re ready to turn insights into action, download the Thunderbit Chrome Extension and start benchmarking your store against the best in the business. Here’s to higher conversions and a more profitable 2026.
Try AI Web Scraper for Shopify Insights Get Started Free