
Executive Summary
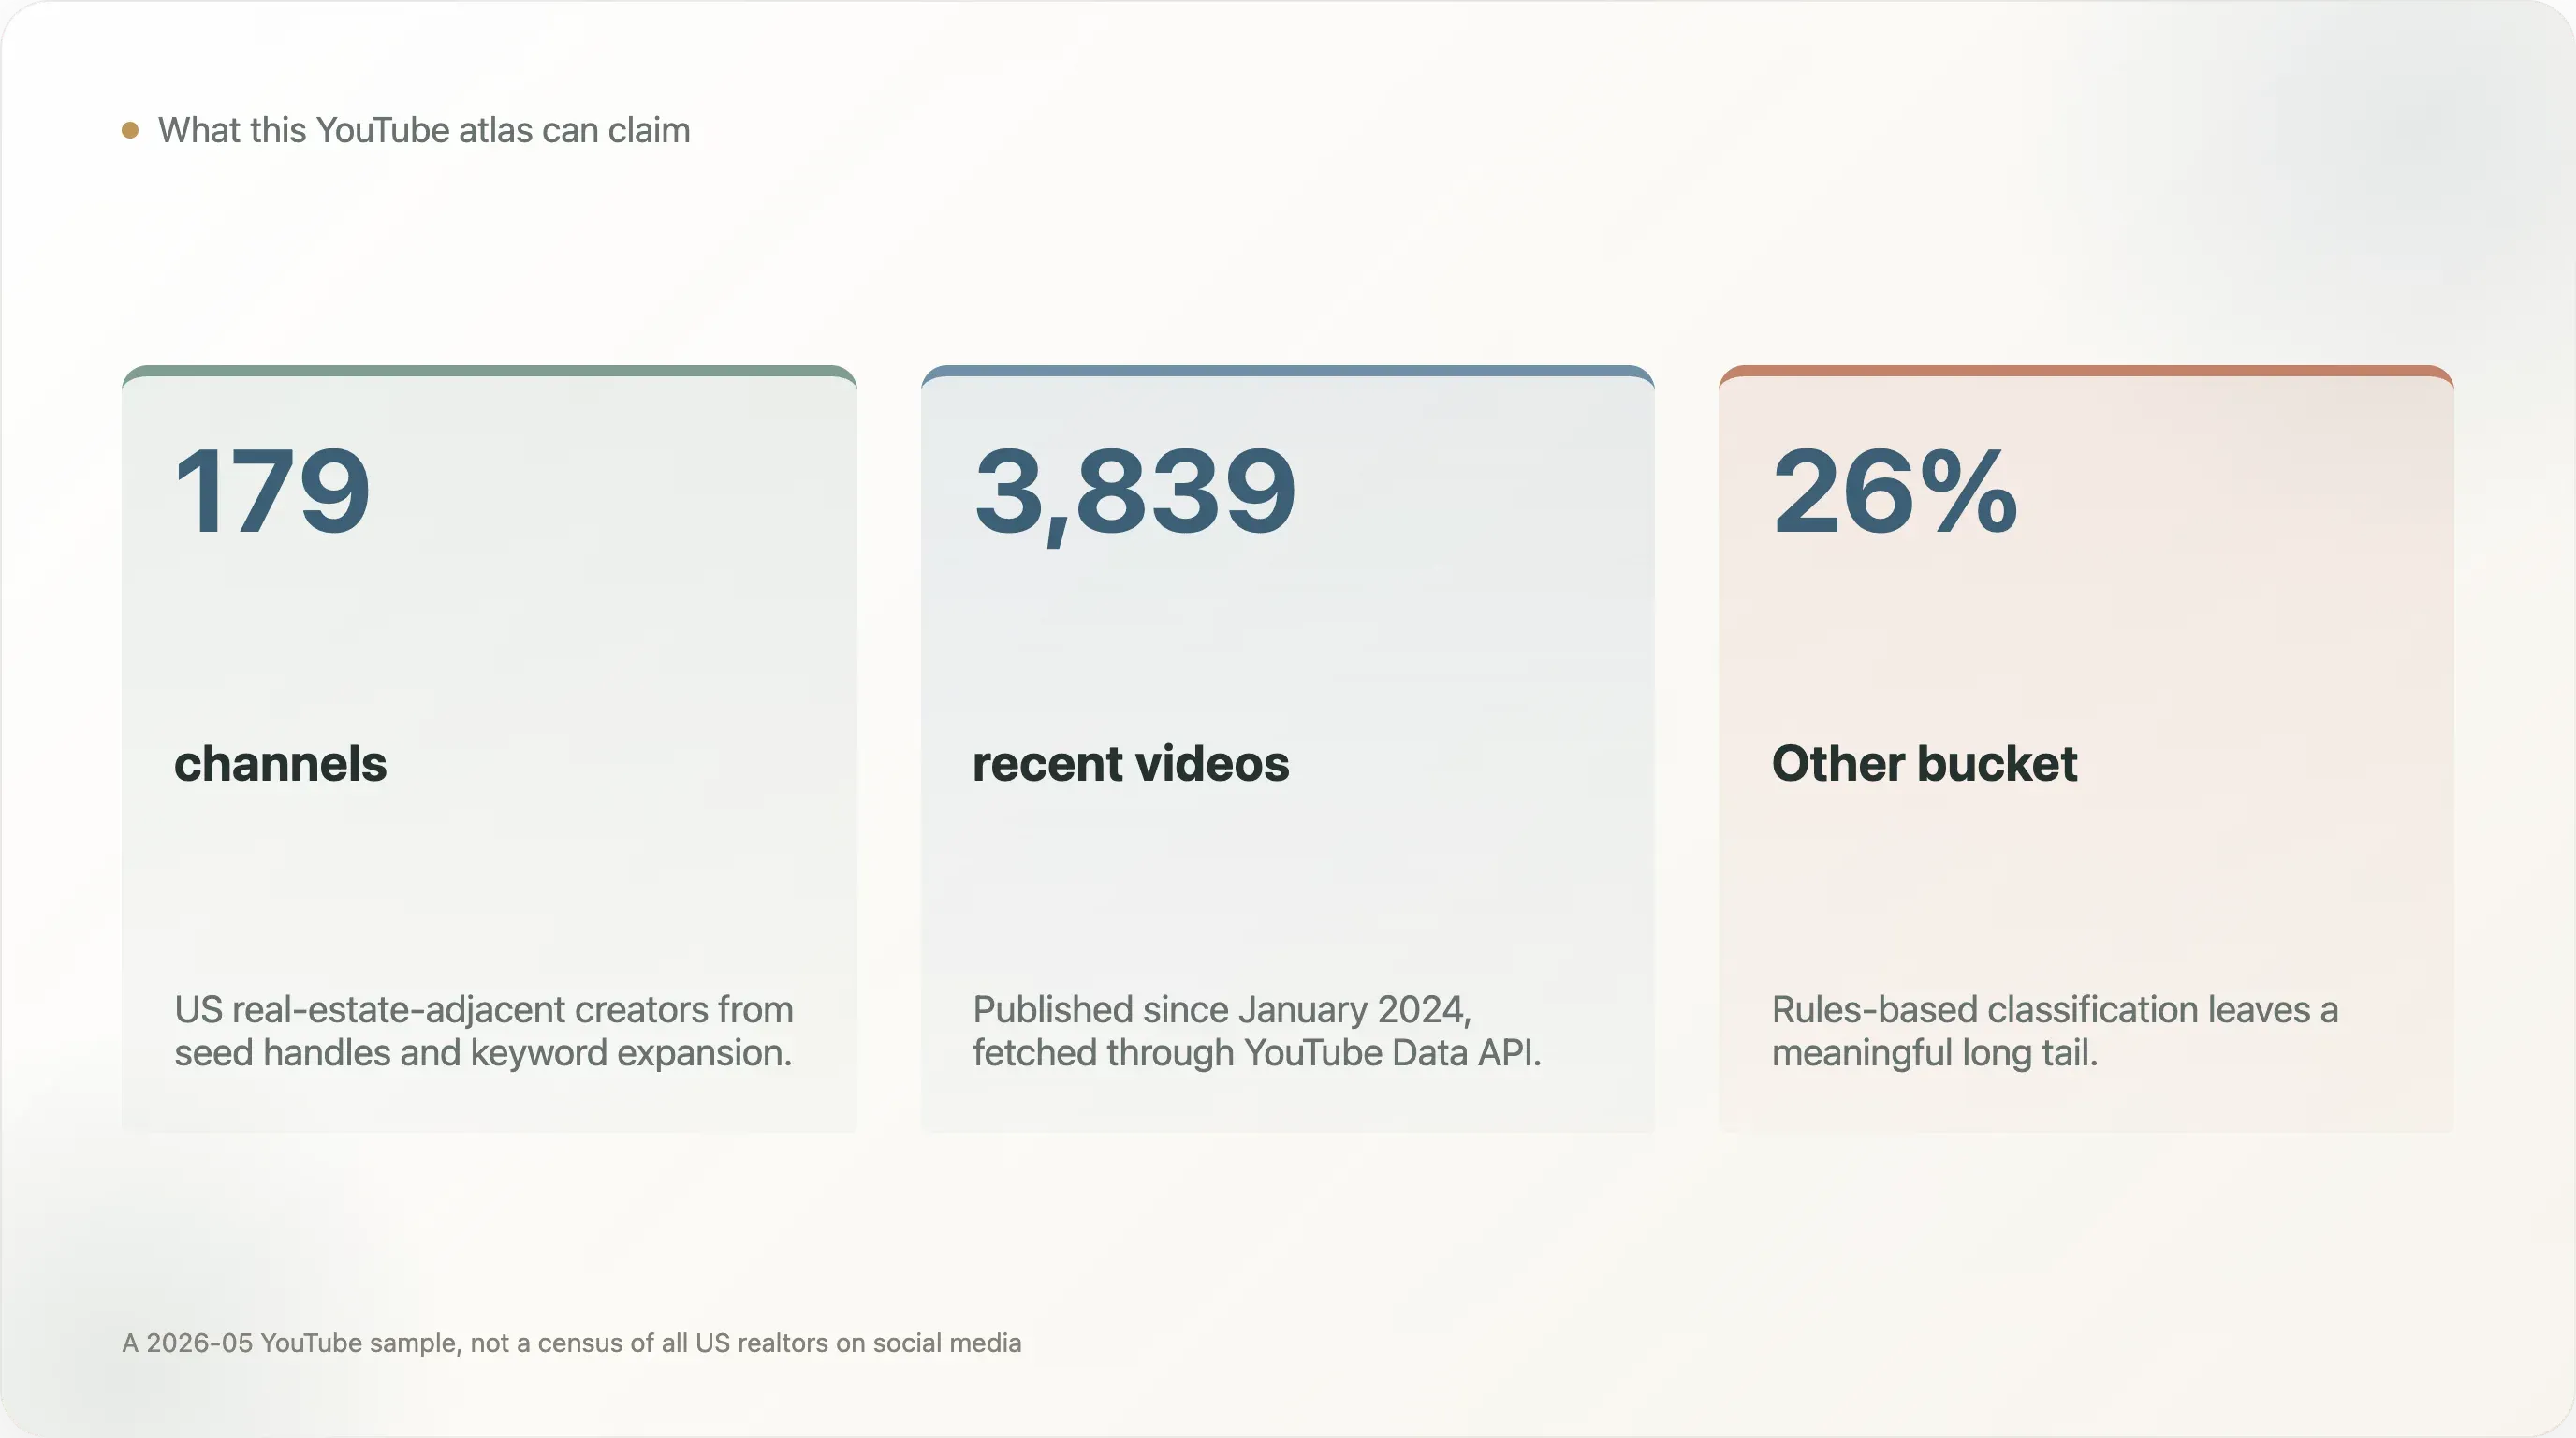
This research uses the YouTube Data API to analyze 179 US real-estate-adjacent channels and 3,839 recent videos published since January 2024. It asks which real-estate content formats actually earn views on YouTube.
The strongest finding is the gap between home-tour framing and listing framing. Home-tour videos pull a median of 3,010 views, while listing-or-sale videos pull a median of 531. The same property can perform very differently depending on whether the video feels like creator content or an advertisement.
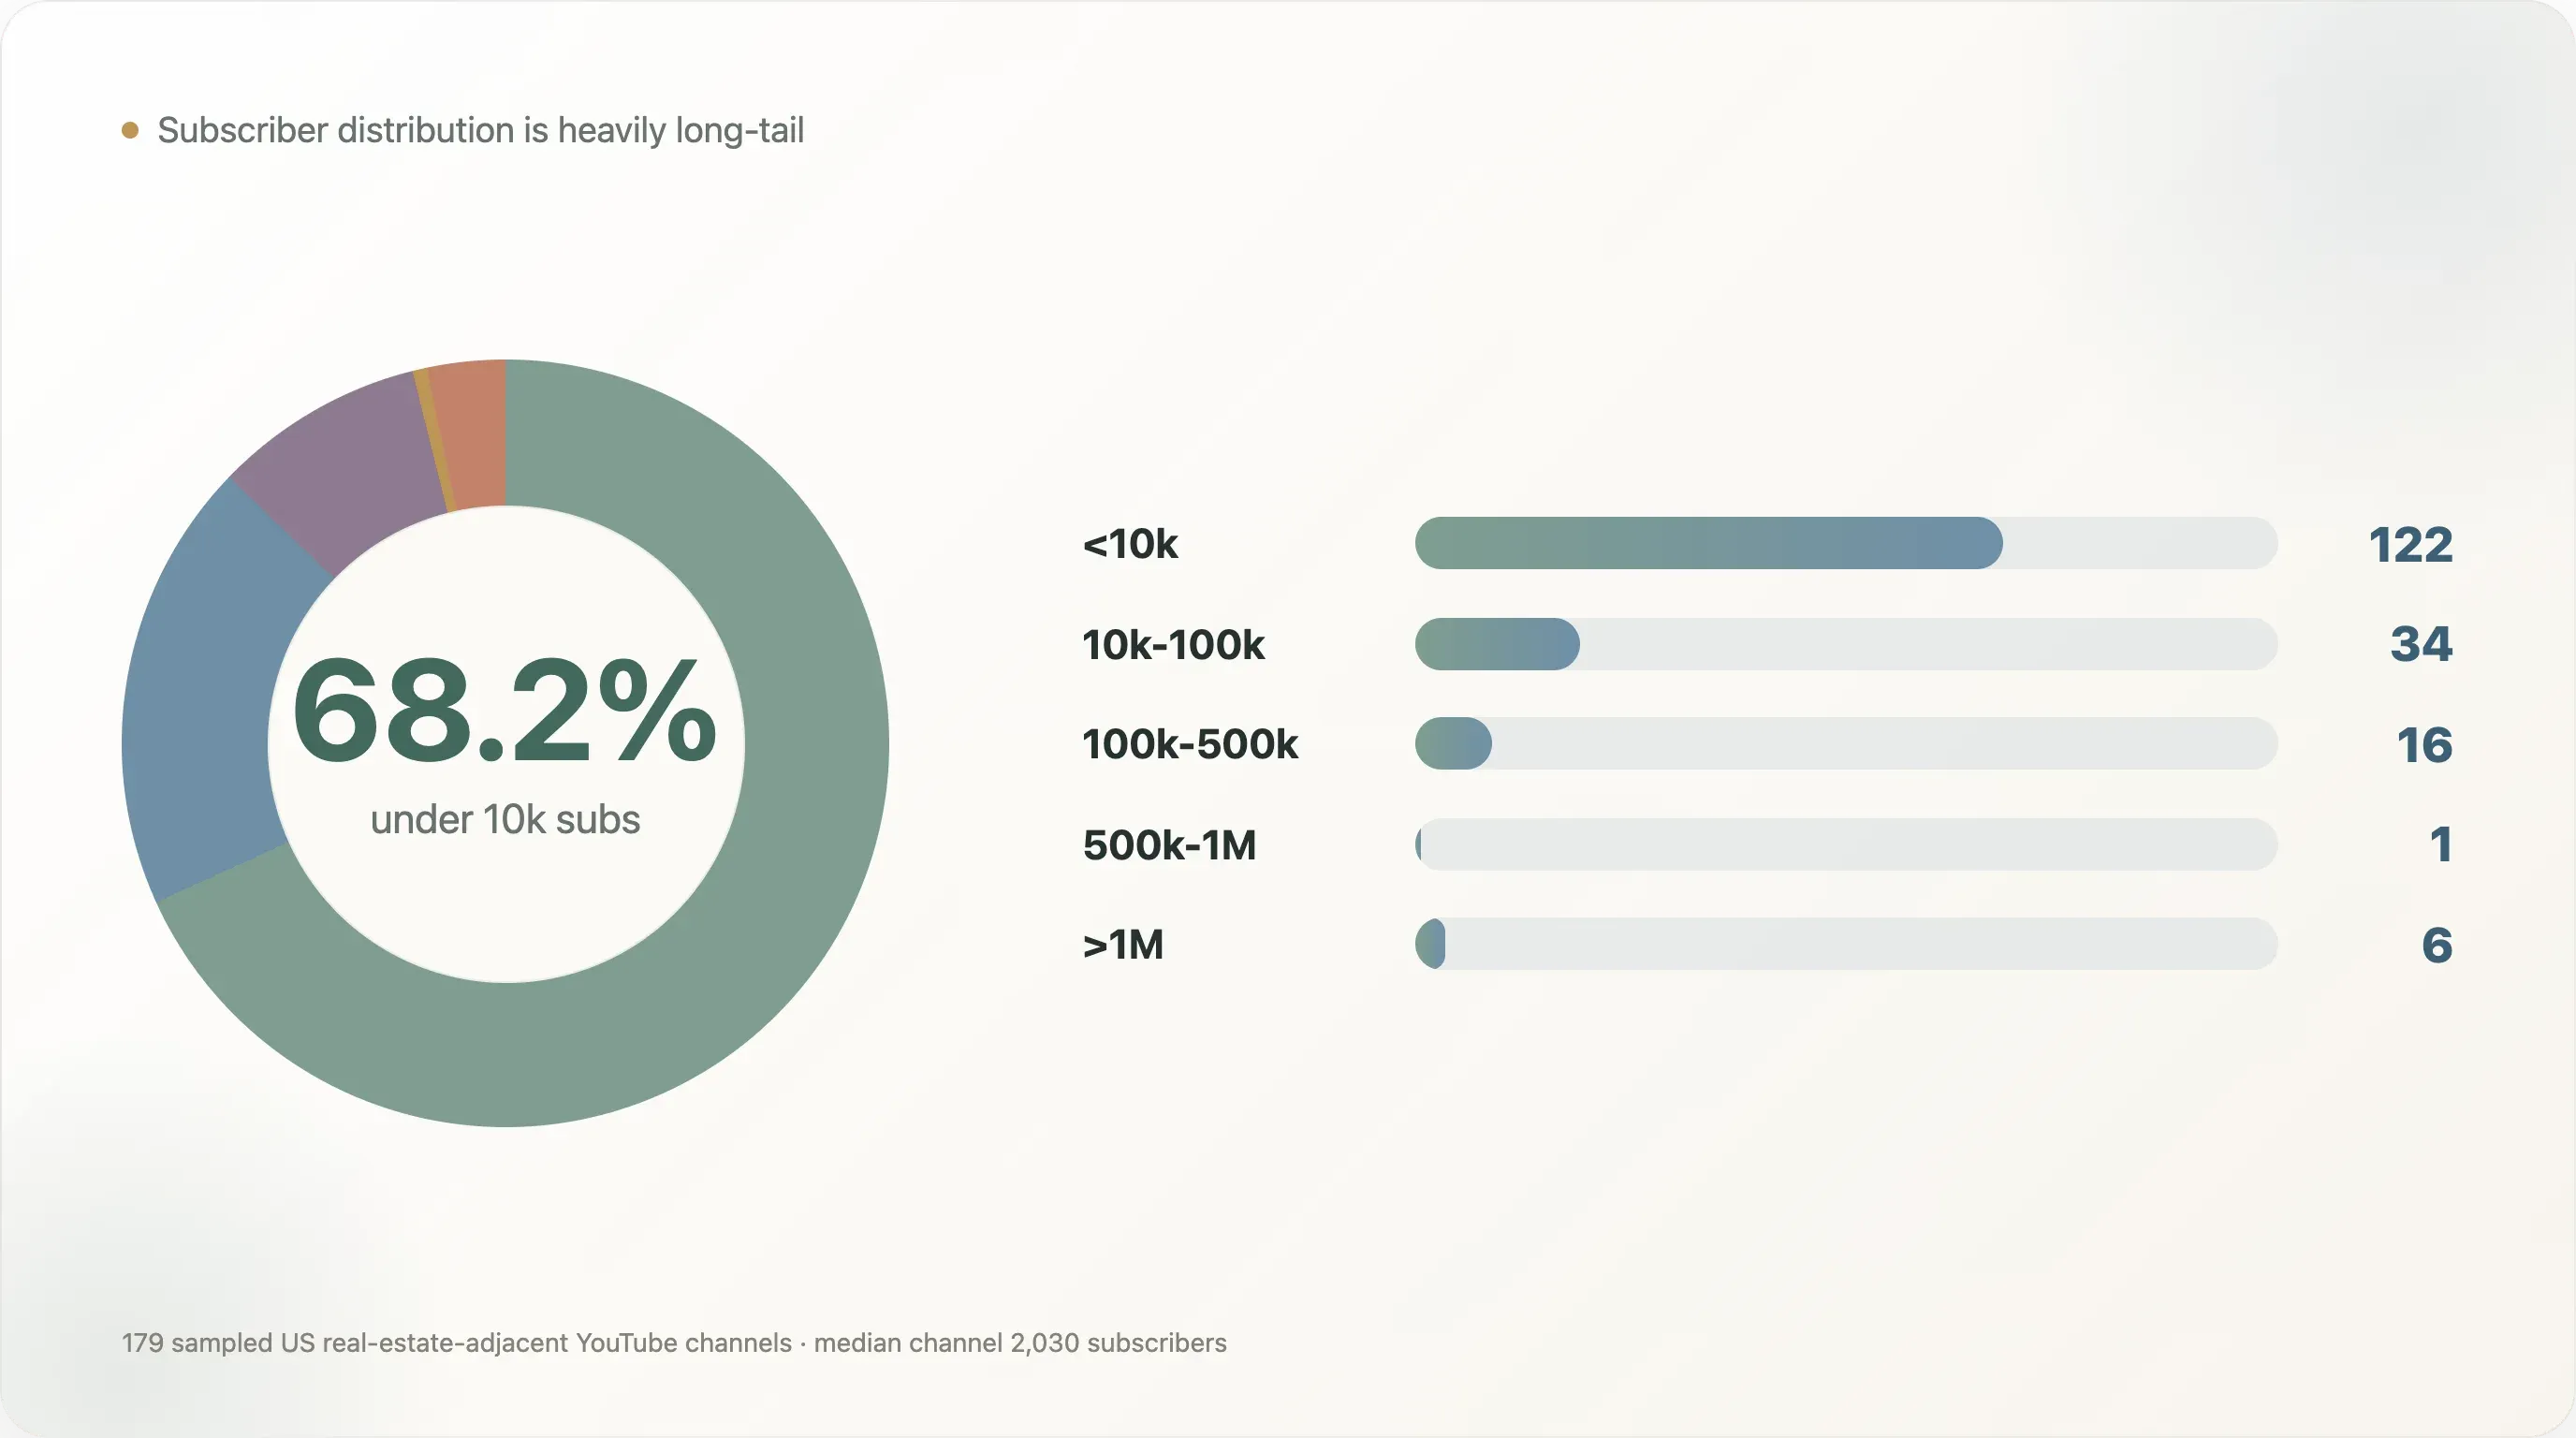
The channel distribution is heavily long-tail. 68.2% of sampled channels have fewer than 10,000 subscribers, and the median channel has 2,030 subscribers. Real-estate YouTube is not a broad field of large creators; it is a small head with a very large tail.
The top of the market is also not dominated by ordinary local agents. Erik Van Conover led the sample by recent views, and several top channels operate more like media brands, investing educators, or luxury-content creators than conventional brokerage lead-generation channels.
Try Thunderbit for AI Web Scraping
The Most Shareable Findings
-
The sample covers 179 channels and 3,839 recent videos.
-
Median channel subscriber count is 2,030.
-
122 of 179 channels, or 68.2%, have fewer than 10,000 subscribers.
-
Home-tour videos have a median of 3,010 views.
-
Listing-or-sale videos have a median of 531 views, about 5.7x lower than home tours.
-
Luxury content accounts for 15.5% of videos but 33.8% of views.
-
The median posting cadence is 7.4 videos per month.
Real-estate professionals often approach YouTube as if it were a video brochure: show the listing, introduce the agent, explain the service, and wait for leads. YouTube does not behave like a brochure rack. It behaves like an entertainment and search platform where the packaging of the idea matters as much as the expertise behind it.
That is why this dataset is useful beyond real estate. It shows what happens when a local professional-services industry tries to use a creator platform. The credential that matters offline does not automatically translate into attention online. The algorithm does not know whether an agent is respected in their market. It can only observe whether viewers click, stay, and come back.
The report below is written for agents, brokerages, content teams, and SEO agencies that want a realistic benchmark. The lesson is not "every agent should become a YouTuber." It is that the channels winning on YouTube behave more like media products than listing feeds.
The algorithm doesn't care about your license. A real-estate agent with twenty years of local experience and a stack of awards gets no algorithmic credit from YouTube. The recommender weighs one thing: whether viewers click and whether they watch through.
We spent a week scraping 179 US real-estate-adjacent YouTube channels — 4,431 videos across the last 16 months — asking a deceptively simple question: which content moves? The answers aren't complicated, but they're counter-intuitive enough that we stopped to double-check several of them.
Four data points that surprised us.
One, listing videos earn 1/5.7 the views of home-tour videos. Home tours pull a median of 3,010 views; videos where a realtor showcases their own listing pull a median of 531. Realtors instinctively make the second kind — they think of YouTube as an extension of the listing. The algorithm sees those videos as ads and suppresses them. Across our 246 listing/sale videos, the median didn't break a thousand.
Two, the top YouTube channel in this space isn't a real-estate agent. Erik Van Conover pulled 46.5M views over the last 16 months. He holds a license, but his actual revenue is YouTube ads and brand deals, not commissions. His format — suit, mansion, slow-motion narration — is closer to Architectural Digest than Realtor.com. Over the same 16-month window, his recent views outrun Ryan Serhant (Bravo TV star, NYC luxury agent, household name) by more than 7x.
Three, 68% of the channels in our sample have fewer than 10,000 subscribers. Of 179 channels, 122 are under 10k; only 7 exceed 500k. Median subscriber count: 2,030. Yes — two thousand. That's an order of magnitude or two below where SaaS founder Twitter or tech-creator YouTube sits. Real-estate YouTube is genuinely micro-creator territory; the vast majority of agent channels are stuck at "made videos, no audience."
Four, tiny channels can still go viral — but not via subscribers. Roots Investment Community sits at 2,620 subs but pulled 9,971,343 views in 16 months. That's 3,805 views per subscriber. The only way you get that ratio is a Shorts-led channel — short videos pushed by the algorithm to users who never subscribed. YouTube's 2025-2026 era has decoupled reach from subscriber count, and small channels can break through if their content format fits the algorithm. "Real-estate-agent thought leadership" doesn't fit.
Stack those together and the data is telling one story: YouTube doesn't reward agent identity, it rewards creator-format content. Below, we walk through each layer.
1. Real estate YouTube is a long-tail market with a tiny head
Start with subscriber distribution. Of 179 channels: 122 are under 10k subs, 34 sit between 10k and 100k, 16 in 100k-500k. Only 1 reaches 500k-1M, and just 6 break a million. Structurally it's a winner-takes-most market — small head, thick middle, and a long tail that disappears below our floor.
| Sub range | Channels | Share |
|---|---|---|
| <10k | 122 | 68.2% |
| 10k-100k | 34 | 19.0% |
| 100k-500k | 16 | 8.9% |
| 500k-1M | 1 | 0.6% |
| >1M | 6 | 3.4% |
This shape isn't unique to real estate, but it's more extreme here than in most YouTube niches, for three layered reasons.
The surface reason is geography. A Bay Area agent's content is mostly useless to a viewer in LA, Denver, or Austin. YouTube can't do per-video local audience matching, so agents working a local funnel are bounded by the size of that local funnel. National compounding doesn't happen.
The middle reason is transaction frequency. A homebuyer buys a house every few years at most. They watch one or two "how to buy a home" videos and they're done — they don't return weekly the way they return for tech, finance, or entertainment. Low return-rate means slow subscriber compounding.
The deepest reason is the SEO long tail is already owned. Keywords like "real estate investing for beginners" or "how to buy your first home" — the SERP front pages have been camped on for a decade by BiggerPockets, Graham Stephan, and Meet Kevin. A new agent entering today can't out-compete these authority sites on Google search, no matter how good the video.
For an individual agent, the practical implication: don't treat YouTube as a primary lead-gen channel. A median real-estate channel doesn't generate enough views to support even one or two deals' worth of production cost. Use YouTube as a brand-building asset instead — the goal is for your already-known prospects to recognize your face when they Google [your city] real estate agent, not to convert strangers.
2. Same house, different framing — six times the views
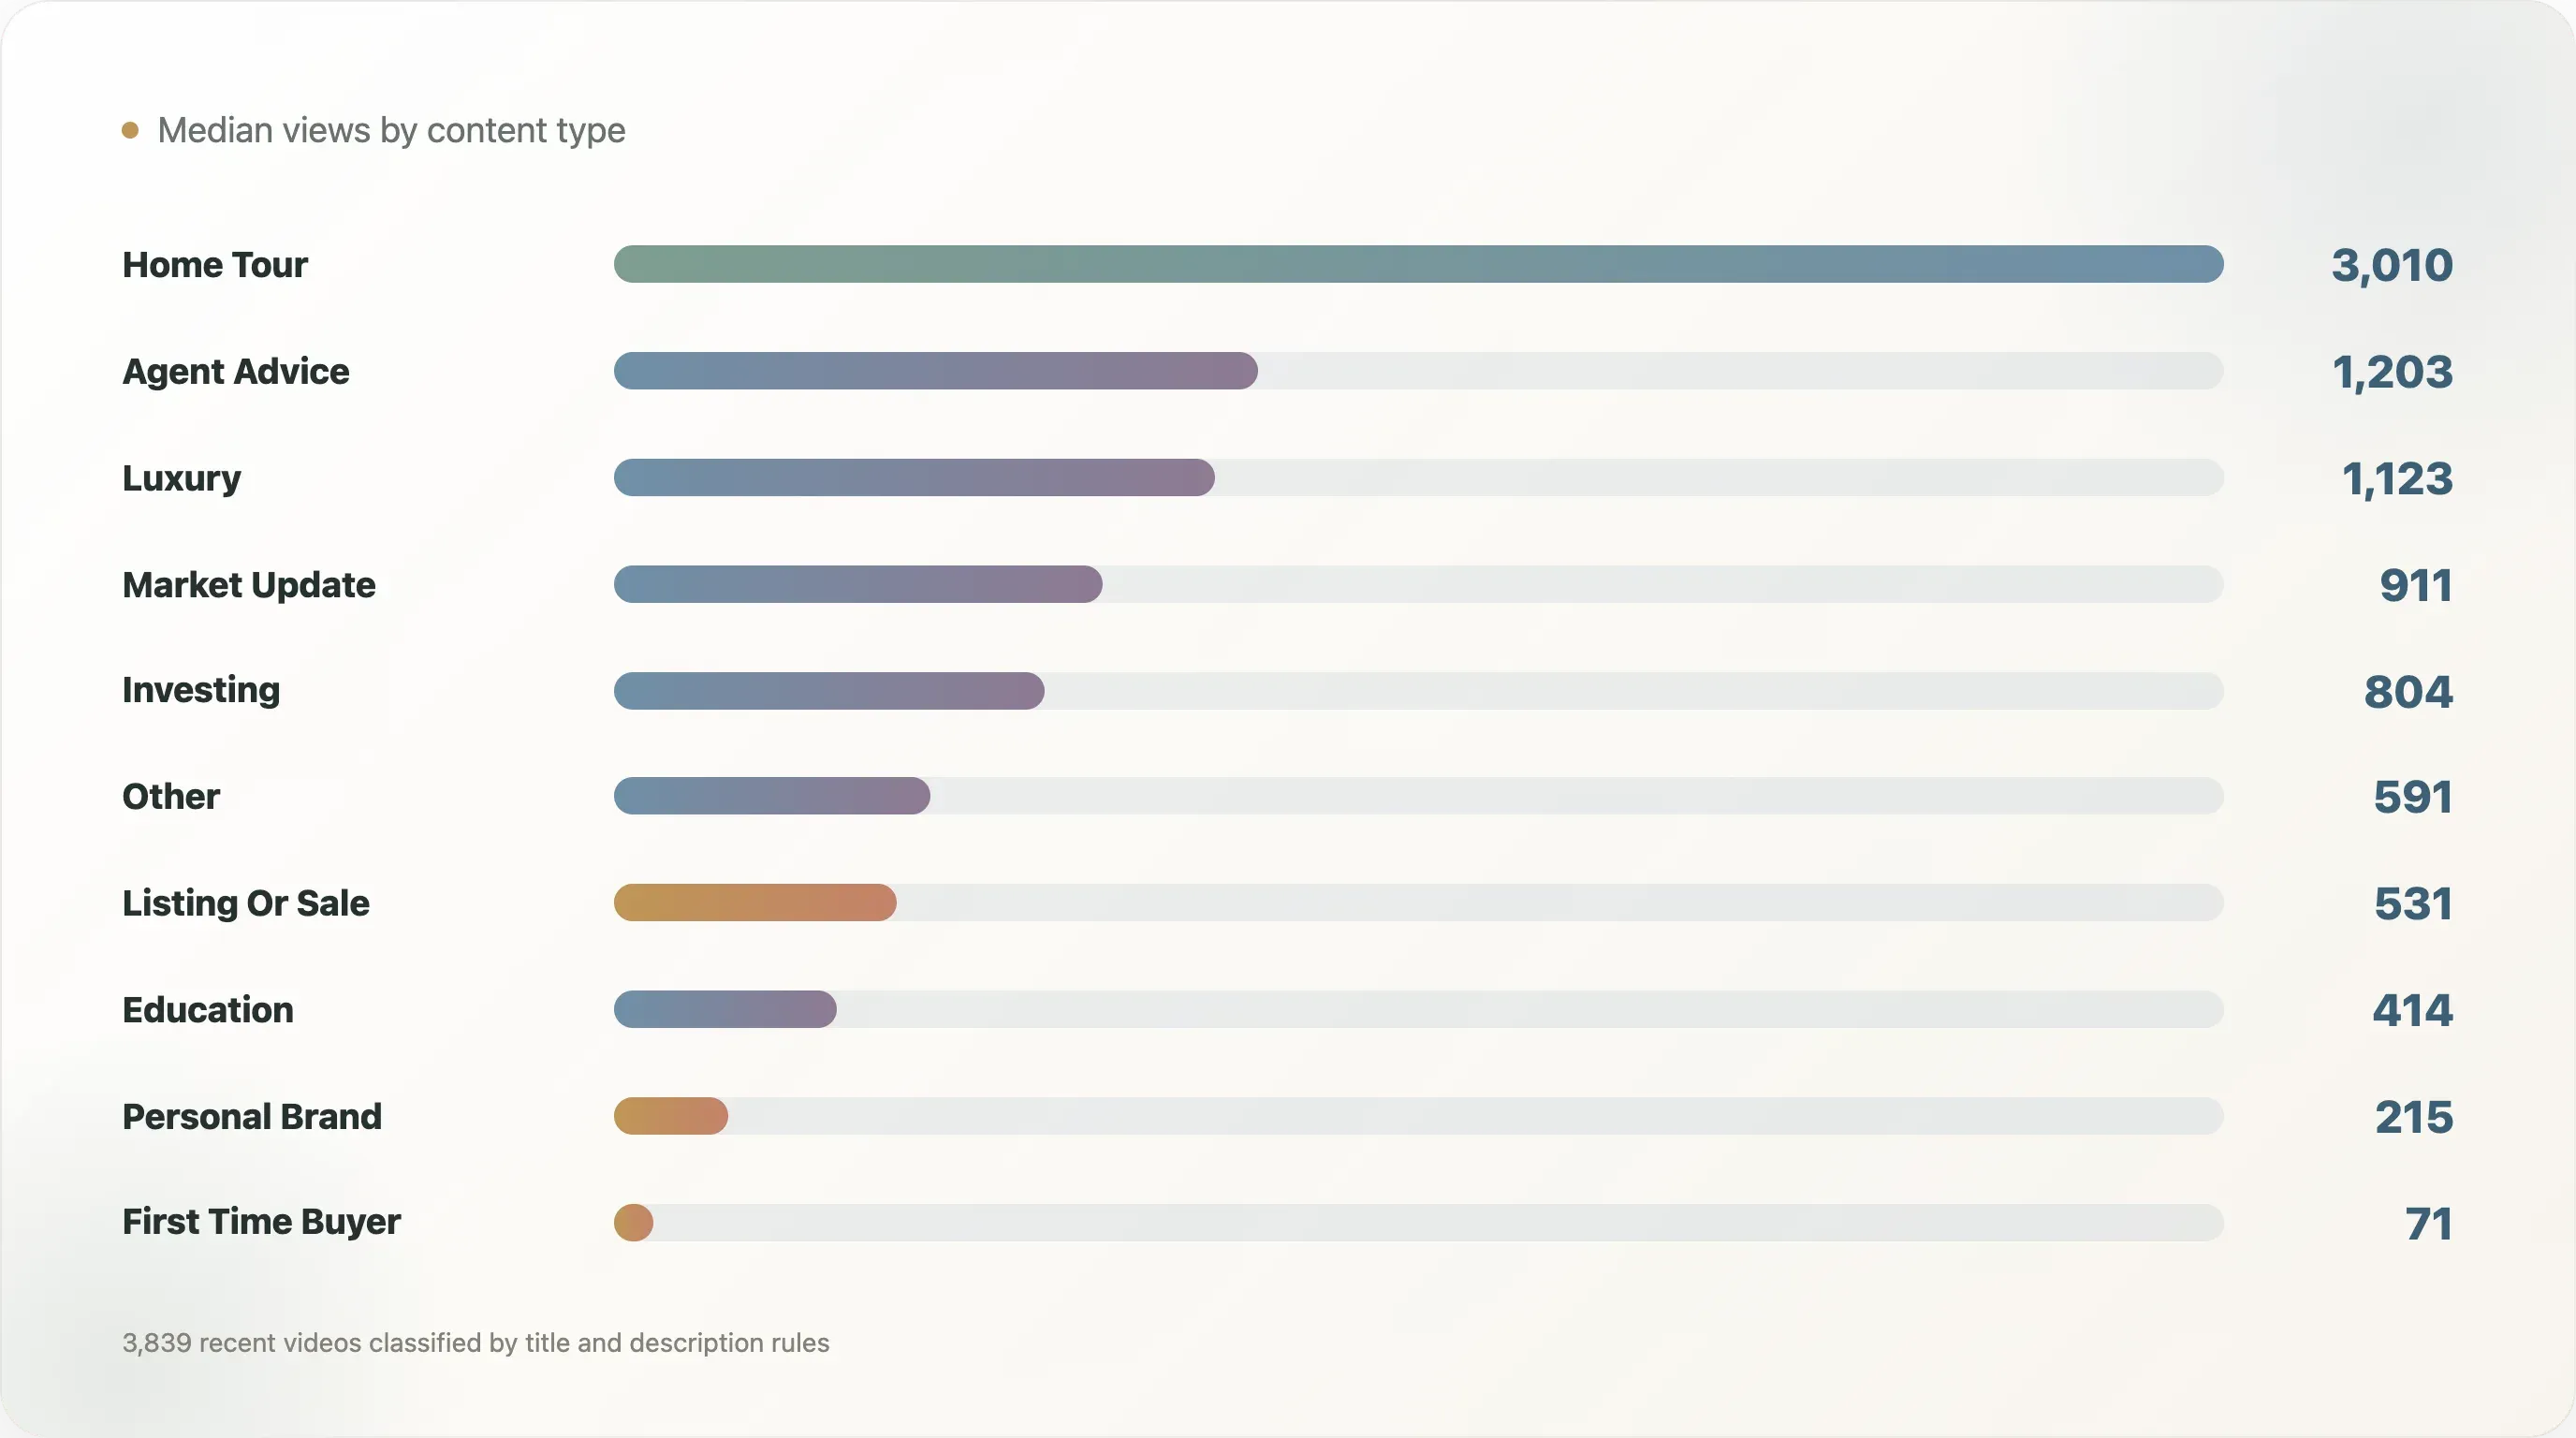
Bucketing all videos by content type via 9 regex rules over titles + descriptions, we get the table below. The most important column is median views — the number anyone making real-estate YouTube actually cares about.
| Content type | Videos | Share | Median views |
|---|---|---|---|
| Home Tour | 270 | 7.0% | 3,010 |
| Luxury | 595 | 15.5% | 1,123 |
| Agent Advice | 23 | 0.6% | 1,203 |
| Market Update | 624 | 16.3% | 911 |
| Investing | 166 | 4.3% | 804 |
| Education | 859 | 22.4% | 414 |
| Other | 995 | 25.9% | 591 |
| First Time Buyer | 62 | 1.6% | 71 |
| Listing Or Sale | 217 | 5.7% | 531 |
| Personal Brand | 28 | 0.7% | 215 |
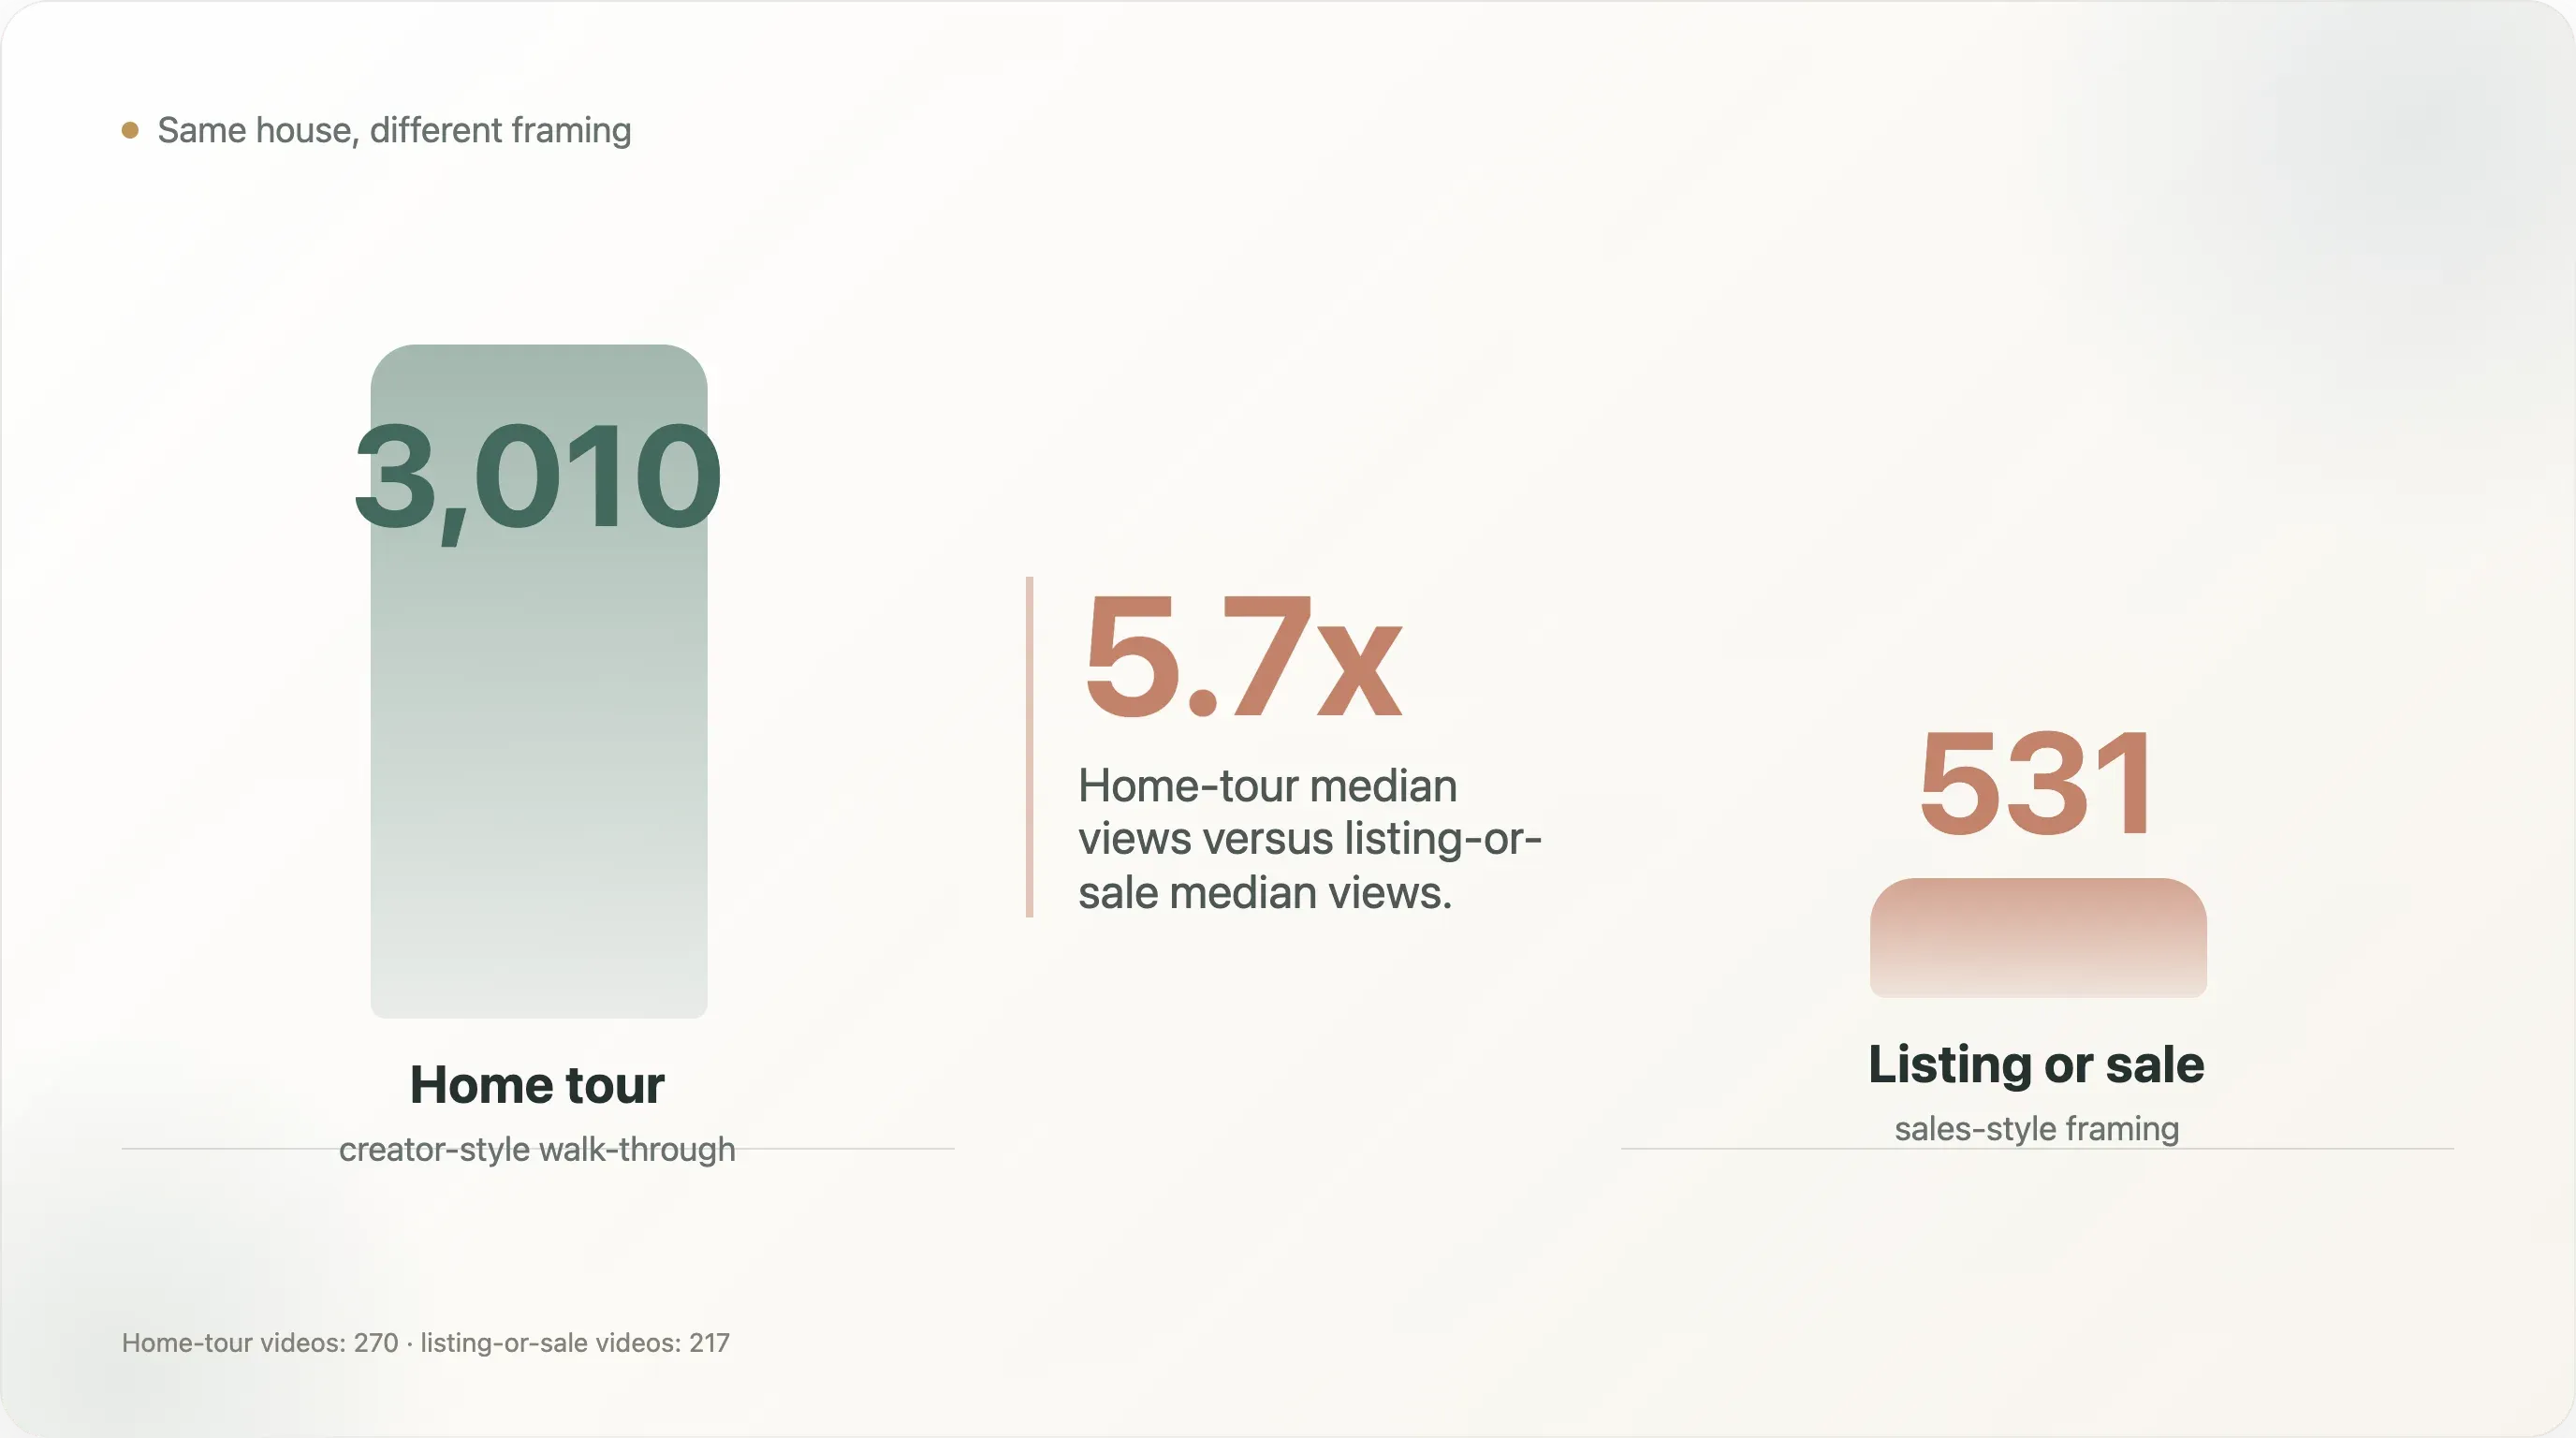
The starkest contrast: home tour vs listing/sale. Median home-tour views: 3,010. Median listing/sale views: 531. A 5.7x gap. These are essentially two ways to shoot the same house — "let me walk you through this property" versus "this house is on the market, contact me." The first is creator-style content; the second is sales-style content. The algorithm reads the second as an ad and crushes the recommendation.
The other striking number is first-time-buyer — median 71 views. The lowest of any category. Intuition says "new buyers have huge demand," but each new buyer is only "new" once. They watch two tutorial videos and graduate to actual listings. Supply is saturated, demand is transactional, and views never compound. It's a view-count graveyard.
Market update (median 911) and luxury (median 1,123) are the stable mid-traffic categories. Market updates are sticky because the market changes monthly and viewers come back monthly. Luxury has aspirational pull — viewers who'll never buy still want to look inside the mansion. Erik Van Conover's entire business is built on this single category.
One easy-to-miss number: agent-advice content sits at median 1,203 views with only 23 videos in our sample. Small data, but the median is 3x higher than education (414). This suggests "agent-to-agent content" is a supply-starved niche — if you're making real-estate content, this is a sub-category worth testing.
A few specific topic-selection conclusions fall out of this table. Luxury home tours are always worth making — high visual appeal plus reliable aspirational audience. Monthly market updates for your specific city are always worth making — sticky audience plus SEO long-tail capture. Educational long-form is worth making despite lower median views — the SEO compounds over time. But first-time-buyer tutorials and listing-as-content videos are not worth making — the first has saturated supply, the second is suppressed by the algorithm.
3. In the top 15, less than half are actual realtors
Ranked by recent 16-month cumulative views, the top 15 looks like this:
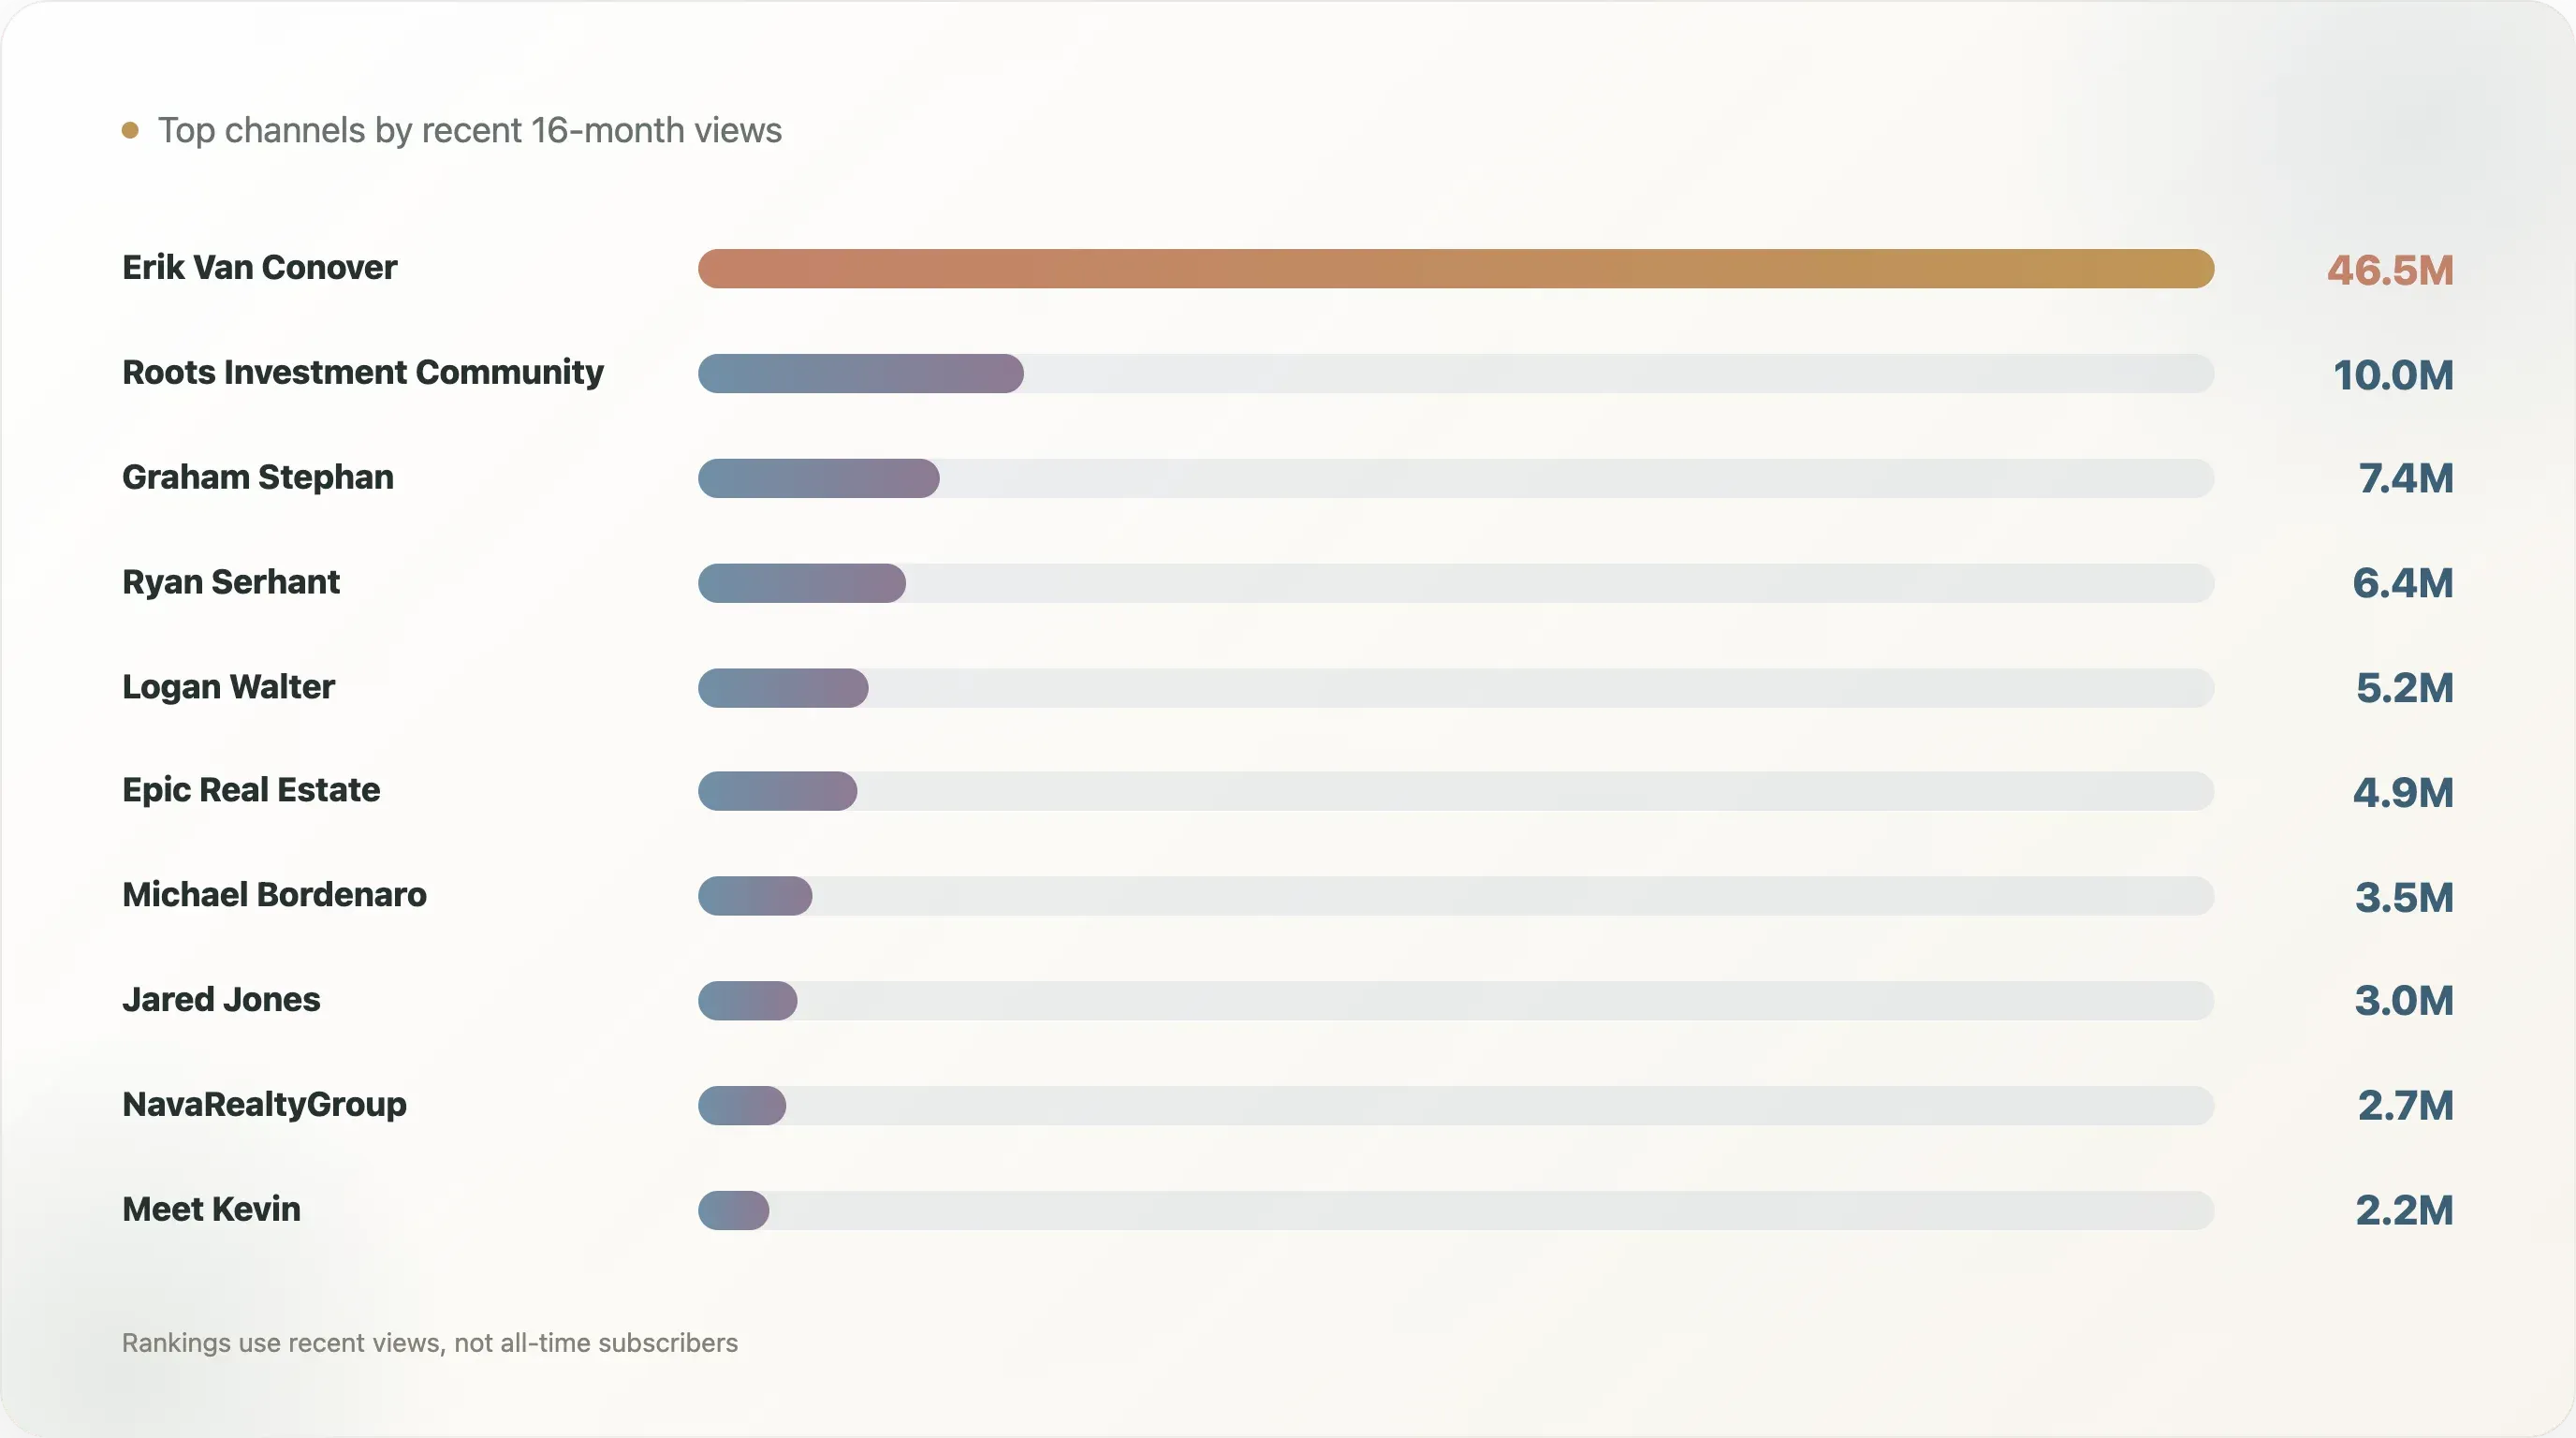
| Rank | Channel | Subs | 16-mo views | Avg/video |
|---|---|---|---|---|
| 1 | Erik Van Conover | 2.8M | 46.5M | 1.5M |
| 2 | Roots Investment Community | 2.6k | 10.0M | 554.0k |
| 3 | Graham Stephan | 5.2M | 7.4M | 248.1k |
| 4 | Ryan Serhant | 1.5M | 6.4M | 212.2k |
| 5 | Logan Walter - REALTOR | 60.6k | 5.2M | 172.9k |
| 6 | Epic Real Estate | 294.0k | 4.9M | 161.9k |
| 7 | Michael Bordenaro | 391.0k | 3.5M | 116.6k |
| 8 | Jared Jones | 54.8k | 3.0M | 99.7k |
| 9 | NavaRealtyGroup | 295.0k | 2.7M | 88.6k |
| 10 | Meet Kevin | 2.0M | 2.2M | 74.2k |
| 11 | Noelle Randall | 1.1M | 2.2M | 72.9k |
| 12 | Reventure Consulting | 677.0k | 1.7M | 57.4k |
| 13 | LA Realtor Tyler Neale | 11.3k | 1.5M | 50.5k |
| 14 | JP - Mansion Tours | 169.0k | 1.3M | 162.7k |
| 15 | Luxury Houses - American Homes | 241.0k | 1.3M | 42.5k |
Erik Van Conover alone pulled 46.5M views in 16 months — 4.7x the #2 channel. Watch one of his videos and the format is unmistakable: suit, mansion, slow-motion, narration with rhythm, production value closer to a cable TV show than a phone-recorded agent vlog. He holds a license, but his business is YouTube ads + brand deals, not commissions. Including him in a sample of "real-estate agent YouTube creators" is a bit of a stretch — he's closer to a real-estate-content TV host whose platform happens to be YouTube.
Roots Investment Community is the other outlier. 2,620 subs, 9.97M views over 16 months. That's 3,805 views per subscriber — a ratio almost exclusively seen on Shorts-led channels where short videos get algorithmically pushed to people who never subscribed. Low subscriber count no longer implies low traffic. This is the new YouTube era.
Graham Stephan looks larger than Erik on paper (5.16M subs vs 2.81M), but his recent 16-month views are 1/6 of Erik's. Read together, this means Graham has aged past his viral-growth phase and his current views come mostly from returning subscribers; Erik is still in algorithmic push mode. Subscribers are "capital accumulated over years"; recent views are "current body temperature." The first looks impressive; the second tells you what's actually happening now.
Ryan Serhant is the ceiling for the "actual realtor with maximum public profile" archetype. Bravo TV star (Million Dollar Listing NY), founder of SERHANT, leading NYC luxury agent. His brand resources dwarf any normal realtor. And yet his recent 16-month views are 6.36M — about 1/7 of Erik Van Conover's. This is probably the single most informative datapoint in this report: even the most resource-rich realtor on YouTube has a much lower views ceiling than a pure-creator-format real-estate content person.
The median channel in this set is something like Logan Walter — 60,600 subscribers, 5.19M views over 16 months, ~250k average per video. This is a doing-it-right mid-tail agent: consistent posting cadence, home-tour-adjacent content format, local but high output volume. If you're looking for benchmarks, don't use Ryan Serhant (likely unreachable); use Logan Walter (realistically achievable in 12-24 months).
4. Every viral video is a walk-through
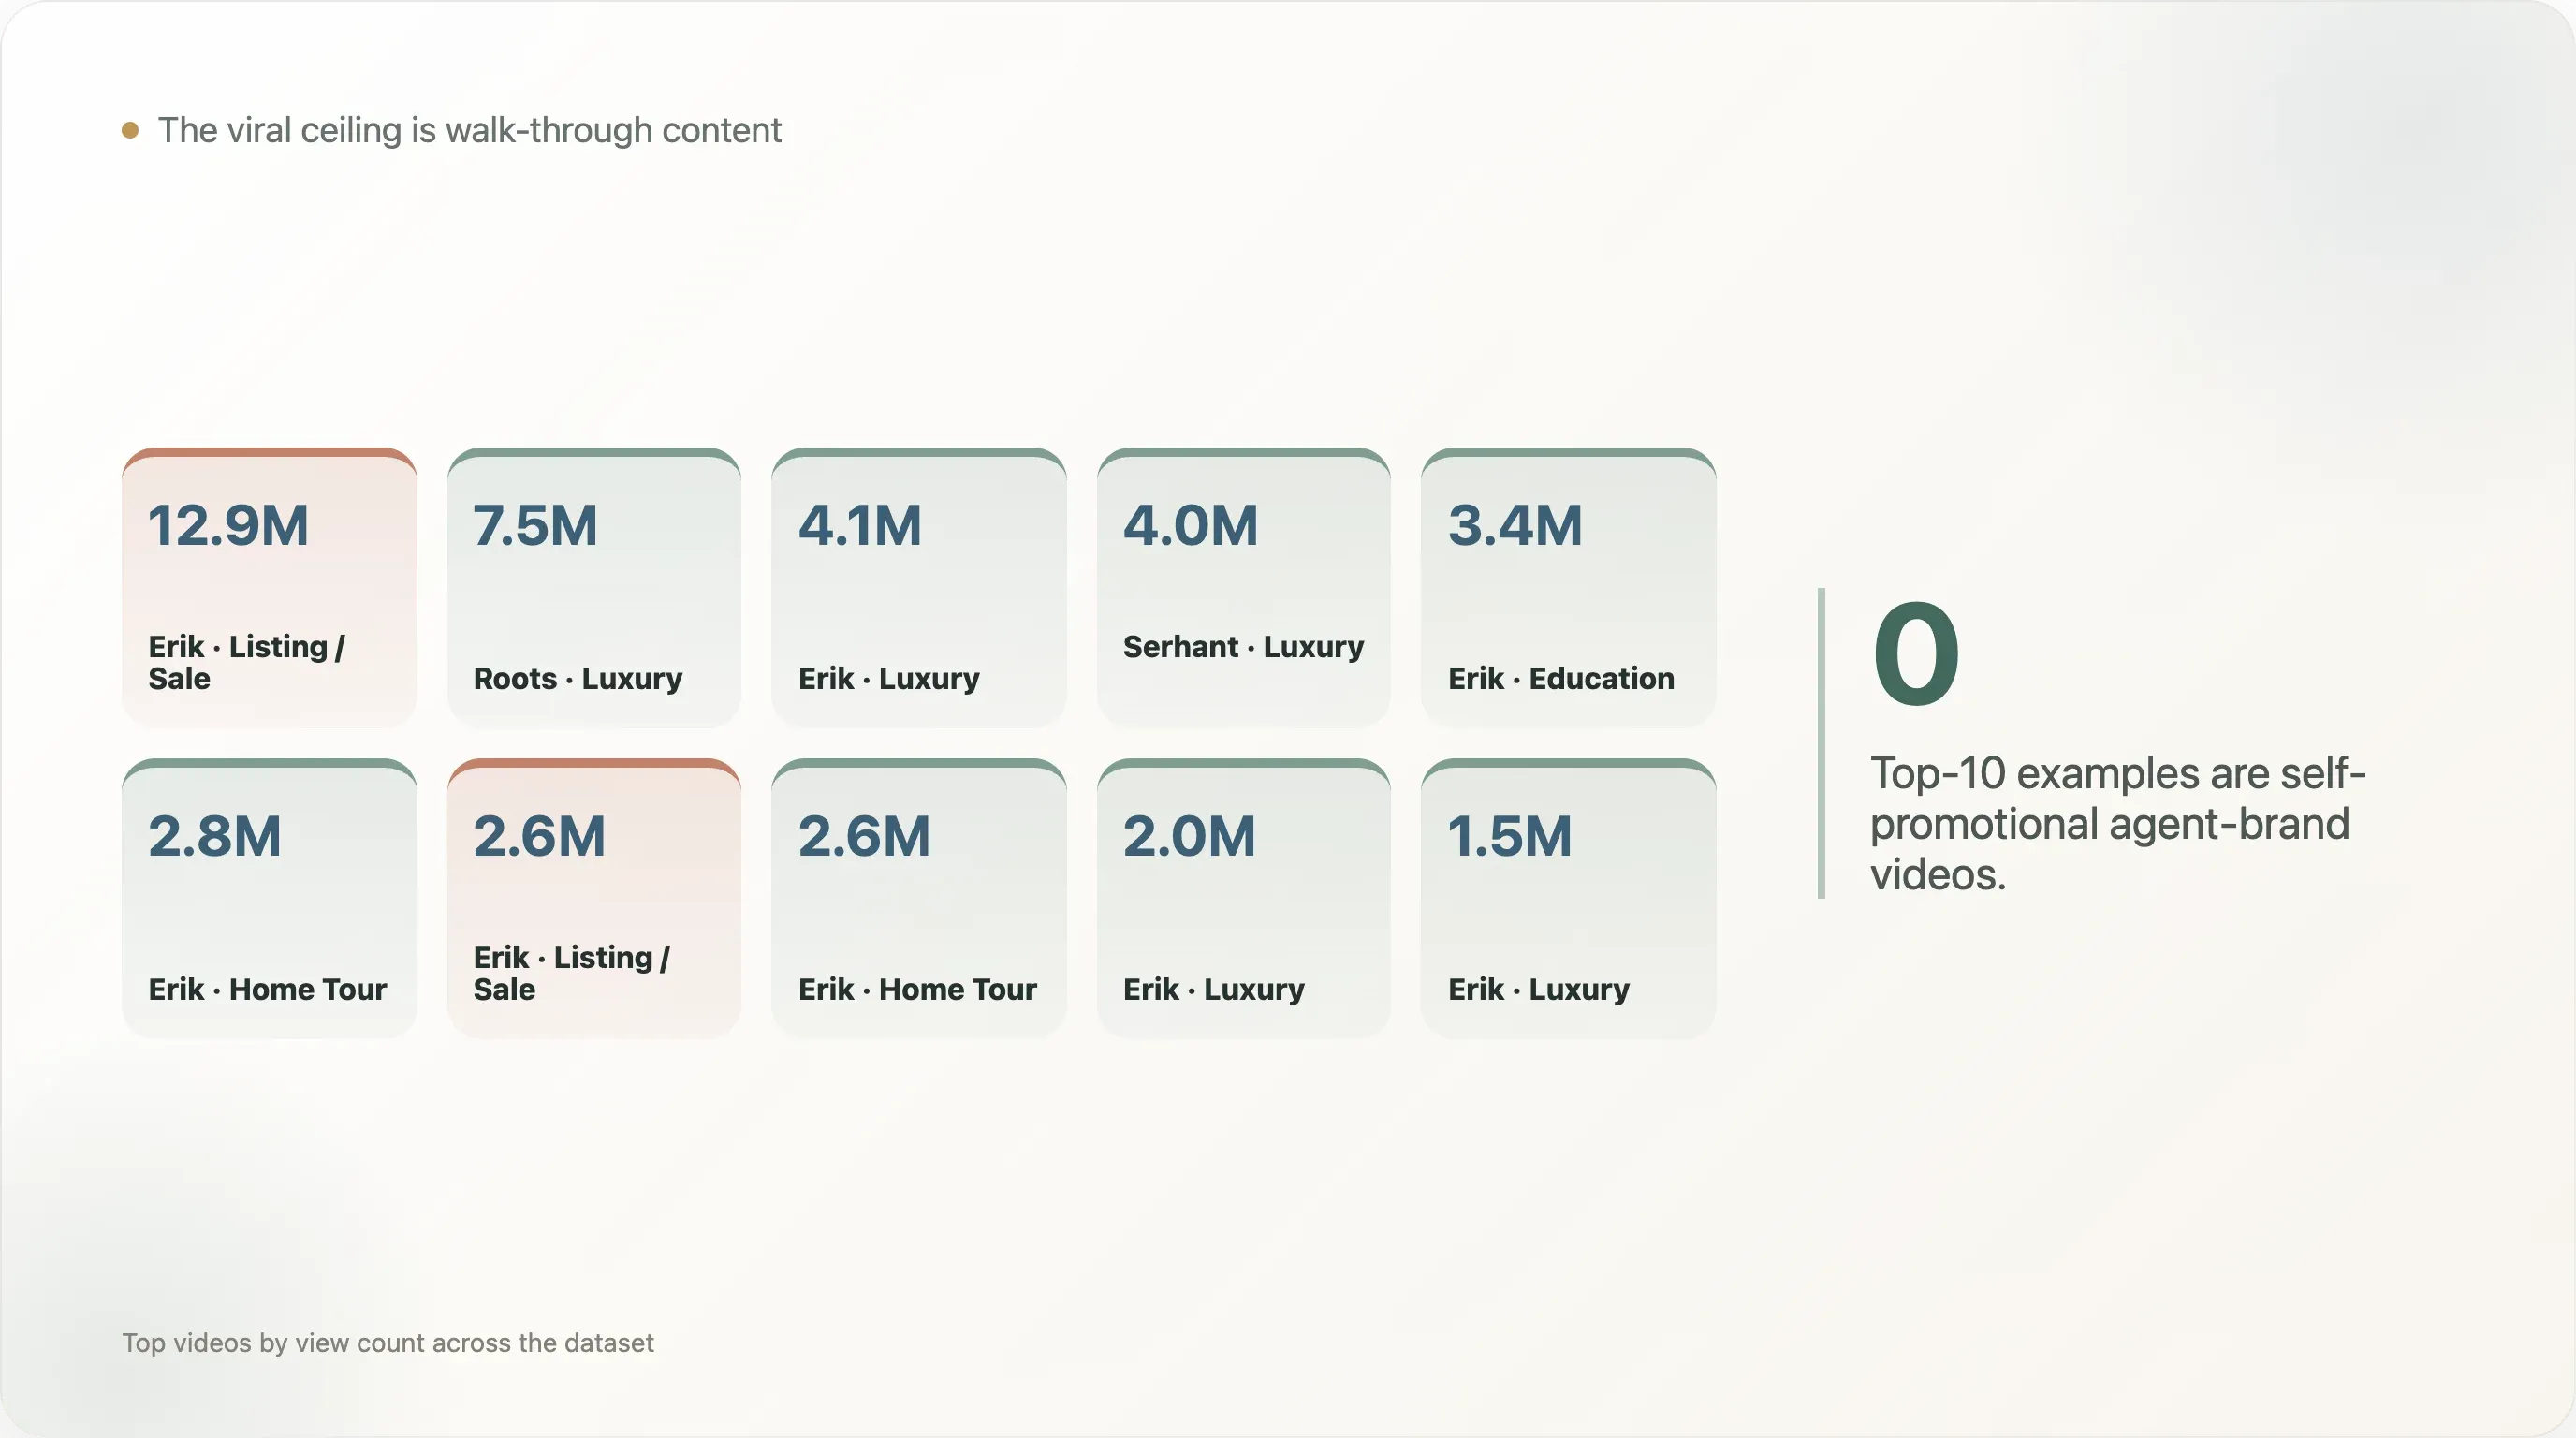
Sorting all videos in the dataset by view count, the top 10 are:
| Rank | Views | Channel | Type |
|---|---|---|---|
| 1 | 12.9M | Erik Van Conover | Listing Or Sale |
| 2 | 7.5M | Roots Investment Community | Luxury |
| 3 | 4.1M | Erik Van Conover | Luxury |
| 4 | 4.0M | Ryan Serhant | Luxury |
| 5 | 3.4M | Erik Van Conover | Education |
| 6 | 2.8M | Erik Van Conover | Home Tour |
| 7 | 2.6M | Erik Van Conover | Listing Or Sale |
| 8 | 2.6M | Erik Van Conover | Home Tour |
| 9 | 2.0M | Erik Van Conover | Luxury |
| 10 | 1.5M | Erik Van Conover | Luxury |
The top 5 are all home-tour or luxury content. Erik Van Conover occupies 5 of the top 10 slots. Notably absent: any video of the form "I helped my client find their dream home," "my real-estate success tips," or "why I switched brokerages." Self-promotional content has no viral cases in this data. Across 4,431 videos, the entire top of the distribution follows the same pattern.
Viewers searching real-estate content on YouTube want to see "what's inside this house," not "what you can offer me as a client." If you want a single video to break 100k views, move the camera off yourself and into the property. That one posture change explains a meaningful share of the views gap.
5. Posting cadence: 3-5 videos a month is the median
The median channel posts 7.4 videos per month. This is roughly YouTube's "still alive" threshold; drop below and the algorithm gradually deprioritizes the channel, compressing reach.
The highest-cadence channels (15+ videos/month) typically fall into three patterns: daily market-news channels, Shorts-heavy low-cost short-form channels, or brand-matrix channels with a team behind them (not a solo realtor). A solo agent trying to hit that cadence alone is not realistic.
If you're a solo agent doing YouTube, there are two viable paths: pick one, don't go middle-of-the-road.
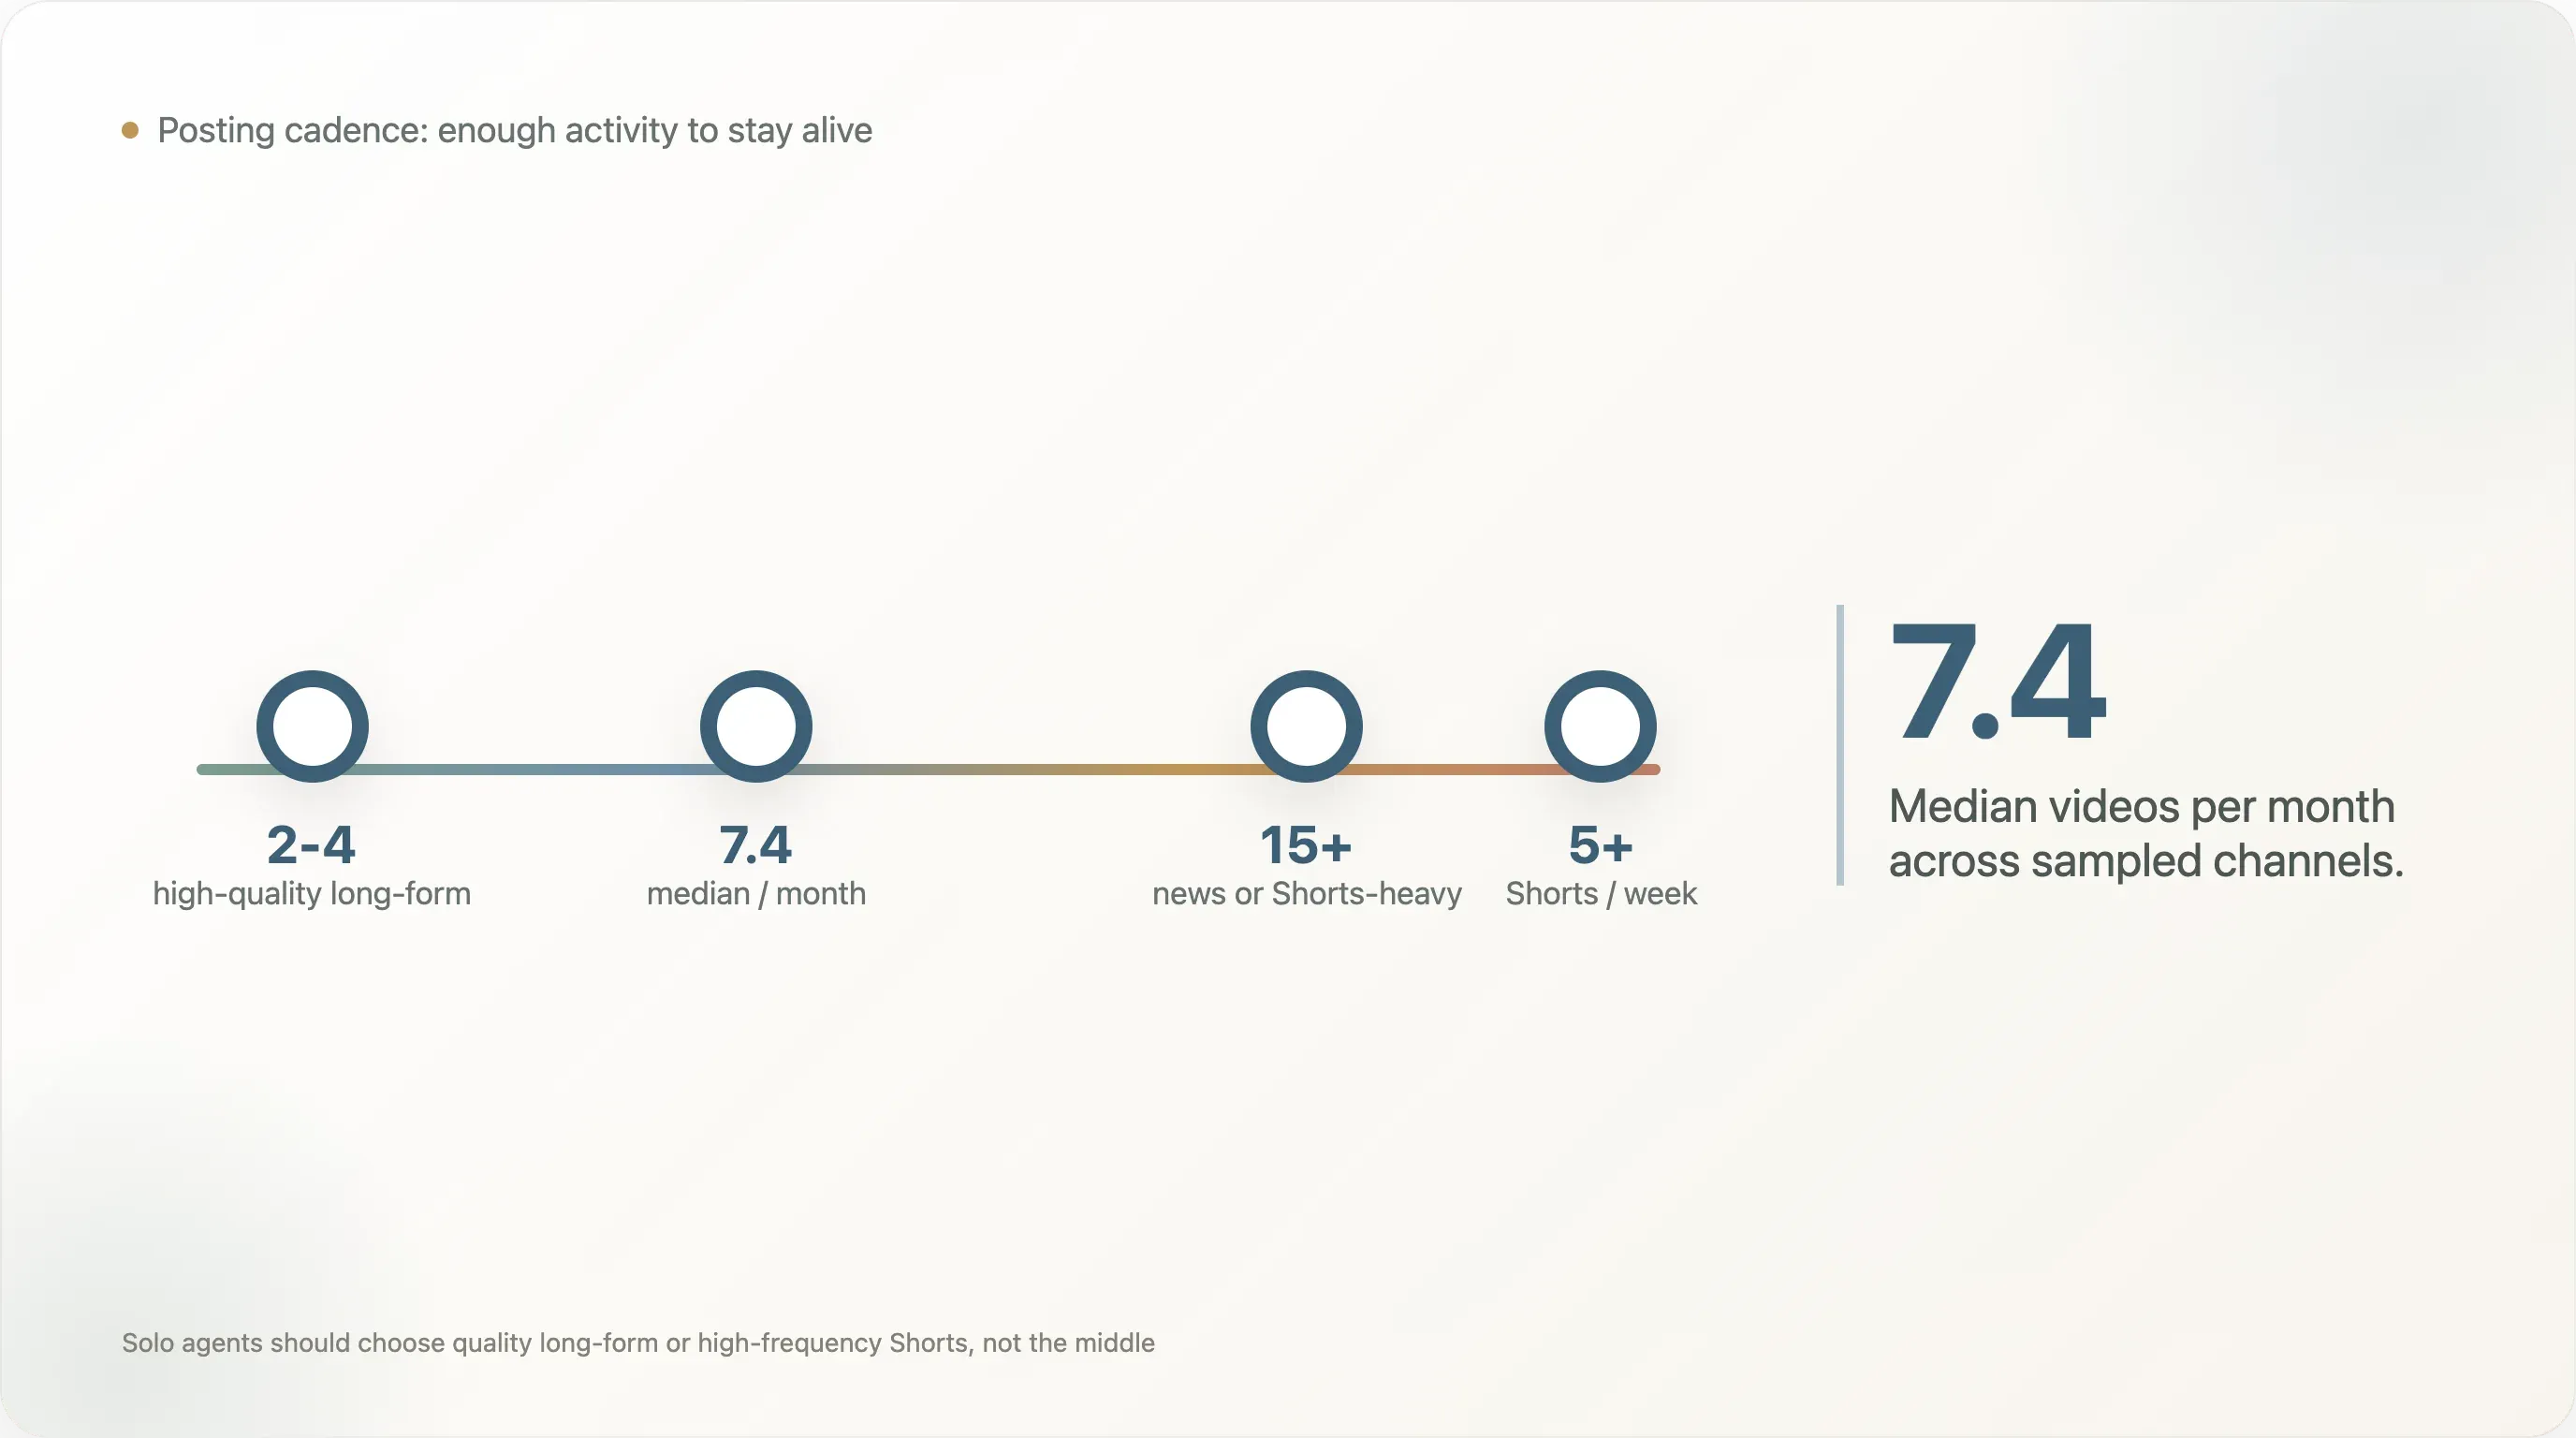
First path: low-frequency high-quality — 2 to 4 long-form videos per month, each with production quality approaching Erik Van Conover (locked camera, real microphone, edited rhythm, designed thumbnail, SEO metadata). Production cost roughly $300-800 per video, freelance editor hired per video. Second path: high-frequency Shorts — 5+ 30-to-60-second clips per week, cut from your daily work rather than shot (clips from showings, snippets of client conversations, hot takes on market news). Shorts have low direct ad revenue; they function as top-of-funnel feeders for the main channel.
"One unedited phone-selfie video per month" is the stable losing posture. It misses the algorithmic activity threshold and fails the viewer's visual-quality threshold. Better not to make it at all.
6. Each category has its own "correct" length
Median video duration by content category:
| Type | Median sec | Min:sec |
|---|---|---|
| Home Tour | 788 | 13:08 |
| Luxury | 321 | 5:21 |
| Market Update | 958 | 15:58 |
| Education | 503 | 8:23 |
| Investing | 142 | 2:22 |
| First Time Buyer | 72 | 1:12 |
| Listing Or Sale | 184 | 3:04 |
| Agent Advice | 455 | 7:35 |
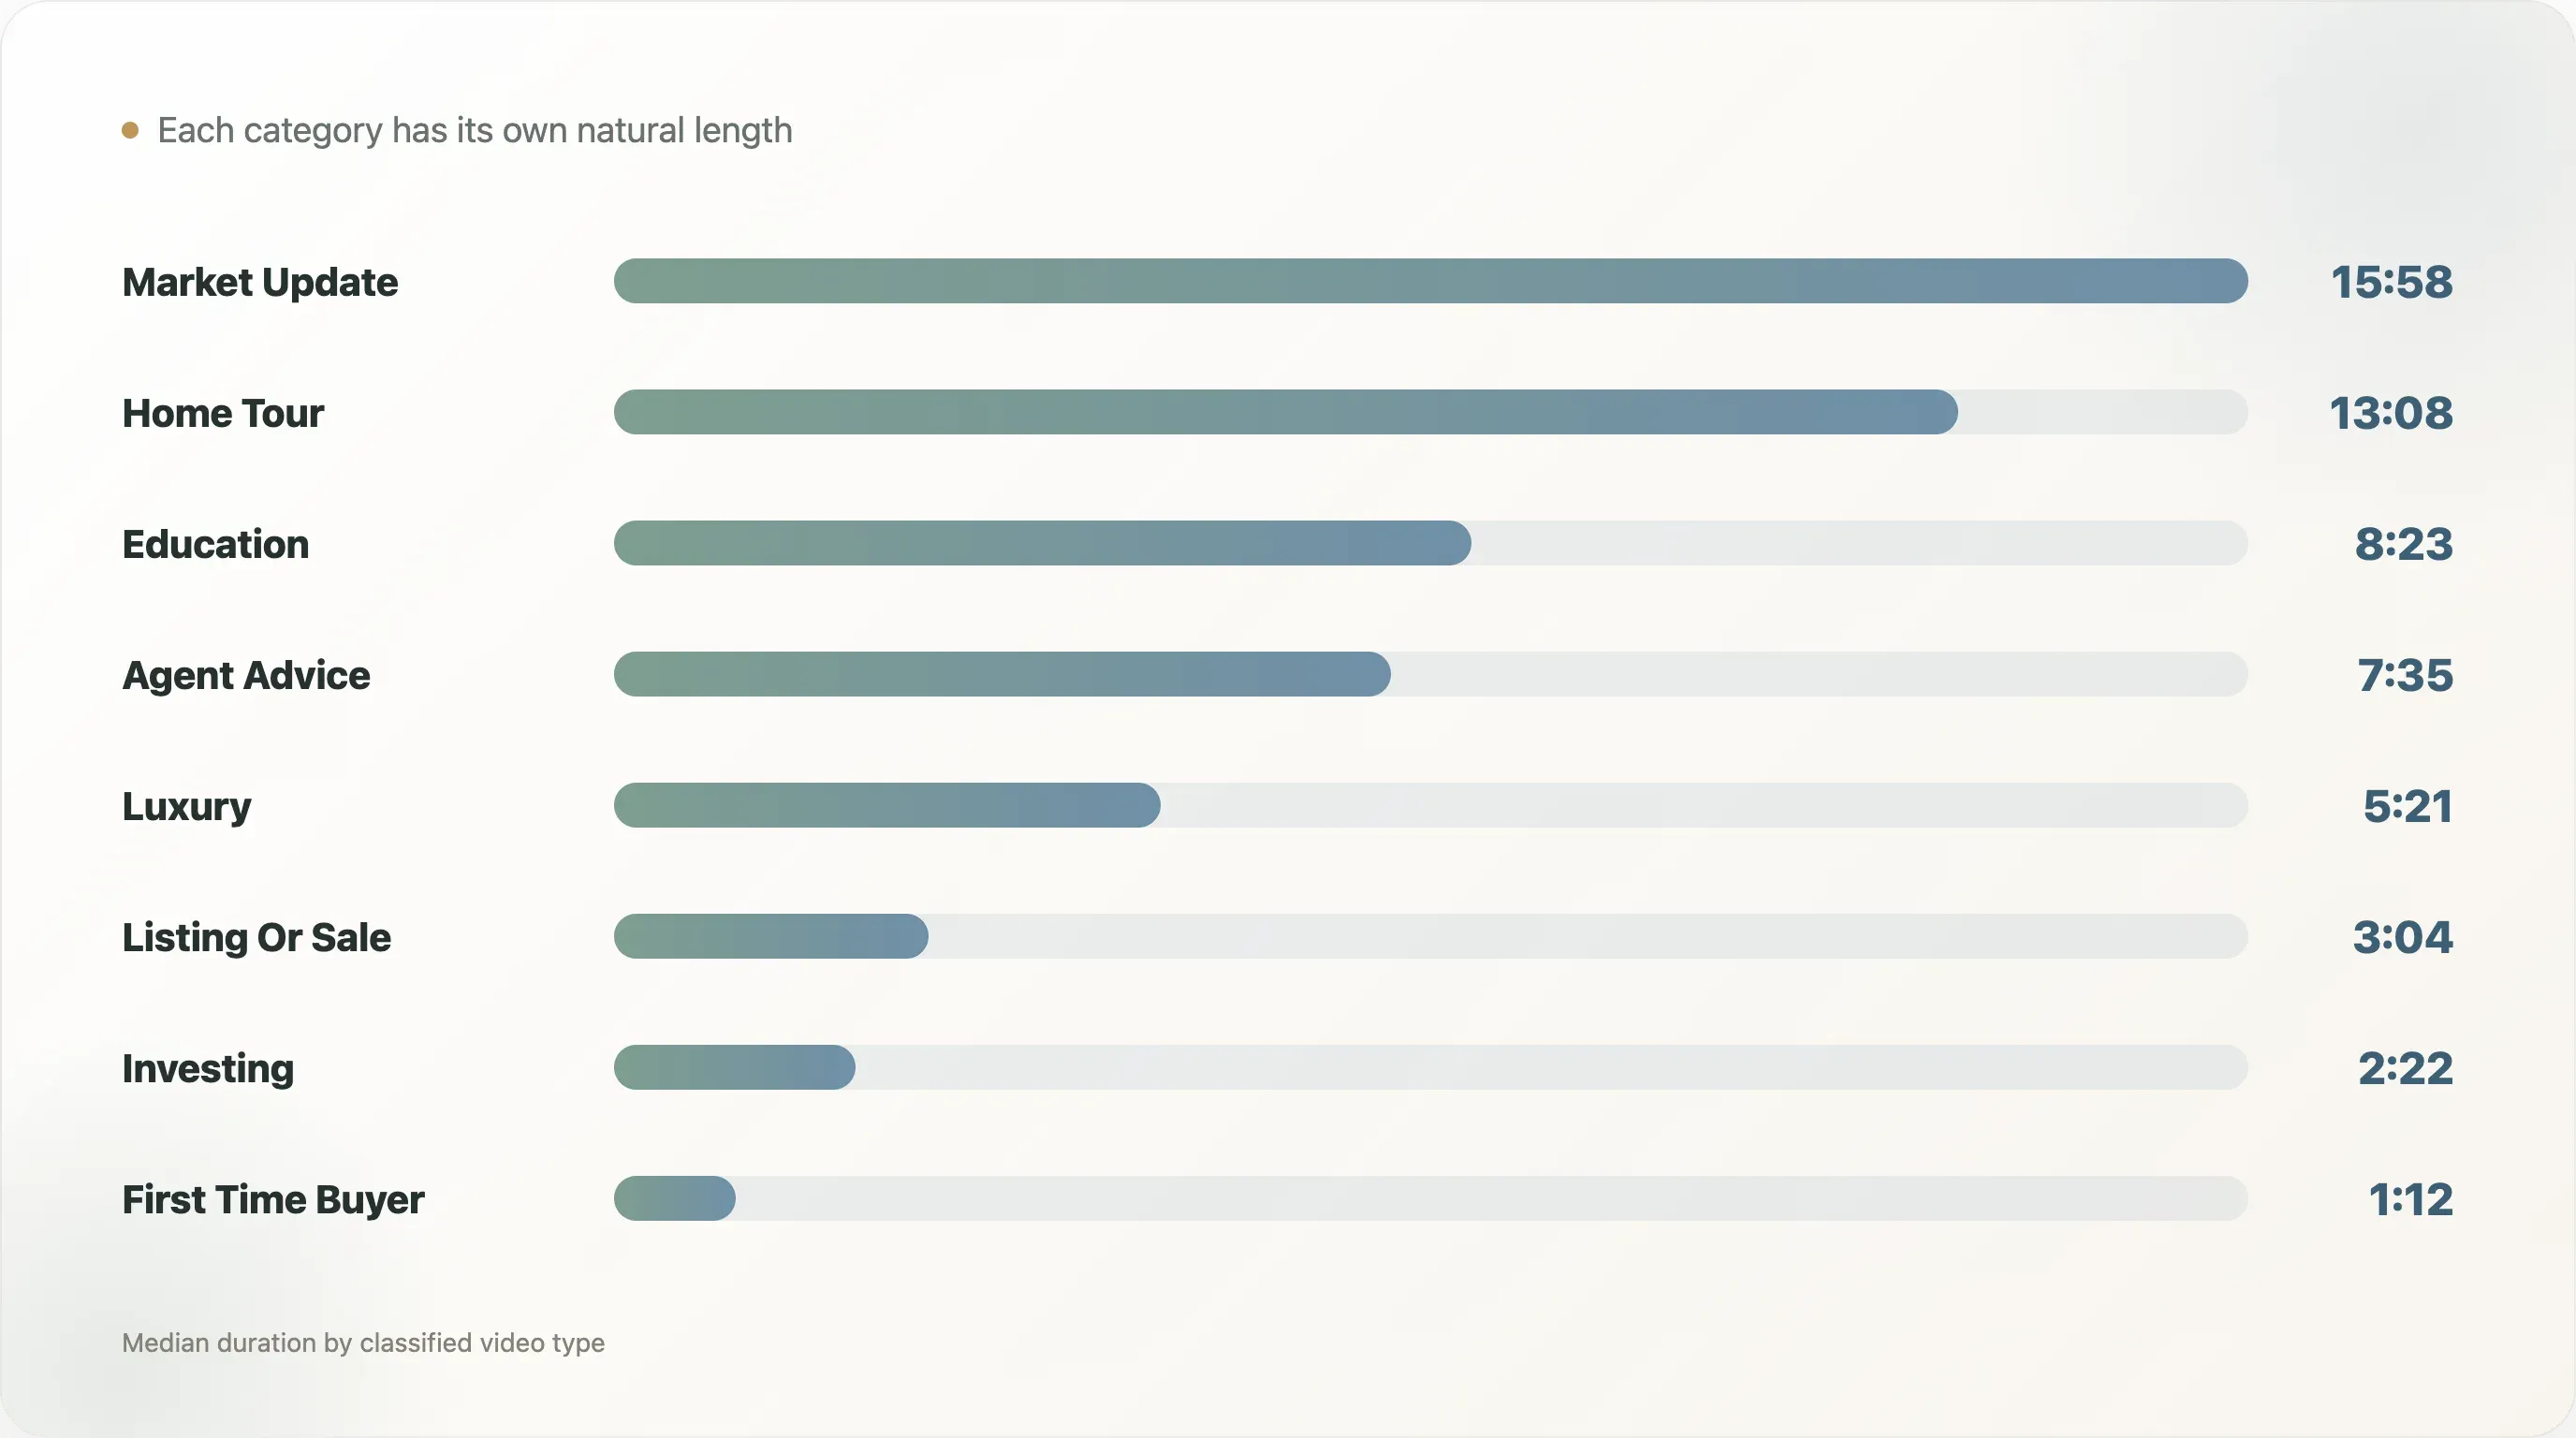
Home-tour videos run 5-10 minutes median — viewers expect a thorough walk-through, and shortening loses content value. Market updates and education sit at 8-15 minutes, matching the rhythm of a podcast episode, comfortable as headphone-listening. Below 3 minutes registers as "unfinished" in real-estate context — unless the video is a Shorts (<60 sec) playing the entirely different algorithm game. Within each category, deviating from median by more than 30% visibly drops views.
7. What to actually do — for agents, content people, and SEO services
Synthesizing the data, here's what's reasonably clear for agents, content operators, and service providers.
On topic selection, three categories are worth long-term investment: luxury home tours (median 1,123 views, stable brand asset), monthly city-specific market updates (median 911 views, sticky audience, SEO long-tail), and agent-to-agent advice (median 1,203 views, supply-starved niche). Two categories should be skipped outright: first-time-buyer tutorials and listing-as-content videos. These are classic "intuitive but data-disconfirming" traps.
On minimum quality: locked camera position, 1080p or higher, a real lavalier mic (not phone built-in), at least 30 cuts per video, thumbnail with face + large title + high contrast. Below this floor, view counts cluster under 200 regardless of effort. This isn't a vanity preference — YouTube's algorithm directly reads click-through-rate and watch-time signals, and low-quality production trips both, killing distribution before viewers even have a chance to like the content.
On goals: treat YouTube as a brand-building tool, not a lead-gen engine. The scenario where a stranger watches your video and contacts you to buy a house happens about 5% of the time — 95% of viewers don't live in your city. The realistic conversion path: someone you already know Googles "[your city] real estate agent," finds your channel, decides "this person knows the market," picks you over a competitor. That path only requires "competent local agent," not virality.
Minimum viable cadence for a solo agent: 2 videos per month (1 city market update + 1 local home tour), production cost $200-400 per video (freelance editor on per-video basis), run for 12 months, review at the 12-month mark. Don't quit if you don't see views at 6 months — real-estate YouTube is slow burn; the viral lottery is a near-zero probability, but SEO compounding shows up around the 18-24 month mark.
For SEO / content-service agencies, the offer that fits is content production: editing, thumbnails, SEO metadata (you can even generate tags for your YouTube videos in seconds), cross-platform distribution (cutting long YouTube videos into Reels / Shorts / TikTok short clips). There's real demand here — agents typically don't have the time or skill. One critical caveat: do not promise to get a client's channel to a million subscribers. The data in this report shows that 99% of agent channels never get there; promising it sets clients up for disappointment. Position the offer as brand-asset building, not lead generation. Expectations stay realistic, retention stays high.
Cross-platform distribution is underused. Erik Van Conover, Ryan Serhant, and most other top creators repurpose every long video into Instagram Reels, TikTok, and LinkedIn variants. For a solo agent, a reasonable cascade is "1 YouTube long-form + 5 short-form clips across platforms + 1 LinkedIn post" — seven content assets from a single shoot. Two long videos per month becomes fourteen cross-platform assets per month.
8. How stable is this data, and where does it stop being valid
179 channels, 30 recent videos each, filtered to publishedAt ≥ 2024-01-01, totaling 3,839 videos. All numbers come directly from the YouTube Data API v3's public counts (views/likes/comments) — no scraping, no estimation. Content classification uses 9 regex rules on title + description, leaving a 26% "Other" bucket — the cost of choosing rules over LLM classification for the sake of transparency and reproducibility.
The channel pool is sourced from 30 seed handles plus 9 keyword expansions, not a census of all US real-estate YouTube. Micro-channels (<500 subs) don't return in search.list results, so "68% under 10k subs" represents the head-to-middle distribution; the genuine long-tail is longer than what we can see.
View counts include Shorts. YouTube's viewCount field aggregates long-form and Shorts. Shorts have far lower engagement per view, but the API doesn't split them. Roots Investment's "2,620 subs / 9.97M views" is the obvious Shorts-led case — strip out long-form only and the view-to-sub ratio normalizes. We didn't split, which is a known limitation.
Cross-referencing external sources: SocialBlade's public Top Real Estate channel rankings overlap with our Top 15 at roughly 85% — the head is broadly consistent. NAR's Home Buyer profile says 89% of US homebuyers use online information during their search, YouTube being one part but not the dominant share. None of our findings contradict these external numbers; together they say real-estate YouTube is a winner-takes-most distribution with a small head and a long tail.
One-line boundary: this report describes what happens inside our 179 sampled US real-estate-adjacent YouTube channels, not what all US realtors do on social media. Most realtors aren't on YouTube; they're on Instagram and TikTok. If you want to know how Instagram real-estate works, this report doesn't apply.
Methodology
Data source: YouTube Data API v3 (Google's official API — fully compliant access). Seed list of 30 known US real-estate / investing YouTube creators, plus 9 search-query expansions. The final channel pool filter is country=US OR description/title contains real-estate keywords; seed channels retained unfiltered. Each channel: most-recent 30 videos, restricted to published ≥2024-01-01 (a 16-month window). Snapshot date 2026-05-12 (UTC).
"Real-estate YouTube creators" is a fuzzy definition. Our 179 channels include pure realtors (Ryan Serhant), content creators (Erik Van Conover), investing educators (Meet Kevin, Graham Stephan), and vertical media (BiggerPockets). Strictly, this is "real-estate-adjacent creators," not "realtors." channel_pool.csv preserves a source field for disambiguation. If you cite this report to claim "how realtors do YouTube," please re-classify at the channel level — direct citation will introduce bias.
The channel pool is not a census. The 179 channels come from seed + search expansion, not the full universe of US real-estate YouTube. Micro-channels (<500 subs) don't surface in search.list results, so "68% under 10k subs" reflects head-to-middle distribution, not the full long tail.
View counts include Shorts. The YouTube viewCount field aggregates long-form and Shorts. Shorts have lower engagement per view, but the API doesn't differentiate. Roots Investment's "2,620 subs / 9.97M views" is a clear Shorts-led case; if you split out long-form alone, view-to-sub ratios normalize. We didn't split, which is a documented limitation.
Content classification is rules, not LLM. 9 categories via regex on title + description. The 26% "Other" bucket reflects incomplete rule coverage. If you cite "educational content makes up X%," please mark it as "by this report's classifier," not as an absolute claim.
Channel rankings use recent 16-month cumulative views, which biases toward recently-viral channels. Swapping to all-time totals or subscriber count changes the rankings. We chose the 16-month window because it reflects "which channels are currently moving," not historical accumulation.
Data is a 2026-05-12 snapshot. YouTube data changes daily; in 3 months, view counts will move, but channel rank and content-type median views stay structurally stable. For current numbers, rerun the reproducibility scripts.
Legal and copyright: YouTube Data API v3 is Google's public API; this report's access is fully compliant. The report uses aggregate statistics + channel names only — no video downloads, thumbnails, or full descriptions. Named channels (Top 15, Top 10 videos) appear in positive or neutral context only — their view counts are public facts. No raw video data or thumbnails are published; every number can be re-derived from the YouTube API directly.
Caveats
What this report does NOT support:
- Not "all US realtors do YouTube" — this sample is already-active YouTube creators in real-estate-adjacent niches; most realtors don't make YouTube content
- Not "first-time-buyer content is dead" — median 71 views is a fact about this sample; specialized small channels in that niche can still succeed
- Not "Erik Van Conover represents the ceiling" — he's an outlier, not a typical case
- Defensible: "Across our 179-channel sample of US real-estate-adjacent YouTube, home-tour videos pull a median of 5.7x the views of listing/sale videos"
Data source & versioning
Dataset: us_realtor_youtube_atlas_2026/ (this repo). Snapshot date 2026-05-12 UTC, version v1.0 (2024-2026 cross-section). YouTube Data API public access, aggregate statistics under fair use. Total API quota consumed: ~1,500 units (15% of the free 10,000/day allowance).
What SEO and Content Teams Can Cite
This research creates several citation angles for blog intros, data callouts, social posts, comparison pages, and follow-up explainers:
- The sample covers 179 channels and 3,839 recent videos.
- Median channel subscriber count is 2,030.
- 122 of 179 channels, or 68.2%, have fewer than 10,000 subscribers.
- Home-tour videos have a median of 3,010 views.
- Listing-or-sale videos have a median of 531 views, about 5.7x lower than home tours.
- Luxury content accounts for 15.5% of videos but 33.8% of views.
- The median posting cadence is 7.4 videos per month.
The caveat should travel with the citation. These numbers describe the specific sample and collection method used in this report. They should not be reframed as a full-market census, an internal adoption measure, or a claim about every company in the category.
For editorial use, the strongest framing is the one that pairs the headline statistic with the sample boundary. That makes the claim more durable and easier for readers to trust. For example, write "in this HN hiring sample," "in this DTC home-page static scan," or "across this YouTube channel sample" before turning the number into a broader trend discussion.
Reproducibility Notes
The delivery folder includes the following process files copied from the original local report packages. These are included so the published report can be checked against the actual scripts, intermediate outputs, charts, and source drafts used in the reporting workflow.
process_files/out/analysis_stats.jsonprocess_files/out/channel_pool.csvprocess_files/out/videos.csvprocess_files/scripts/00_build_channel_pool.pyprocess_files/scripts/00b_patch_uploads_id.pyprocess_files/scripts/01_fetch_recent_videos.pyprocess_files/scripts/02_compute_stats.pyprocess_files/scripts/03_make_figs.pyprocess_files/scripts/04_build_report_bilingual.pyprocess_files/scripts/05_module_i_check.py
Download all scripts and datasets
Methodology corrections, dataset issues, and follow-up analyses are welcome at support@thunderbit.com. This report is based on public web or public API signals collected in May 2026 and should be read with the sample boundaries stated above.
Try AI Web Scraper for Data Research Get Started Free