What We Wanted to Know
The DTC ecosystem has two contradictory pictures of YouTube as a channel.
The older picture, from the 2018-2022 era of DTC operator playbooks, says YouTube is the long-form high-trust channel. Beardbrand and Ezra Firestone are the canonical examples. Founder-led storytelling and detailed education work best.
The newer picture, from operator chatter post-2024, says Shorts ate all the attention. Serious DTC tutorials get no views. The smart money moved to LinkedIn and X.
Both pictures rest on individual observation. No one has systematically asked who actually wins on DTC YouTube right now, what the winning content looks like, and how big the gap between head and long tail really is.
So we built a dataset.
We used YouTube Data API v3 to pull 277 channels classified as DTC operators, educators, and tool companies. For each channel, we grabbed the most recent 30 uploads. That gave us 5,695 videos. We classified each video into 15 content buckets using transparent regex rules over titles and descriptions. The analysis window is videos published on or after January 1, 2024, which produced a final sample of 4,746 videos. The snapshot date was June 3, 2026.
The full dataset, scripts, charts, and methodology are archived in the Thunderbit Operations US DTC YouTube Atlas repository for anyone who wants to inspect the source material or rerun the analysis.
The short answer to "what wins on DTC YouTube in 2026?":
Identity wins. Operator tactics lose. Tool companies are underpriced. And the gap between head and median is wider than anyone really talks about.
The Headline Findings
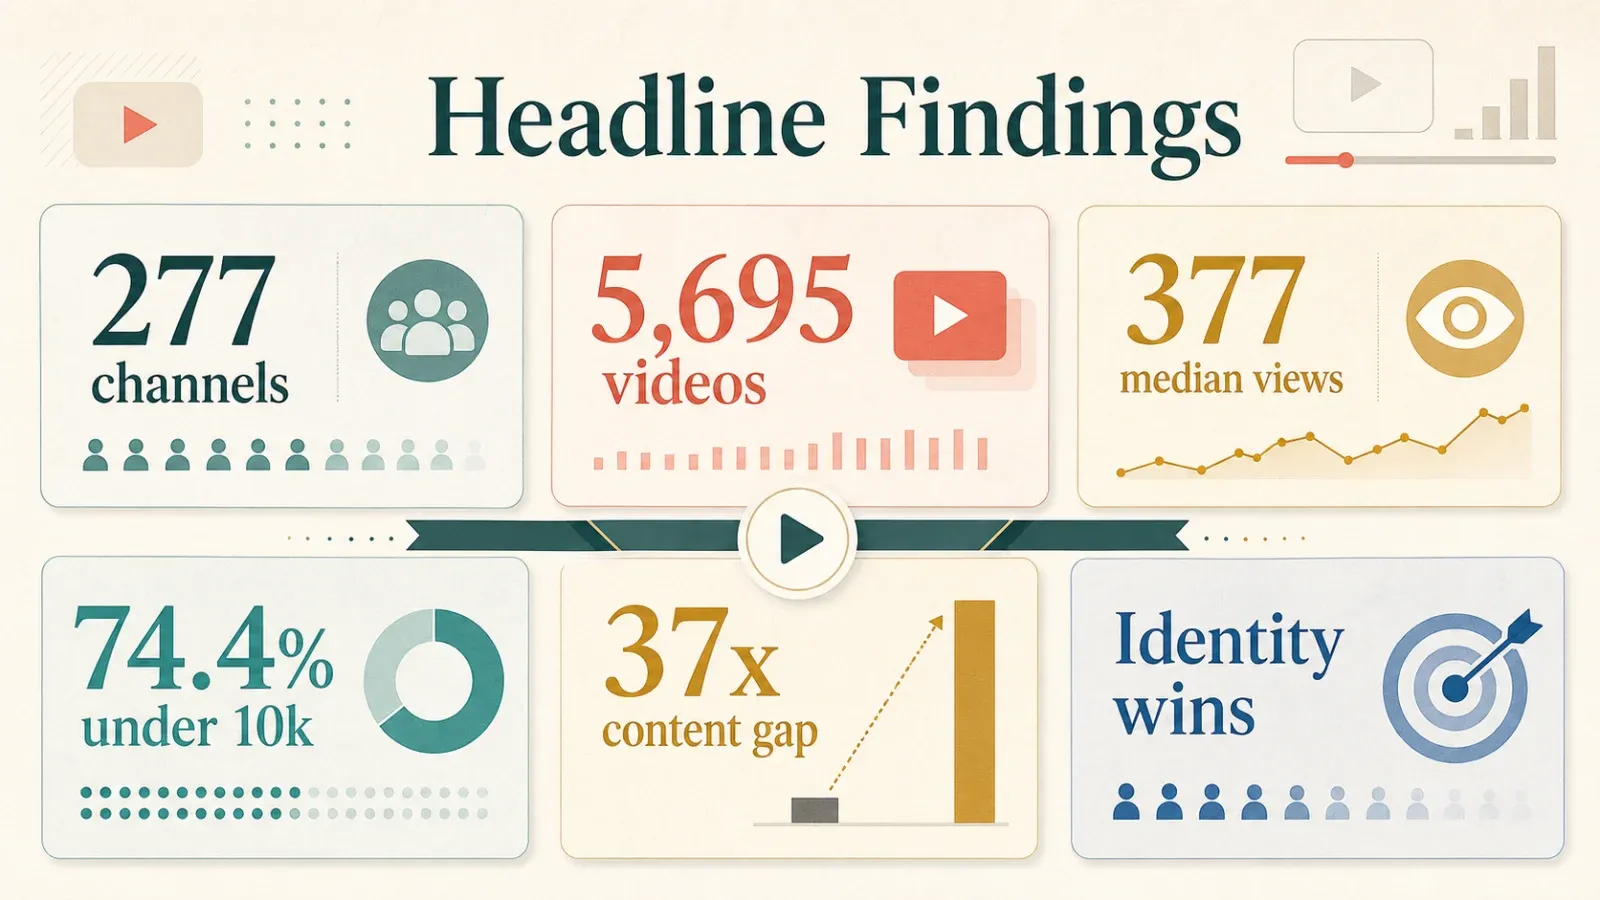
If I had to explain this study to a DTC marketing team in one screen, here are the numbers I would lead with.
| Finding | Data Point |
|---|---|
| Channels analyzed | 277 |
| Videos analyzed | 5,695 |
| Videos in 16-month window | 4,746 |
| Snapshot date | 2026-06-03 |
| Median channel subscribers | 265 |
| Median video views | 377 |
| Channels under 10k subscribers | 74.4% |
| #1 channel by views | Shopify (official) |
| Shopify lead over #2 (Noah Kagan) | 2.4x |
| Top content bucket by median views | tools_ai (1,963 views) |
| Worst content bucket by median views | metrics_finance (52 views) |
| Top vs bottom bucket ratio | 37x |
The number I keep coming back to is the bottom one: a 37x gap between the best- and worst-performing content type by median views.
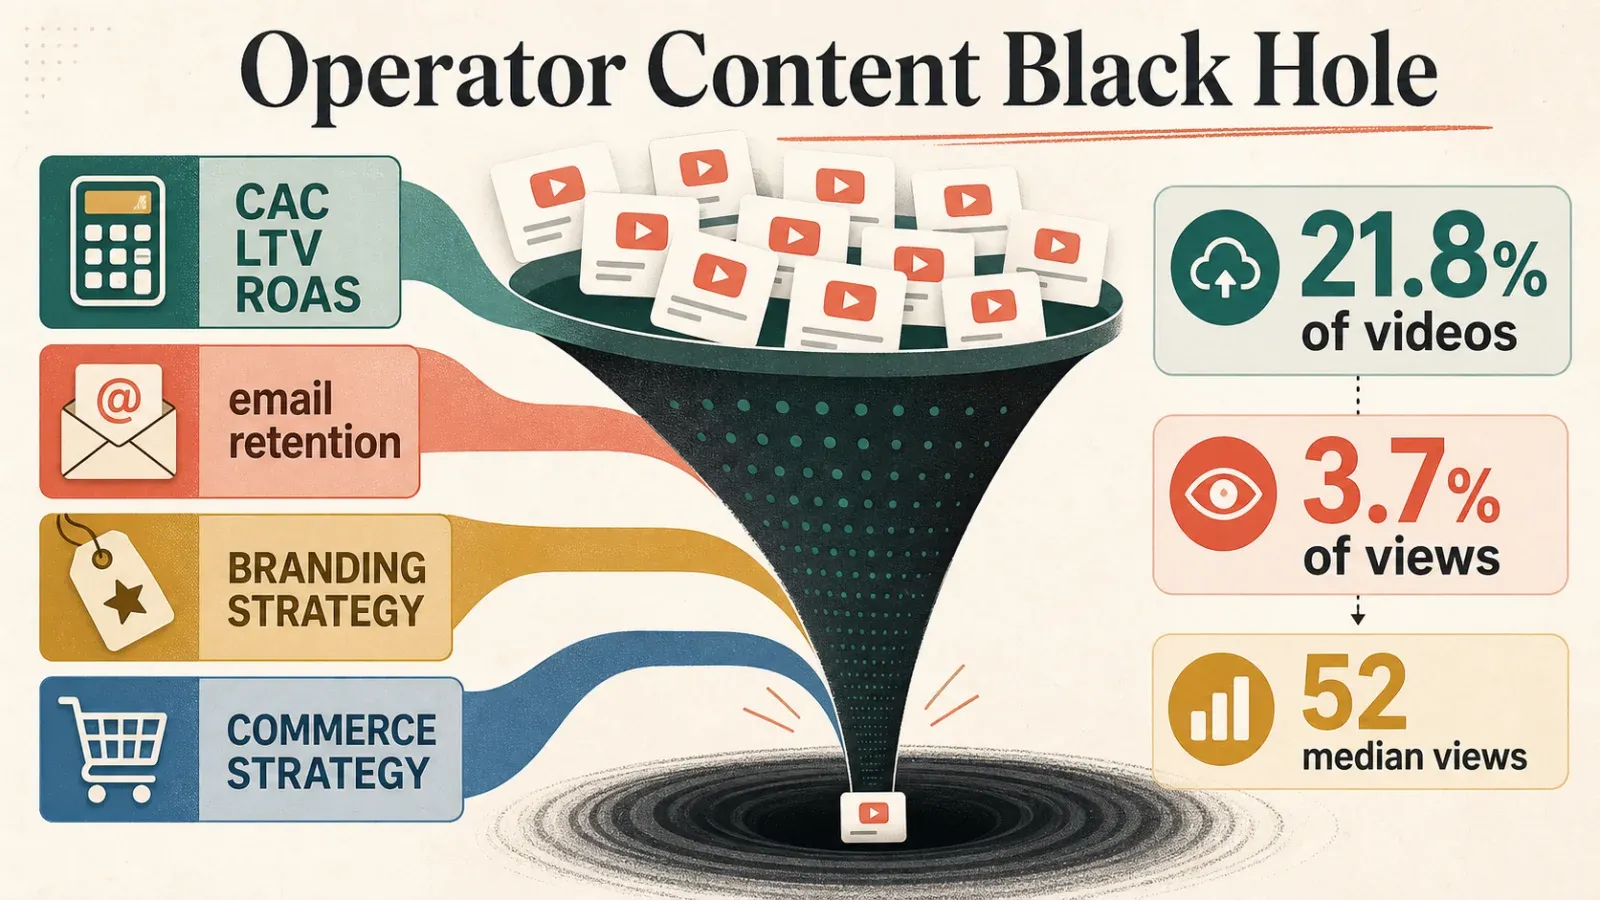
The worst-performing bucket is the most serious DTC content in the industry. CAC, LTV, AOV, ROAS, unit economics, contribution margin. The kind of content that, on LinkedIn, gets reshared by every growth manager you've ever met. On YouTube, it has a median of 52 views.
That is the central tension of this report.
The #1 DTC YouTube Channel Is a Platform, Not a Creator
The single most surprising finding sits at position one.
Shopify's official YouTube channel pulled 31,951,830 views over the 16-month window. That is 2.4 times the runner-up, Noah Kagan, who came in at 13,233,888.
Shopify has 480,000 subscribers in this dataset, which ranks 14th. But average views per video is 1,065,061 — the highest single figure in the sample.
| Rank | Channel | Subs | 16-mo views | avg/vid |
|---|---|---|---|---|
| 1 | Shopify | 480k | 31.95M | 1.07M |
| 2 | Noah Kagan | 1.18M | 13.23M | 827k |
| 3 | Simon Squibb | 2.37M | 8.67M | 289k |
| 4 | Wholesale Ted | 1.47M | 4.41M | 147k |
| 5 | Greg Isenberg | 644k | 4.36M | 145k |
| 6 | The Startup Show | 4.9k | 2.96M | 99k |
| 7 | Colin and Samir | 1.62M | 2.86M | 95k |
| 8 | Spocket | 97.6k | 2.83M | 118k |
| 9 | Oberlo | 344k | 2.73M | 91k |
| 10 | Marko | 85.1k | 2.41M | 80k |
What's even more striking is the individual video leaderboard. Six of the top 15 most-viewed individual videos in the entire sample are Shopify official uploads. The number one and number two slots are two separate uploads of the same 70-second Short, "Entrepreneurs: we're built different." Combined views: 23.3 million. The voice-over is literally just that one line.
The remaining four Shopify entries are brand moments tied to Black Friday: merchants ringing the opening bell at Nasdaq, Shopify on the Sphere in Las Vegas, real-time Black Friday sales on the world's largest LED screen.
All of them are brand narrative. None of them teach how to use Shopify.
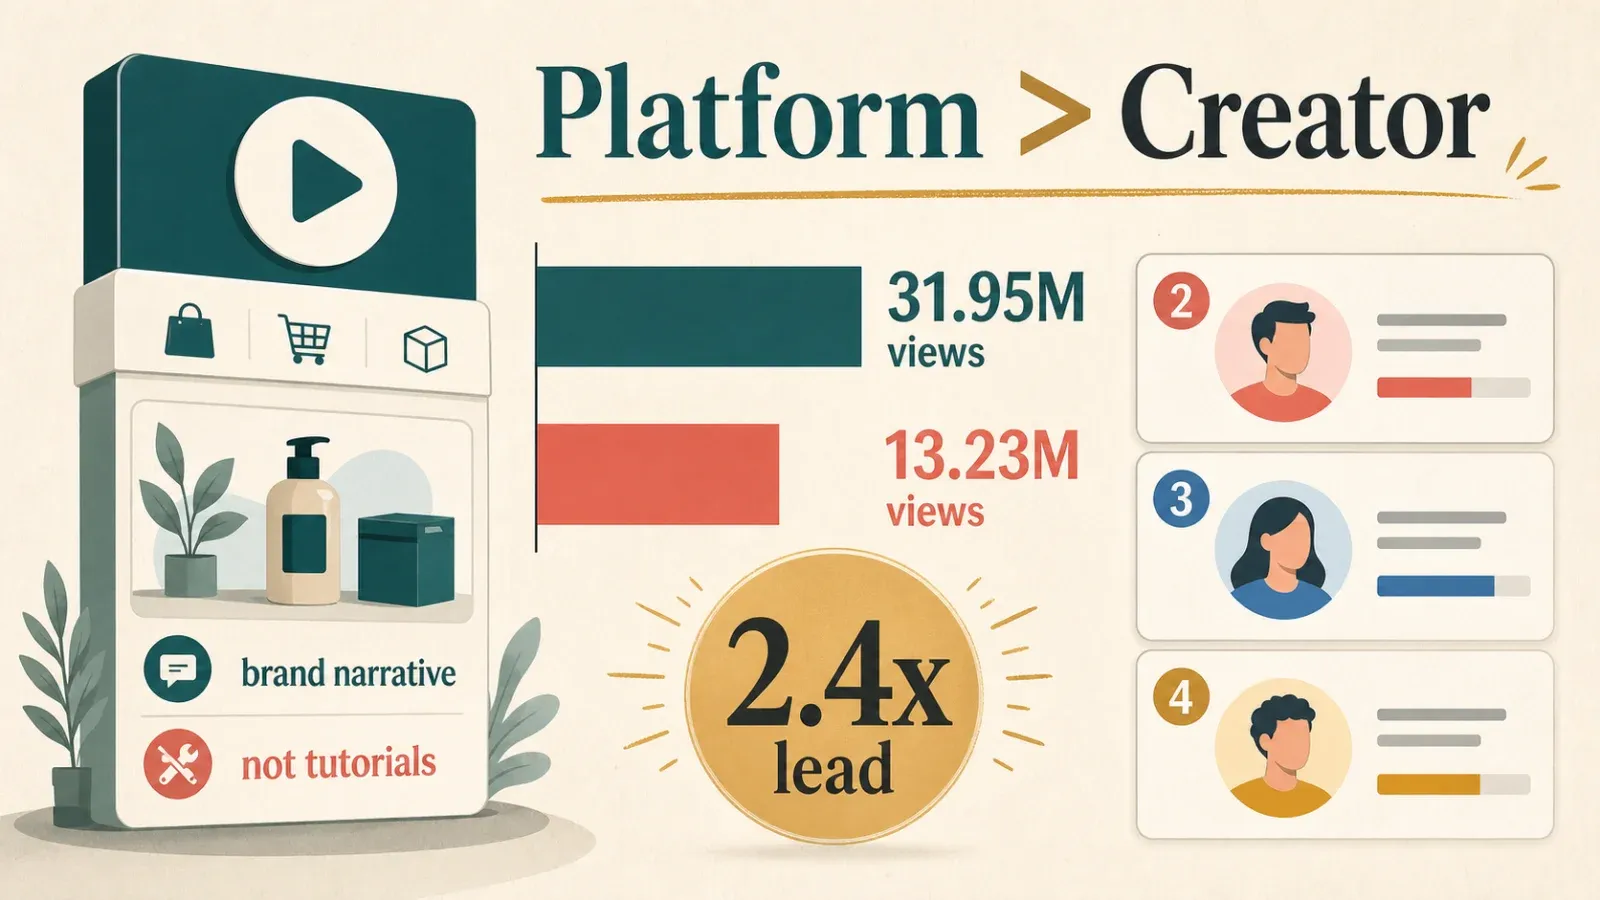
Read the top 10 by archetype, not by name. Only four channels in that list (Wholesale Ted, Greg Isenberg, Marko, Sunny Lenarduzzi) match the classical "independent DTC educator" archetype. The other six are platform accounts (Shopify), founder personal brands monetizing identity (Noah Kagan, Simon Squibb, Colin and Samir), or tool-company accounts (Spocket, Oberlo).
The independent DTC teacher archetype is being squeezed from three directions at once.
The most replicable playbook in this data is not the Beardbrand path. Beardbrand has 2.13 million subscribers and pulled only 1.76 million views over 16 months. The velocity is gone. The replicable playbook is the Shopify path: package brand identity into 70-second Shorts and don't teach anyone anything.
That conclusion is uncomfortable, but the data is clear.
Hard Operator Content Is a Traffic Black Hole
Group videos by the 15 content buckets and look at median views. One set of numbers is hard to look away from.
| Content bucket | Videos | Median views | Median duration |
|---|---|---|---|
| tools_ai | 96 | 1,963 | 3:14 |
| news_macro | 19 | 1,924 | 1:15 |
| dropshipping | 148 | 1,799 | 0:51 |
| ads_meta | 293 | 1,584 | 12:23 |
| product_sourcing | 133 | 1,544 | 8:03 |
| case_study | 482 | 1,055 | 14:08 |
| ads_tiktok | 214 | 881 | 10:14 |
| founder_vlog | 33 | 748 | 1:35 |
| interview_pod | 171 | 552 | 14:48 |
| other | 1,752 | 344 | 0:57 |
| shopify_setup | 439 | 251 | 4:32 |
| ads_google | 174 | 193 | 9:54 |
| branding_creative | 197 | 146 | 2:18 |
| email_retention | 448 | 142 | 9:04 |
| amazon_pivot | 41 | 105 | 1:57 |
| metrics_finance | 106 | 52 | 12:15 |
The four worst-performing buckets are exactly the ones DTC operators are taught to take most seriously: metrics_finance (median 52), amazon_pivot (105), email_retention (142), branding_creative (146). These four buckets account for 1,033 videos, which is 21.8% of the sample. They contribute 3.7% of total views.
The return on investment is negative.
Look at the top 15 individual videos. Eleven of them fall into the "other" bucket, which is the bucket for content that doesn't match any of our 14 tactical regex rules. The "other" bucket holds 1,752 videos (36.9% of the sample) and contributes 61.6% of total sample views.
The titles in that top 15 tell the real story: Entrepreneurs: we're built different, The BEST Part of Being Rich, Millionaires are Nicer Than you Think, Nike HIRED him after this, Why Patrick Bet-David Hired Ronaldo's Coach, A Billionaire Explains Why Private School is Worth Every Penny, How Mark Zuckerberg Became Successful.
Identity. Wealth. Aspiration. Celebrities.
What YouTube's algorithm rewards is not "teach me how to do this." It's "tell me who I can become."
That inverts the dominant DTC content assumption, which has always been that long-form education is the high-trust play. The data says identity and wealth narratives take the traffic while serious operator content gets suppressed.
If you've spent six months making nine-minute Klaviyo flow tutorials and getting 142 median views, the data is not telling you to push harder. It's telling you the algorithm itself doesn't reward this content type. The same material recut as a LinkedIn post tends to do 4-15 times the impressions based on our own distribution data.
The market for serious DTC content exists. It just isn't on YouTube.
AI-Tools Content Has the Highest Median Views
Two narratives about AI content circulate constantly in DTC circles: "AI is saturated, nobody clicks on it anymore" and "AI content all wins because of Shorts." The data agrees with neither.
Only 96 videos in our sample fall into the tools_ai bucket — that's 2.0% of the sample. But the median view count for this bucket is 1,963, the highest of all 15 buckets.
Compared to the buckets people consider safer bets: tools_ai beats case_study by 86%, ads_meta by 24%, and shopify_setup by 682%.
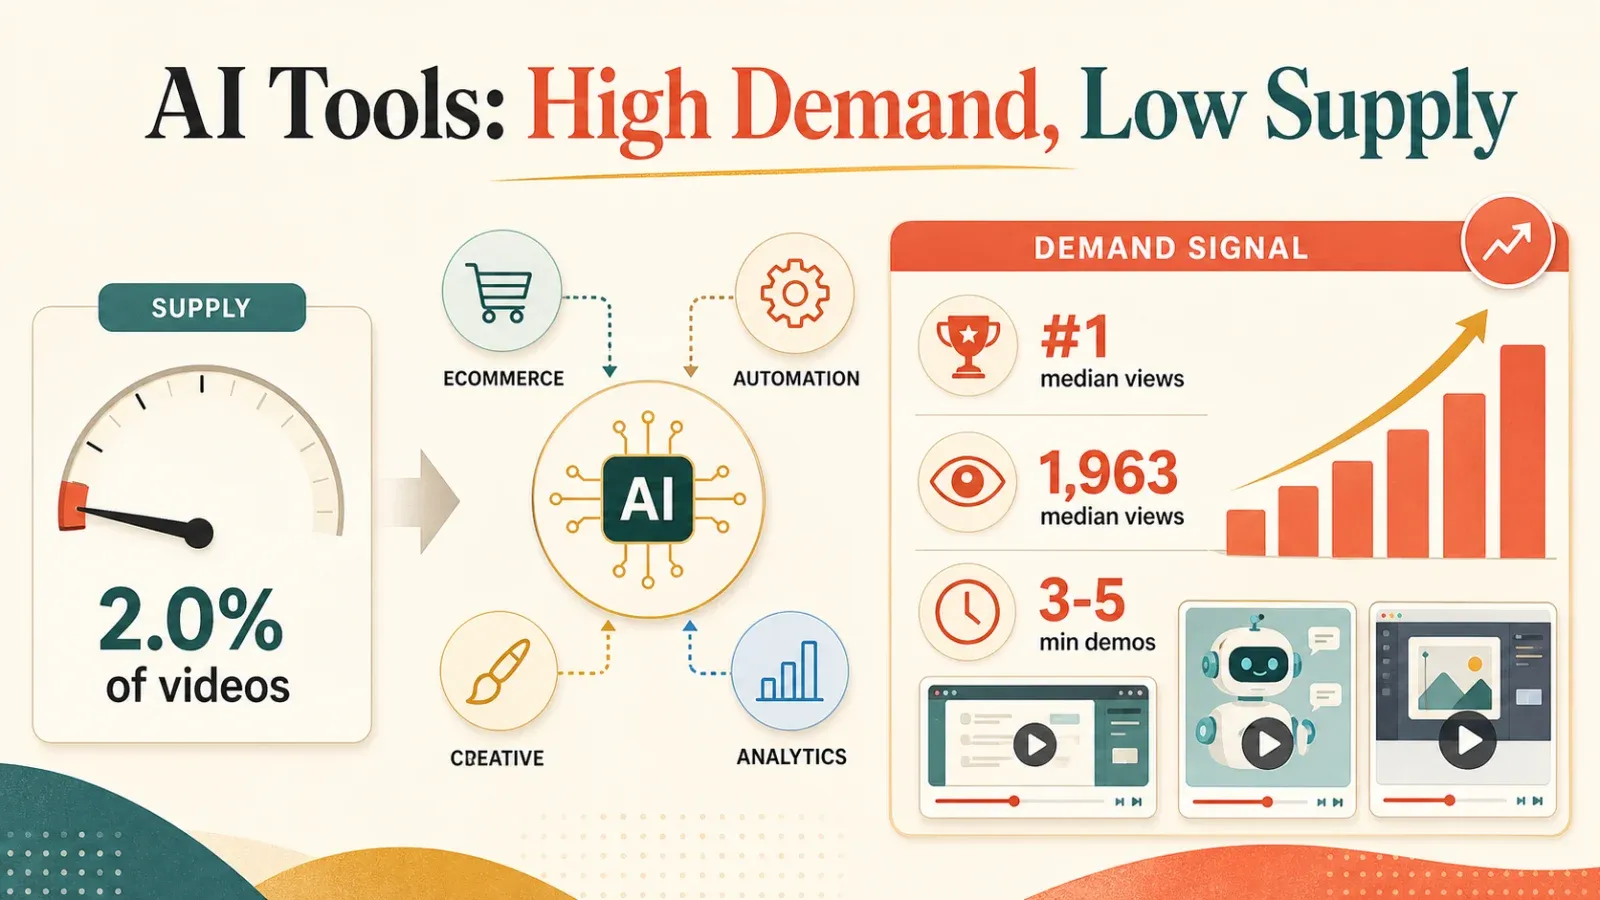
The content actually in this bucket is mostly ChatGPT-for-ecom videos, AI automation workflows (n8n, Zapier), Claude or Midjourney creative use cases, and AI-tool review roundups. Median duration is 194 seconds, about three minutes and fourteen seconds. That's between pure Shorts and long-form. The sweet spot is single-tool demo or review content in the three-to-five-minute range.
The traffic potential — median views times video count — for tools_ai sits at 188k. That's in the same order of magnitude as case_study (509k) and ads_meta (464k). But metrics_finance is at 5.5k, which is 3% of the tools_ai potential.
The ceiling is high. The bottleneck is supply, not demand. Doubling the output of AI-tool content in this niche would substantially shift the traffic distribution.
For tool companies — including Thunderbit, which is one — this is the highest-yield content format currently visible on DTC YouTube.
Shorts and Long-Form Are Two Parallel Tracks
Sort the 15 buckets by median duration and a clean bimodal distribution falls out.
The Shorts-dominant region (median under two minutes) includes: dropshipping (51 seconds), other (57 seconds), news_macro (75 seconds), founder_vlog (95 seconds), amazon_pivot (117 seconds), branding_creative (138 seconds), tools_ai (194 seconds).
The long-form region (median over five minutes) includes: shopify_setup (4:32), product_sourcing (8:03), email_retention (9:04), ads_google (9:54), ads_tiktok (10:14), metrics_finance (12:15), ads_meta (12:23), case_study (14:08), interview_pod (14:48).
There is almost nothing in the four-to-eight-minute middle.
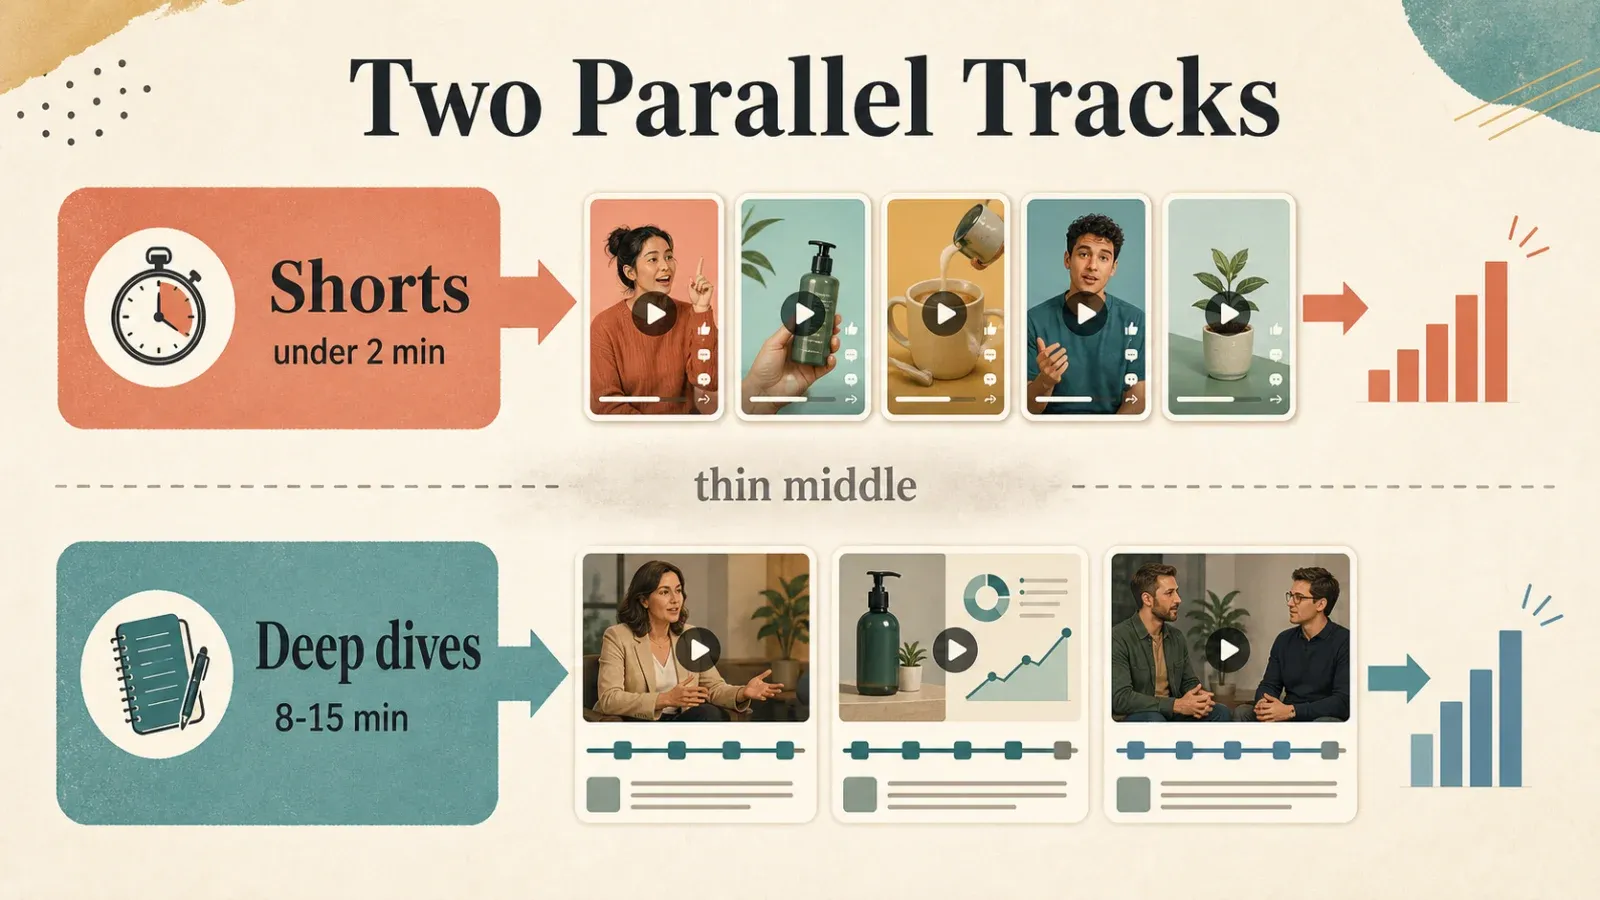
DTC creators don't really have a "medium length option." You either do Shorts or 10+ minute long-form, and the middle is a dead zone where neither algorithm rewards you well. This matches what we found in the Realtor Atlas exactly.
But DTC differs from real estate on one axis. In DTC, the Shorts buckets have higher median views than the long-form buckets on average. The same topic packaged as Shorts breaks out more often than as long-form. That's the opposite of the Realtor Atlas finding, where long-form home tours beat Shorts on median views.
DTC YouTube tilts toward Shorts. Real-estate YouTube tilts toward long-form.
For content teams: if you can only pick one format for a DTC topic, default to Shorts. The exception is case studies, interviews, or deep tutorials where you have substantial real material to fill more than ten minutes. The middle ground is a traffic trap.
The DTC YouTube Long Tail Is Extreme
Of the 277 channels in our sample, 206 have fewer than 10,000 subscribers. That's 74.4%.
| Subscriber range | Channel count |
|---|---|
| Under 10k | 206 |
| 10k to 100k | 35 |
| 100k to 500k | 16 |
| 500k to 1M | 9 |
| Over 1M | 11 |
Median channel: 265 subscribers. Median video: 377 views.
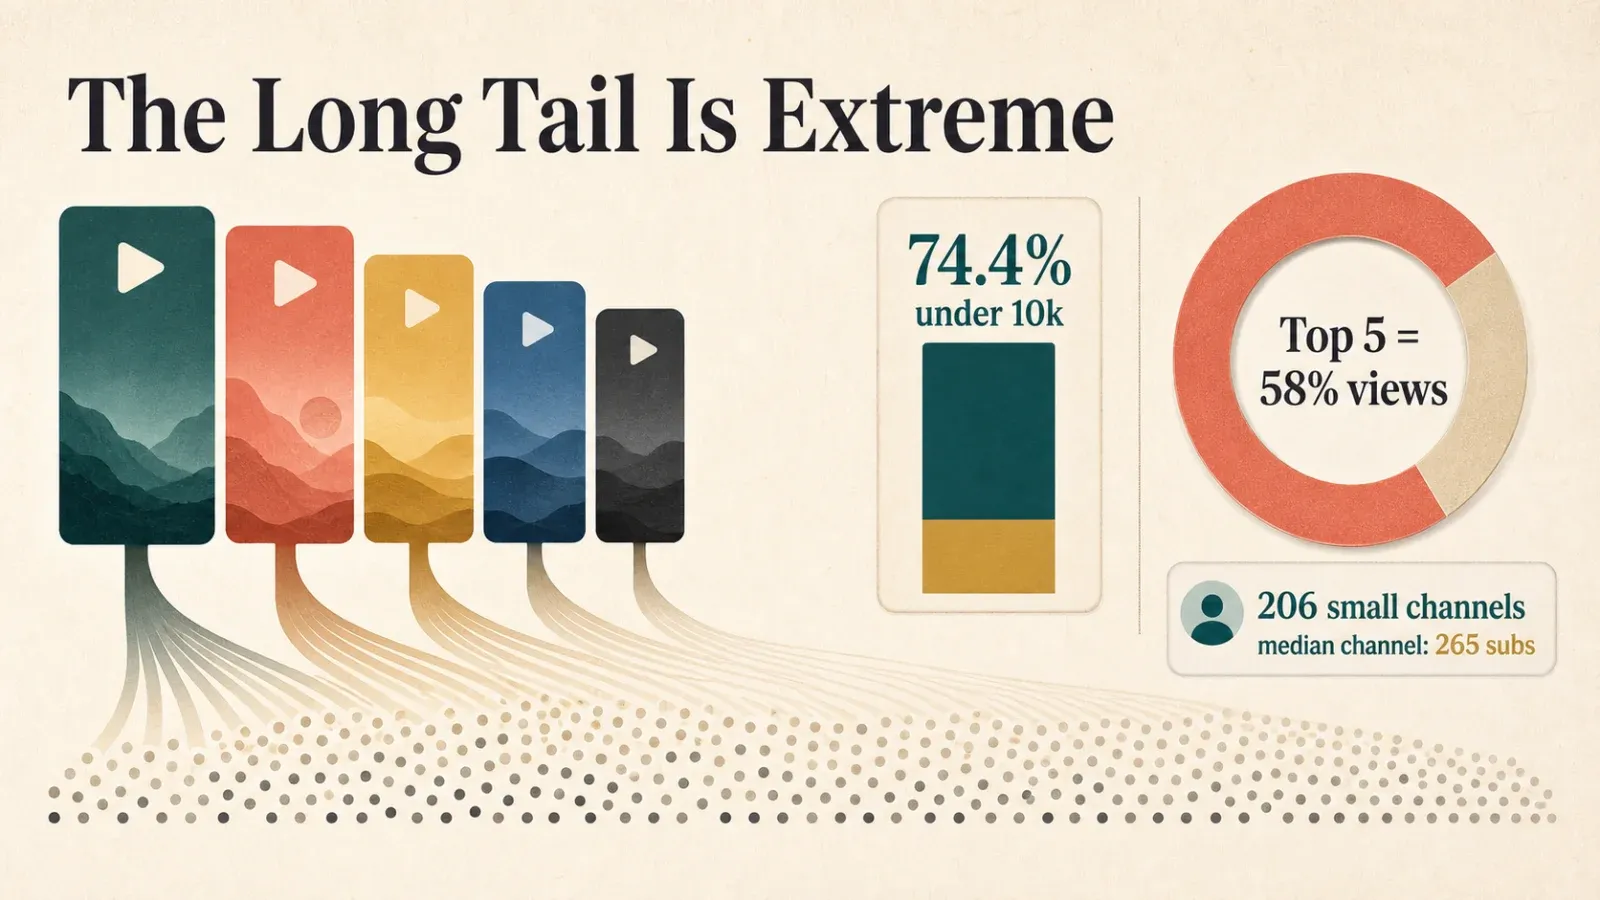
This contrasts sharply with the Realtor Atlas, where the median channel had 2,030 subscribers and 1,068 median video views. DTC YouTube is eight times more long-tail than real-estate YouTube.
Two structural reasons explain it.
First, "DTC" as a category label is much fuzzier than "realtor." Anyone running dropshipping, a Shopify side hustle, or an Amazon-to-Shopify pivot will call themselves DTC. That drags in a huge population of micro-creators, many of whom have very thin content programs.
Second, DTC YouTube has no equivalent of MLS-listing content that gives small realtor channels a baseline traffic floor. A new realtor can build a small channel on home tour videos because the local market always supplies houses to tour. A new DTC creator making Klaviyo tutorials has a median of 142 views and no sticky audience emerging from that floor.
But this long tail is not evenly distributed. The top five channels (Shopify, Noah Kagan, Simon Squibb, Wholesale Ted, Greg Isenberg) account for 62.6 million views, which is 58% of the total sample's 107.9 million. The remaining 247 channels under 100k subscribers split the other 42%.
Draw the geometry: head-to-median ratio for subscribers is roughly 6,000x. Head-to-median ratio for video views is roughly 38,000x. The Realtor Atlas head-to-median ratio was 3,300x. DTC is nearly twice as steep.
In a power-law distribution this extreme, mean values are essentially useless. Any report describing "the average DTC YouTube channel has 149k subscribers" is being polluted by a handful of super-channels.
For small and mid-tier creators, the operating reality is this: do not treat "10k subscribers" as a transition goal. It is the steady state of the DTC YouTube long tail. The actual lever is sustained cadence over 12 months, not subscriber milestones.
Tool-Company Channels Punch Above Their Weight
In the top 15 channels by 16-month views, Spocket (#8, 97,600 subscribers, 2.83 million views) and Oberlo (#9, 344,000 subscribers, 2.73 million views) are dropshipping tool companies. They are not creators.
Spocket's average per video is 117,735. That is double Beardbrand's 58,706 — even though Beardbrand has 22x the subscriber count.
The Realtor Atlas has no equivalent of this. There is no structural reason for "tool company accounts also reaching top 10" to exist in real estate.
In DTC YouTube it exists because dropshipping is a vertical where the tool itself is the demo. A Spocket video showing the product is functionally the same as a creator's tutorial on Spocket. With individual creator dropshipping content already diluted to a median of 1,799 views, the company that makes the tool actually has an informational advantage. They know what real users are doing.
Widen the lens. Shopify, Spocket, and Oberlo combined contribute 37.5 million views. That's 34.7% of the entire sample's 107.9 million. Add in Shopify Education (cadence #1 at 300 videos per month) and Shopify Launch Lab (180 videos per month, #3 in cadence) and the Shopify ecosystem's official channels are essentially a traffic mountain inside this dataset.
For tool-company marketing teams, this should change the assumption that YouTube is "too hard" or "not for us." It is a viable channel. The prerequisites are clear use cases that translate into demo videos and a 50+ videos-per-month cadence.
A useful counter-example is Chew On This Podcast: a DTC-focused interview channel with just 30,500 subscribers but 1.94 million views in 16 months at an average of 64,551 per video. It doesn't have brand equity like Shopify, isn't a tool company, and operates purely as an interview podcast with steady cadence. Honest Ecommerce (42.9 videos per month), DTC Live, and DTC Podcast all sit in the cadence top 15.
The serious DTC content market exists in the interview format, even though it doesn't exist in the single-presenter tutorial format. If a tool company can't produce demo videos, founder interview series is the next-best playbook.
Posting Cadence Is the Brutal Lever
Sort the sample by videos-per-month over the 16-month window. The top eight are: Shopify Education (300 per month), Business E-commerce Guides (240), Shopify Launch Lab (180), Arabia Dropshipping (150), Alex Hormozi (128.6), Dan Martell (128.6), Build Your Personal Brand (112.5), DTC Podcast (75).
Three hundred videos per month is ten per day. That is SEO-automation-factory scale, not human production. Shopify Education is clearly AI-voiceover plus template-generated content.
But the more interesting data point is Hormozi and Dan Martell — real human IPs — maintaining 128 videos per month. That's four-plus videos per day, every day, for 16 months.
In the Realtor Atlas, the top cadence channel was around 30 per month. Top realtors held 10 to 15 per month. DTC educator top cadence is four to thirteen times higher than real-estate top cadence.
The reason isn't subtle. A real estate home tour requires being inside the house, renting a gimbal, and editing an 8-minute video. DTC content can be the creator alone with a camera in a home office, talking for three minutes. The marginal production cost is dramatically lower. Top DTC educators can pull cadence to extreme levels and outproduce the mid-tier into irrelevance.
Sample median is 5.2 videos per month. The gap between head and median is 25 to 58 times.
If you're a mid-tier DTC creator, competing with the head on content quality is a misaligned strategy. The real lever is cadence. This inverts the standard "content quality wins" advice, but the data is unambiguous.
A useful counter-intuitive note: the cadence top 15 includes several channels in the 10k-to-50k subscriber range (Build Your Personal Brand at 112.5 per month, Honest Ecommerce at 42.9, Ecommerce Paradise at 50, DTC Live at 50). None of these are Hormozi-scale IPs. But their 16-month cumulative views sit in the 500k to 2M range. Cadence isn't a head-tier-only lever. Mid-tier creators willing to push cadence can sustain a real sales funnel.
What DTC Teams Should Actually Do
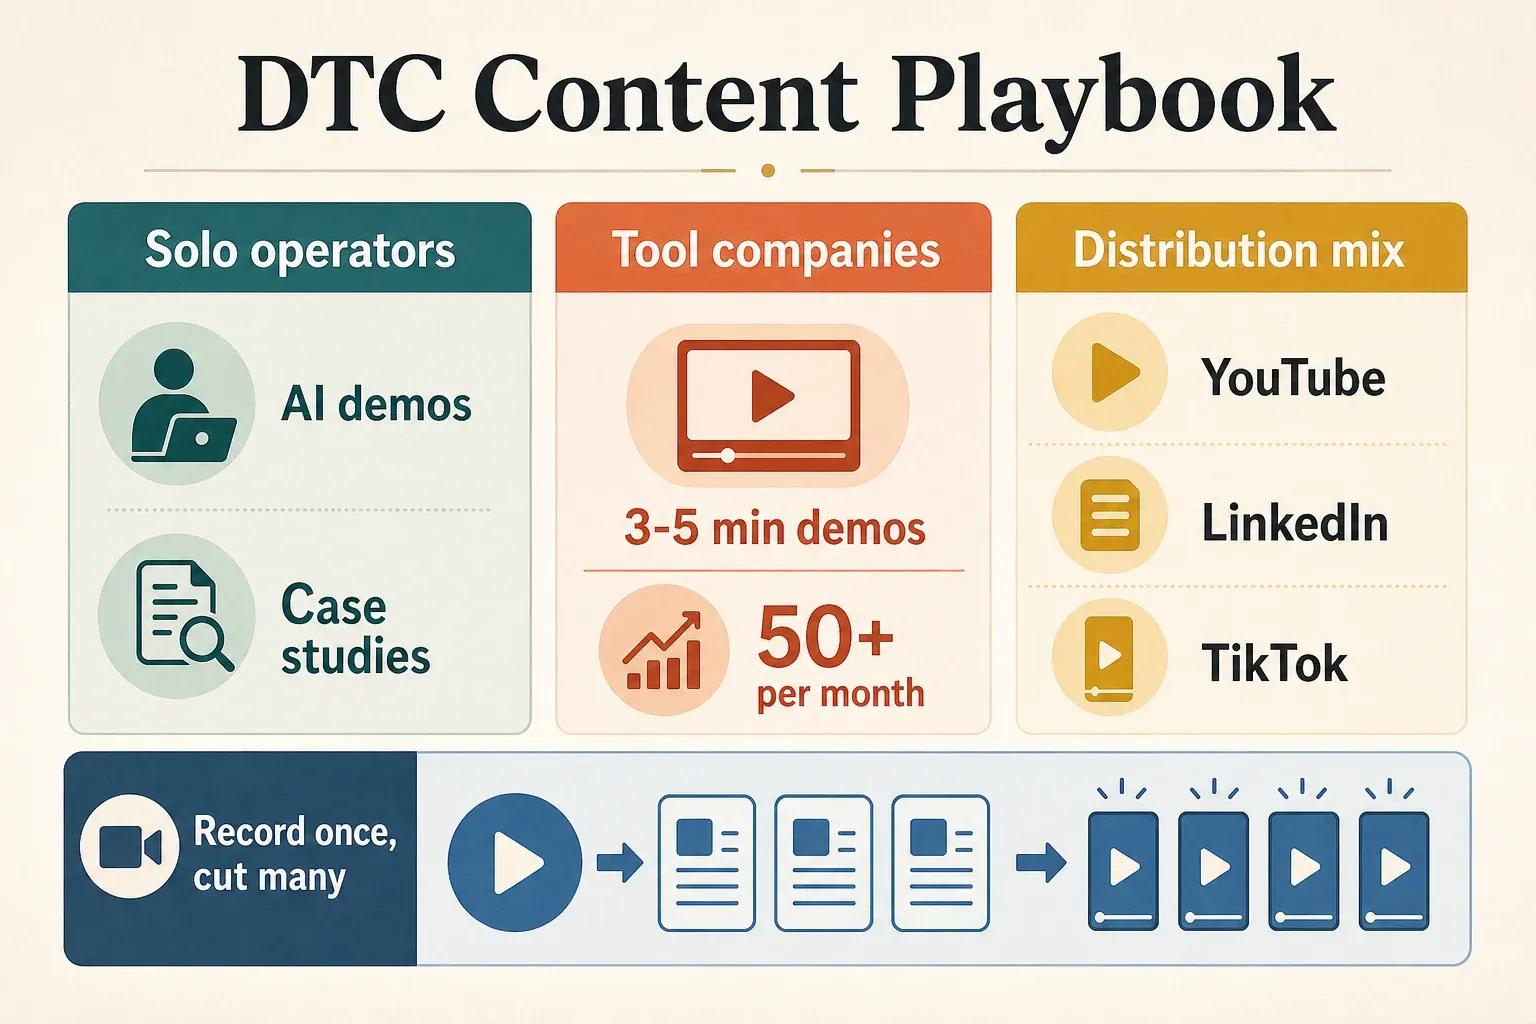
If I were running content for a DTC operator team, the data would push me to three audience-specific plays.
For Solo Operators Starting a YouTube Channel
Don't make metrics_finance or branding_creative content. Median views in the 52-to-146 range are traffic black holes.
The tools_ai bucket at 1,963 median views is the highest-ROI entry point. If you have a real case study (built a brand from zero to $X), commit to 14-minute long-form. That's the bucket's median duration and the highest-median content type in the long-form region.
For everything else, default to Shorts.
Don't expect to break the 10k subscriber wall. 206 of the 277 sample channels are stuck below that and stay stuck. It is the steady state of this long tail.
For DTC Tool Companies and SaaS
Tool-company YouTube is underpriced. Spocket-and-Oberlo-scale channels pull 90,000 to 117,000 average views per video.
The format that works is single-tool demo content in the three-to-five-minute range, with 50+ videos per month cadence.
The Shopify path — brand-narrative 70-second Shorts — is the other route, but it requires preexisting brand equity that most SaaS companies don't have. The demo path is more replicable.
For DTC Content Distribution Strategy
YouTube tilts toward "soft" DTC content (wealth, identity, aspiration, AI tools). LinkedIn tilts toward "hard" DTC content (CAC, LTV, email, retention). These platforms are complements, not substitutes.
A piece of metrics_finance content with a YouTube median of 52 views might pull 5,000 LinkedIn impressions for the same production effort.
TikTok content (the ads_tiktok bucket at 881 median views) is the second-tier opportunity. Competition is roughly half what it is on Meta-ads content (the ads_meta bucket has 293 videos versus 214 for TikTok).
A concrete cross-platform workflow: record once, cut many. Start with a 14-minute long-form case study video, which matches the case_study bucket's median duration. Derive three to five Shorts (60 to 90 seconds, in the news_macro or founder_vlog formats), one LinkedIn long post (metrics_finance or branding_creative angle), one TikTok Short.
The top creators in our sample — Hormozi, Dan Martell, Greg Isenberg — have all publicly described some version of this "content pyramid" approach. For small teams, the trick isn't multi-platform presence. It's recording once and editing five outputs. Marginal cost is far lower than producing for each platform separately.
What This Report Does Not Claim
This report is not a census of every DTC creator on YouTube. It is a sample of 277 channels classified as DTC operators, educators, and tool companies, selected through 32 seed handles and 14 search expansions, filtered to country codes in {US, GB, CA, AU, empty}.
The sample tilts toward English-speaking DTC creators. It tilts toward educators because the seeds were chosen from channels that teach DTC. It tilts toward dropshipping content because the search expansions include "shopify dropshipping" and "tiktok shop seller." And it tilts head-heavy because YouTube's search API does not return channels under roughly 500 subscribers, so the true long tail (zero-subscriber experimental accounts) is invisible.
The Shopify ecosystem appears amplified inside this sample by the data source itself. Shopify is a seed channel and five of the fourteen search queries explicitly contain "shopify" or "dropshipping." This should not be read as Shopify's market share of DTC YouTube content.
YouTube's viewCount field does not separate Shorts from long-form. The "median views" figures throughout this report are mixed counts and slightly over-weight Shorts-heavy creators.
The 16-month window means channels that slowed or stopped uploading before 2024 are auto-dropped from cadence and stats. Cadence figures slightly bias toward currently-active creators.
The content classifier is regex, not LLM. 36.9% of videos fall into the "other" bucket. That is the cost of transparent reproducible rules over more accurate but opaque classification.
The safest version of the headline claim is this: across our 277-channel sample of US-market-dominant DTC YouTube channels, AI-tool content has 37 times the median views of operator-finance content. That is a strong enough signal to change a DTC content calendar.
The Bigger Lesson
The longer I sit with this dataset, the less I think it's only a YouTube story.
It's a story about what platforms reward versus what professionals respect.
DTC operators respect rigor. They respect unit economics. They respect contribution margin. They respect retention rates and email flow optimization and product-market-fit signals. The serious work of building a brand is largely invisible to consumers but central to professionals.
YouTube doesn't optimize for what professionals respect. It optimizes for what viewers click and watch. The two are not the same. Often they are opposite.
That gap is why metrics_finance content gets 52 median views and Entrepreneurs: we're built different gets 14.3 million.
The operator response isn't to give up on serious content. It's to recognize that distribution and depth are separate problems with separate tools. YouTube is for distribution. LinkedIn is for depth. TikTok is for breakout reach. A well-run DTC content program uses all three with different content tuned to each algorithm.
That sounds simple. In practice, most DTC teams treat all platforms as one bucket and then complain when their YouTube channel doesn't grow. The data in this report explains exactly why.
Public data doesn't remove judgment. It improves the conversation. It shows where intuition is wrong, which formats deserve more testing, and when "best practice" is really just habit wearing a nice jacket.
For DTC operators, the practical takeaway is direct: stop publishing serious operator content to YouTube and being surprised when nobody watches. Put serious content on LinkedIn where the audience exists. Put identity, aspiration, and AI-tool demos on YouTube where the algorithm exists. And if you must do both on YouTube, the long-form case-study format is the one that survives.
That's the difference between 52 median views and 14.3 million.
That's why we do original public-data research in the first place. Not to make a prettier spreadsheet. To make the next operating decision less dependent on vibes.
FAQs
How many YouTube videos were analyzed?
We analyzed 5,695 videos from 277 DTC-adjacent YouTube channels. The analysis window is videos published on or after January 1, 2024, which gives a final sample of 4,746 videos. The snapshot was taken on June 3, 2026.
What type of DTC YouTube content got the highest median views?
AI-tool content (the tools_ai bucket) had the highest median views at 1,963. This bucket includes ChatGPT-for-ecom videos, AI automation tutorials, and single-tool reviews. The sweet-spot format is three-to-five-minute single-tool demos.
What type of DTC content performed worst?
Financial metrics content (metrics_finance) had a median of just 52 views — the worst of any bucket. This includes CAC, LTV, AOV, ROAS, unit economics, and contribution margin content. The same content type tends to perform well on LinkedIn but is suppressed by YouTube's algorithm.
Should DTC operators stop publishing serious tactical content on YouTube?
The data suggests yes for tactical operator content (CAC, LTV, email retention, branding fundamentals). Move that content to LinkedIn, where similar material gets four to fifteen times the impressions. Keep YouTube for AI-tool demos, case studies, and identity-driven Shorts.
Why is Shopify's official channel the #1 DTC YouTube channel?
Shopify's channel uploads short, brand-identity-driven content (70-second Shorts like "Entrepreneurs: we're built different") at platform-level scale. The content is aspirational rather than educational. Six of the top 15 most-viewed individual videos in our entire sample are Shopify uploads.
How was this data collected?
We used the public YouTube Data API v3. We pulled channel and video metadata only — no videos, thumbnails, or private data. The full pipeline runs inside the free daily API quota (10,000 units) and used roughly 1,500 units. The code, seed list, search queries, and content-classification regex are all public in the GitHub repository.
Is this dataset reproducible?
Yes. The repository includes the six pipeline scripts (channel pool building, video fetching, statistics computation, chart rendering, and data audit), the seed list of 40 channel handles, the 14 search queries, and the 15-bucket classification regex. Anyone with a free YouTube Data API key can rerun the analysis. Numerical results will drift slightly because YouTube view counts change daily, but structural findings should remain stable within a quarter.