
Executive Summary
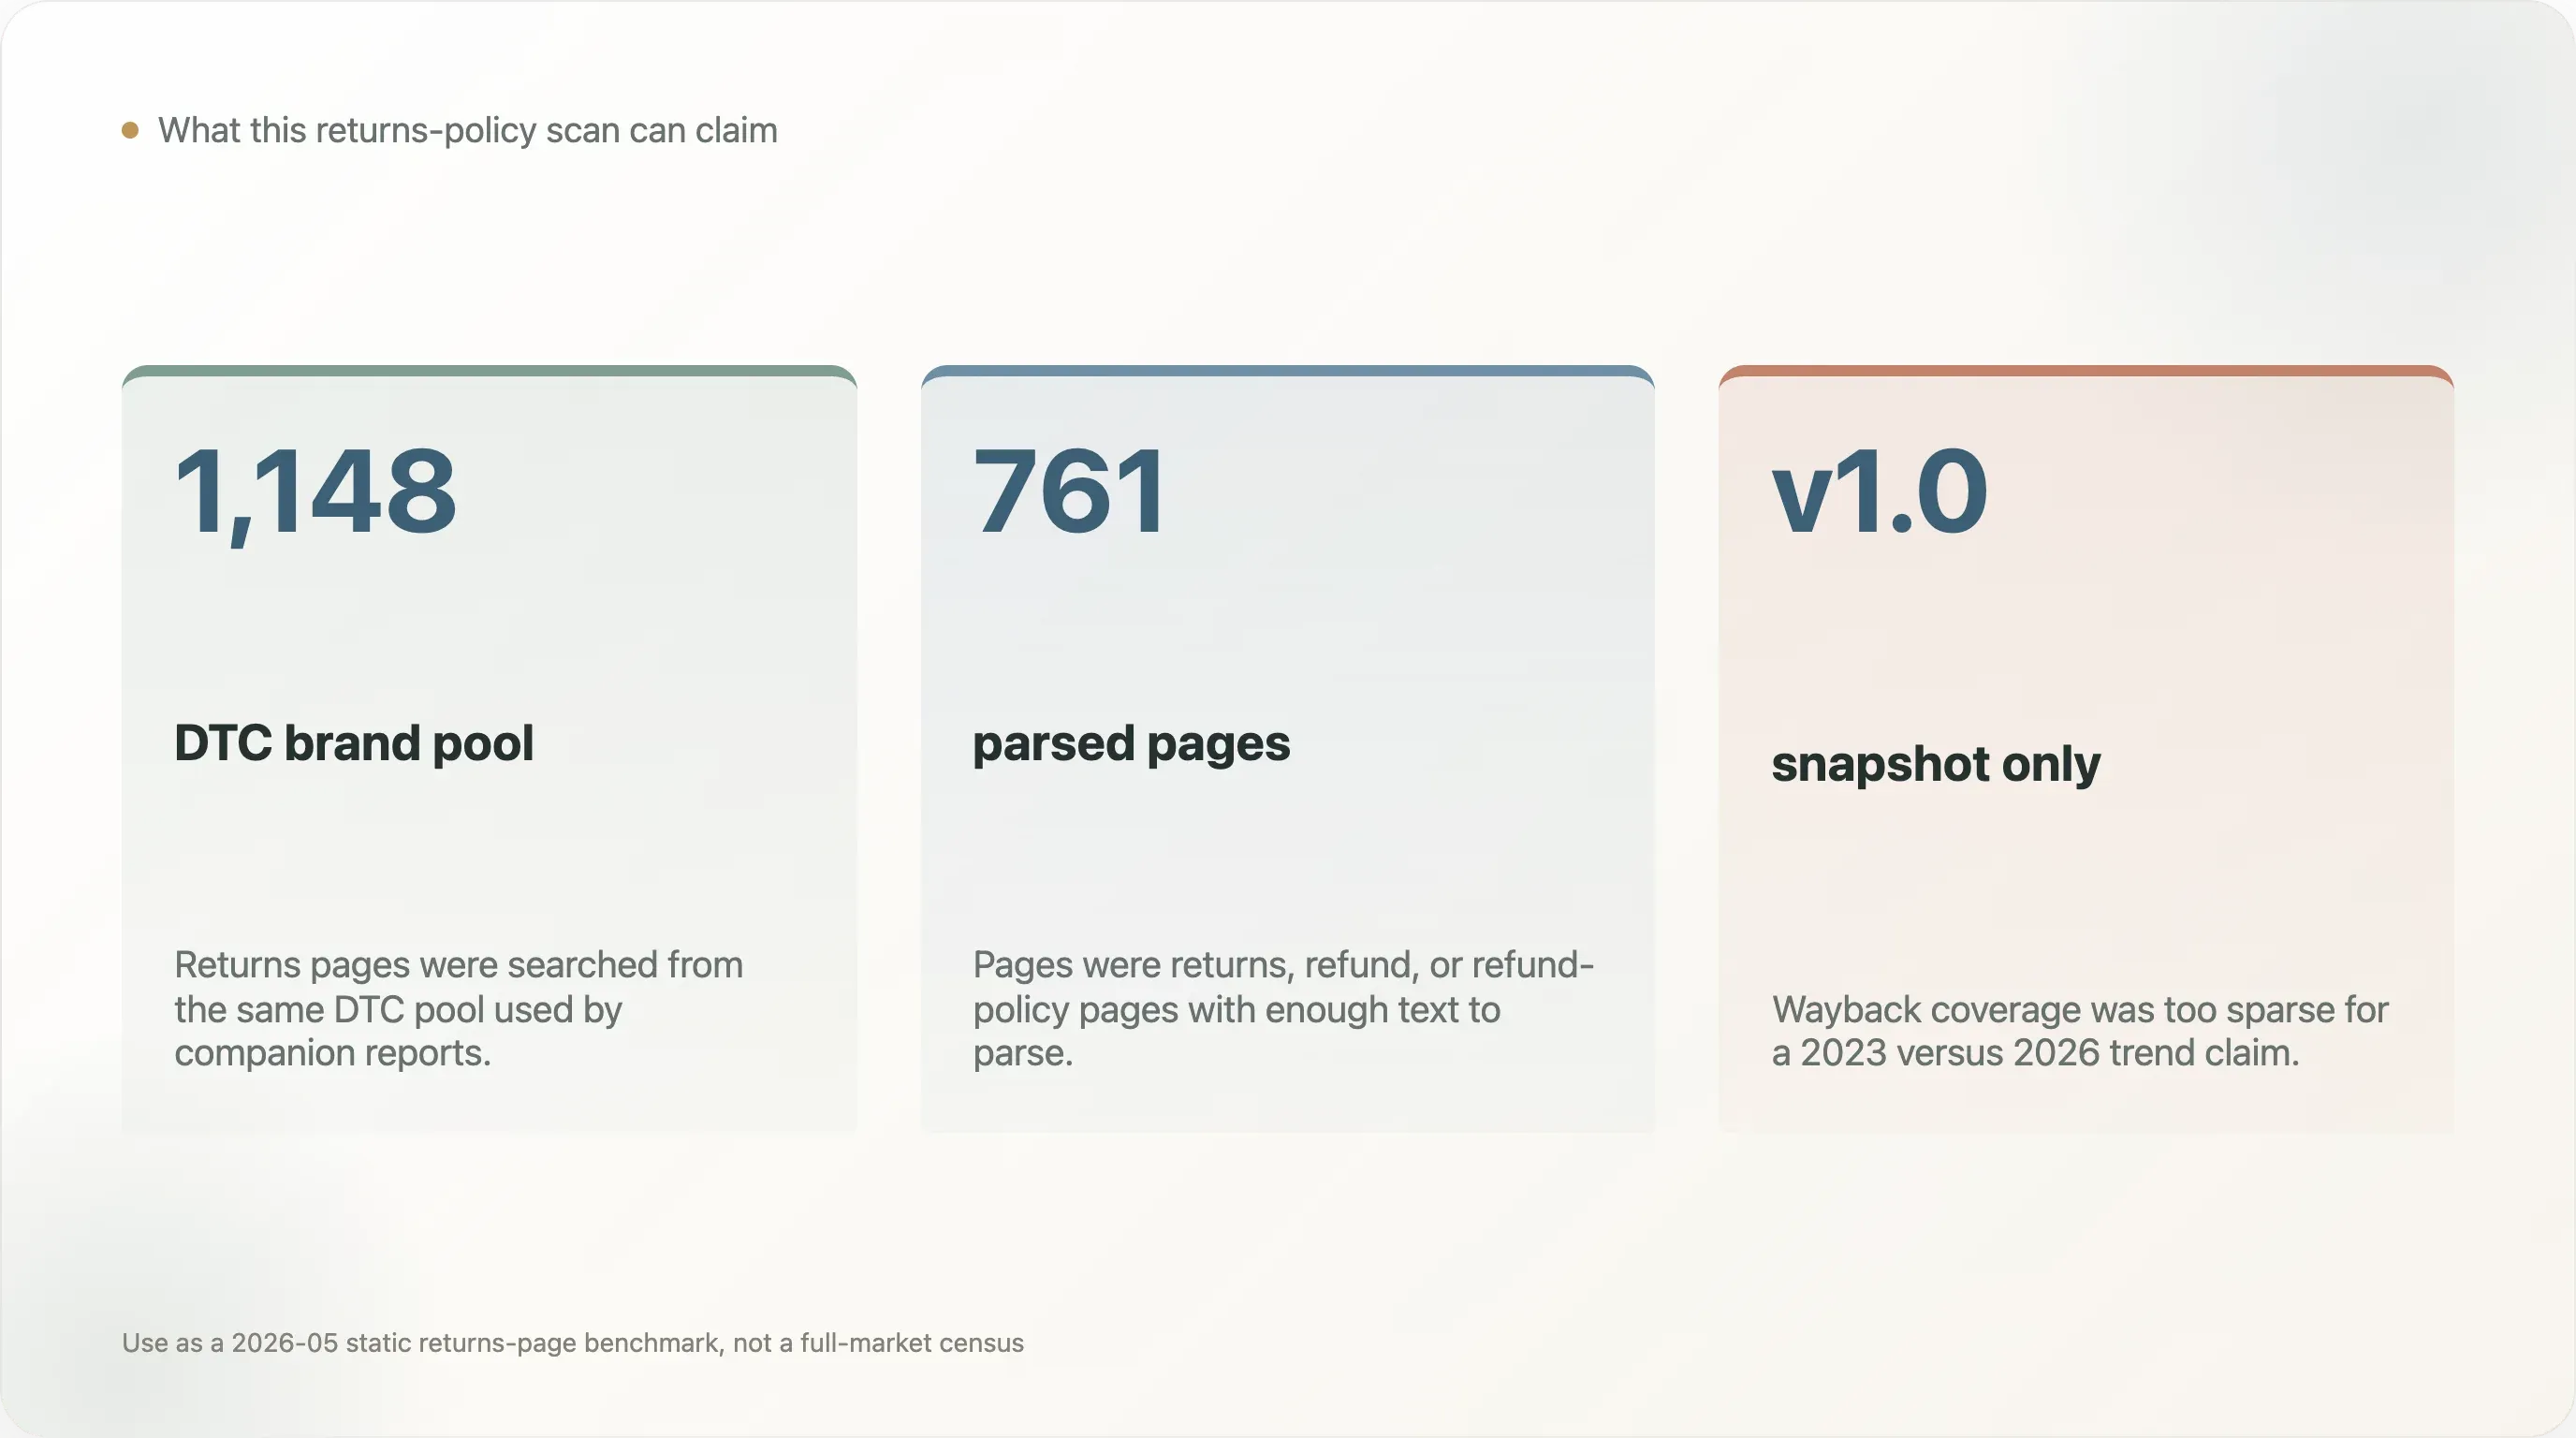
This research parses 761 DTC returns or refund pages found from a 1,148-brand DTC pool. It measures return-window language, free-return claims, restocking fees, original-packaging requirements, final-sale clauses, refund restrictions, and returns-SaaS vendor fingerprints.
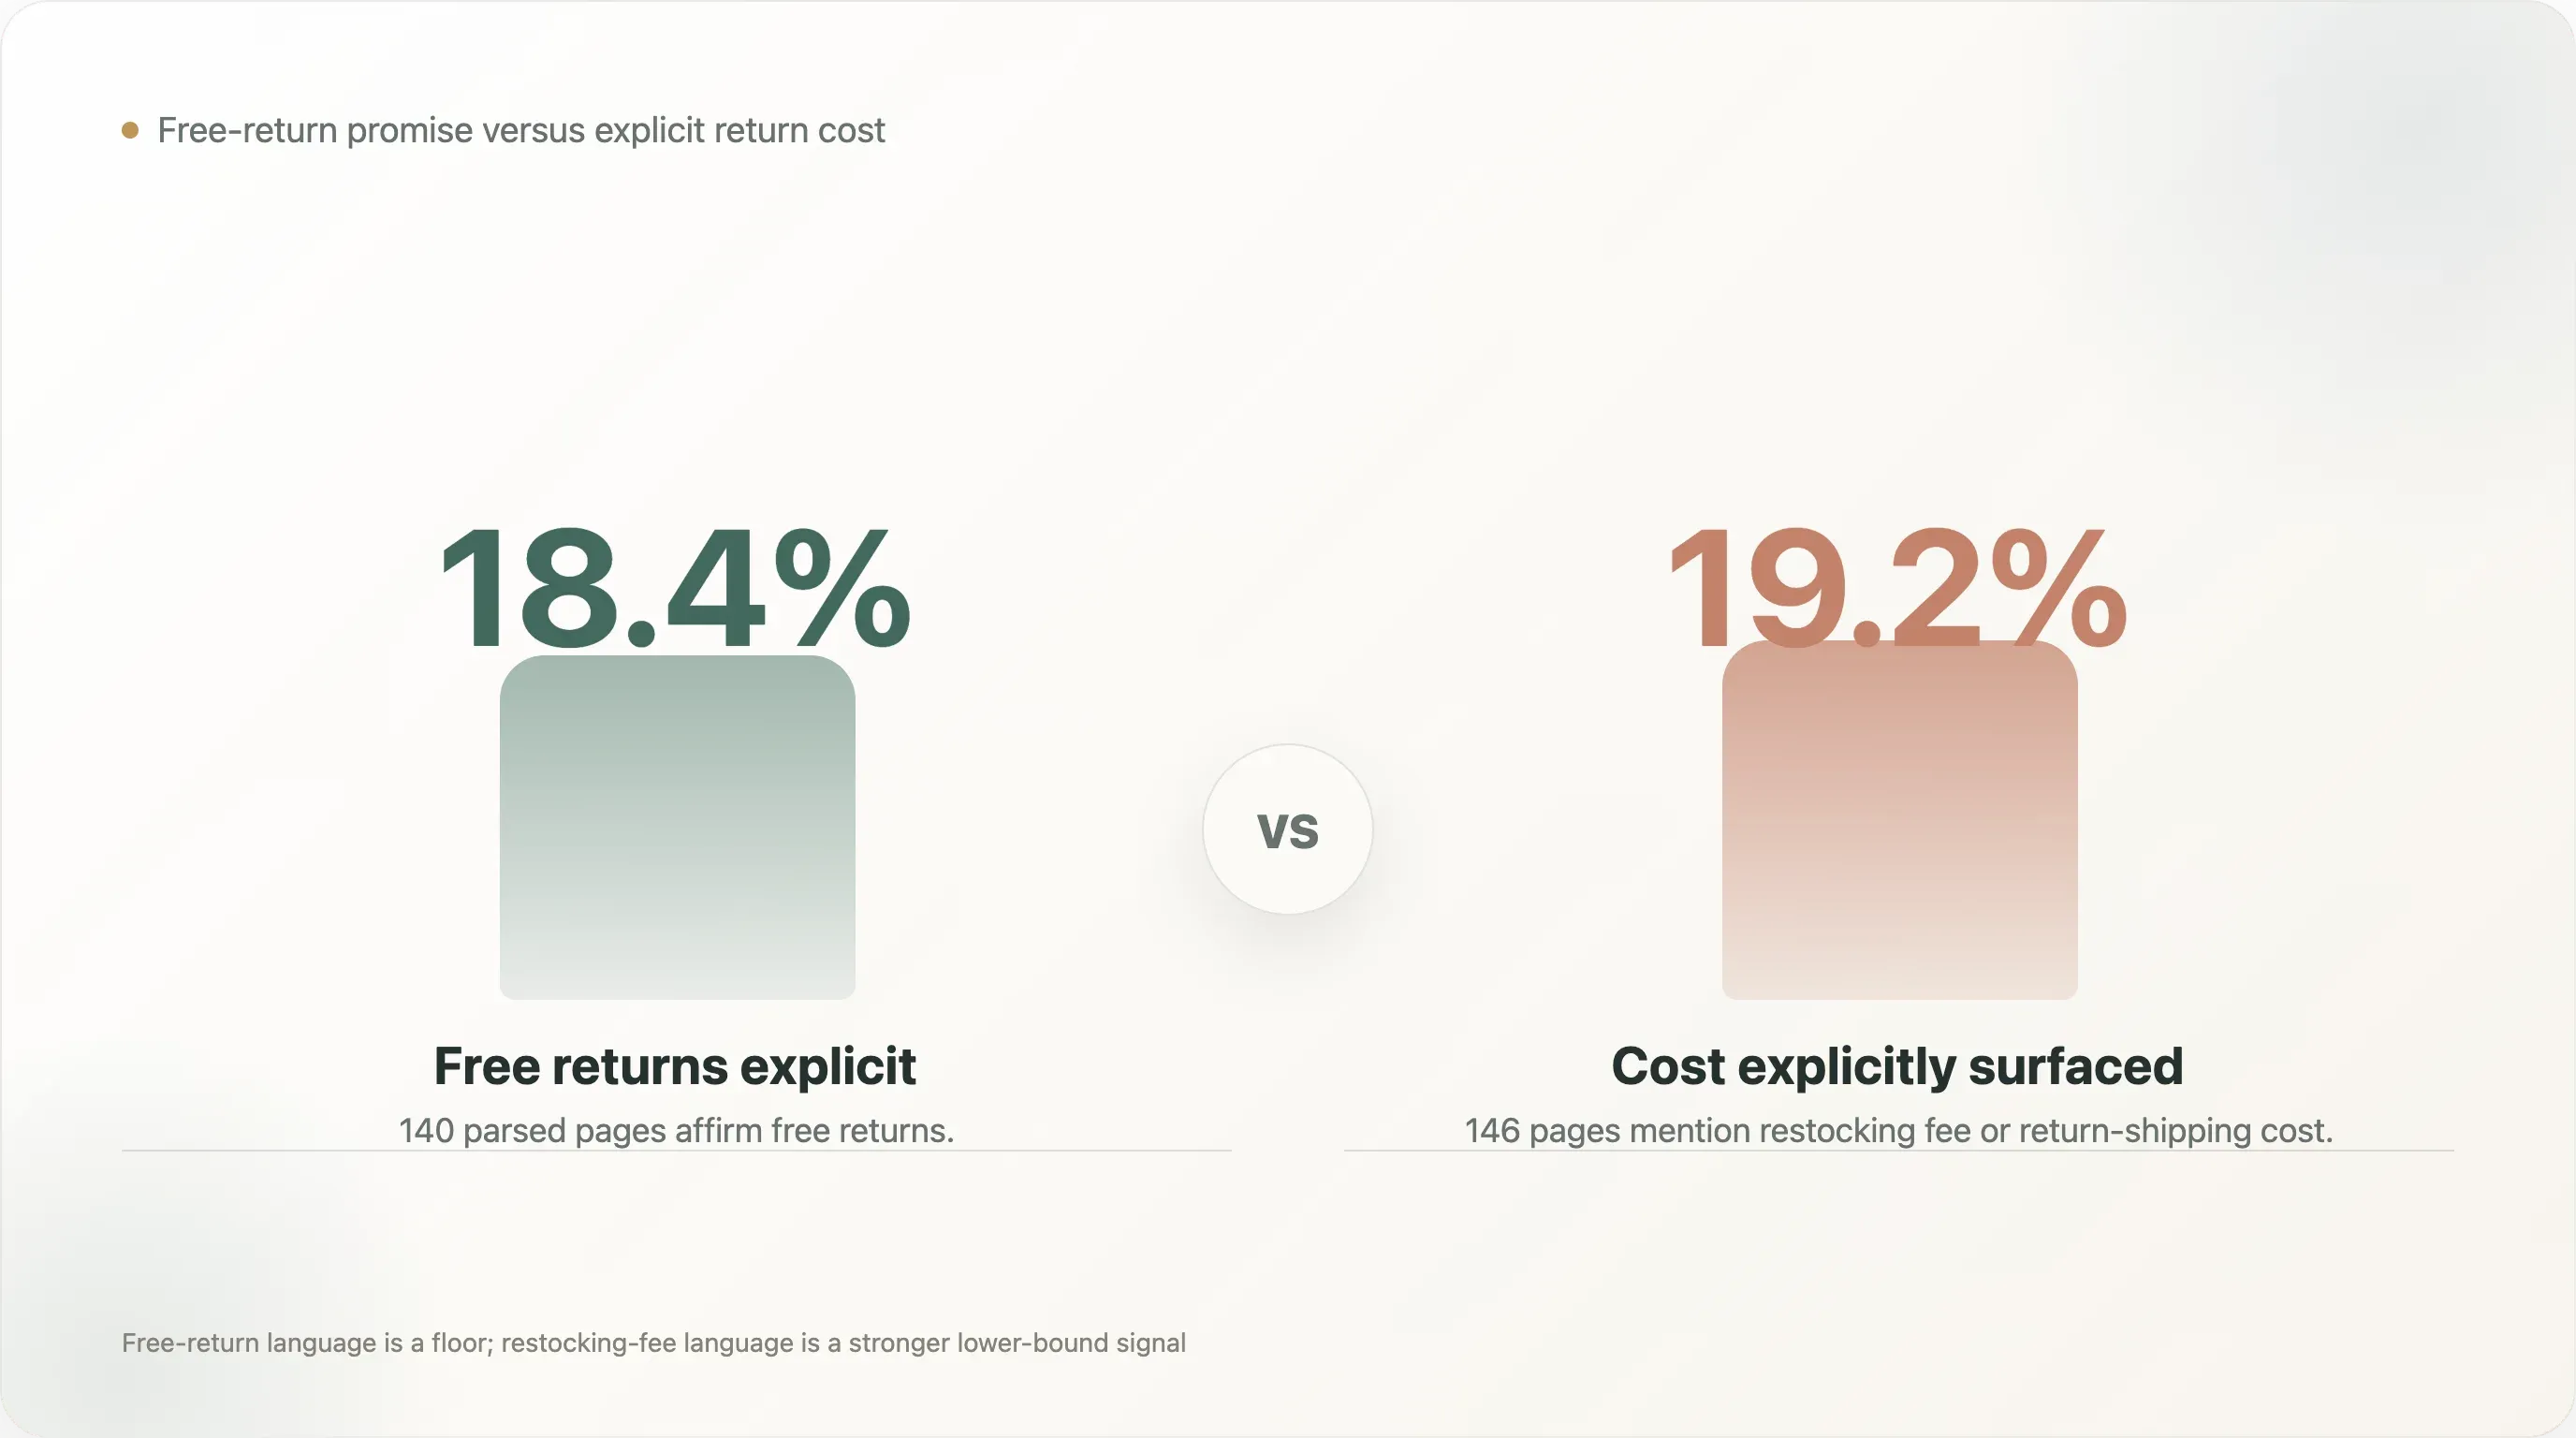
The core finding is that DTC returns remain customer-friendly in tone but are more controlled in policy than many shoppers assume. Only 18.4% of parsed pages explicitly say free returns, while 19.2% explicitly surface a restocking fee or return-shipping cost.
The stricter signals are widespread. 50.1% require original packaging or tags, and 39.9% include a final-sale clause. The median explicit return window is still 30 days, but the surrounding clauses often narrow how generous that window feels in practice.
Loop is the clear detected leader in returns SaaS, appearing on 80 parsed pages, or 10.5% of the parsed sample. Most returns pages do not expose a recognizable vendor host in static HTML, so the vendor numbers should be treated as visible lower bounds.
The Most Shareable Findings
-
761 returns pages were successfully parsed from the 1,148-brand DTC pool.
-
18.4% explicitly affirm free returns on the returns page.
-
19.2% explicitly mention a restocking fee or return-shipping cost.
-
50.1% require original packaging or tags.
-
39.9% include a final-sale clause.
-
Among pages with an explicit return window, the median is 30 days.
-
Loop appears on 80 parsed returns pages, far ahead of Narvar, Shopify Returns, Happy Returns, and other detected vendors.
Returns are one of the few parts of e-commerce where the customer and the operator often remember completely different eras. Shoppers remember the early DTC promise: try it at home, send it back easily, and let the brand absorb the inconvenience. Operators remember the 2024-2026 math: higher shipping costs, higher return fraud, tighter margins, more discounting, and inventory that does not always come back in resellable condition.
That tension is why returns policy data is useful for a blog audience. It takes a vague customer-experience debate and turns it into concrete clauses. How many brands explicitly offer free returns? How many ask for original packaging? How many carve out final-sale items? How many use a third-party returns platform? The answers show a category that is still customer-friendly in tone but much more controlled in policy than the old DTC stereotype suggests.
The through-line is not "DTC brands have become hostile to customers." The better reading is that returns have become a margin-management system. The policy page is where brand promise, logistics cost, fraud prevention, resale economics, and customer trust all meet.
Consumers carry a default mental model of DTC return policies: 30 days, free return shipping, no questions asked, keep the tags on. That model was set in 2010-2017, during the first DTC wave — Warby Parker's 5-day home try-on, Zappos' 365-day free returns, Bonobos' "we pay both ways." It became the reference point a generation of e-commerce operators used as their own default.
We wanted to test whether that picture still holds. From 1,148 DTC brands' returns / refund pages, we scanned what the policies actually say — how many days, whether there's a restocking fee, whether original packaging is required, whether final-sale clauses apply, whether refunds are in cash or store credit. Two findings made us stop and re-check.
First, only 18.4% of returns pages explicitly say "free returns". Of 761 parsed pages, 140 contain the phrase. That's a lower bound — many brands' default is free but they don't reaffirm it on the returns page (either it's an assumed default or it lives on a marketing landing page elsewhere). But even accounting for under-reporting, the share of DTC brands that actually do free returns is almost certainly far smaller than the public's "most of them do" assumption. "Free returns" has migrated from a default DTC norm to a marketed differentiator — no longer an implicit promise.
Second, 19.2% explicitly write a restocking fee or return shipping cost into the returns page. This metric is harder to false-positive — once a page writes "$X restocking fee" or "return shipping is the customer's responsibility," the policy is explicit. 146 brands surface this on the returns page, meaning at least 19.2% of DTC brands actually charge for returns. This is an under-reported industry trend — for years DTC consensus held that charging restocking fees would drive away customers; in 2024-2026 that consensus is quietly loosening.
A few more numbers fill out the picture. 50.1% require original packaging or tags — close to half. 39.9% include a final-sale clause — certain categories (discounted items / intimates / cosmetics / custom orders) simply can't be returned. Loop Returns owns 10.5% of the returns SaaS market (80 brands) — all other detected vendors combined don't reach a quarter of Loop's count. That mirrors exactly the Gorgias-dominates-DTC-customer-support pattern we documented in our May 12 report — same business model, different market.
Stacking these together, the 2026 reality of DTC returns is meaningfully stricter than the consumer mental model of "30 days, free, no questions" — and meaningfully more restrained than the large-company PR narrative of "customer experience first." Below we unpack each layer.
1. Half require original packaging, 41% have final-sale clauses
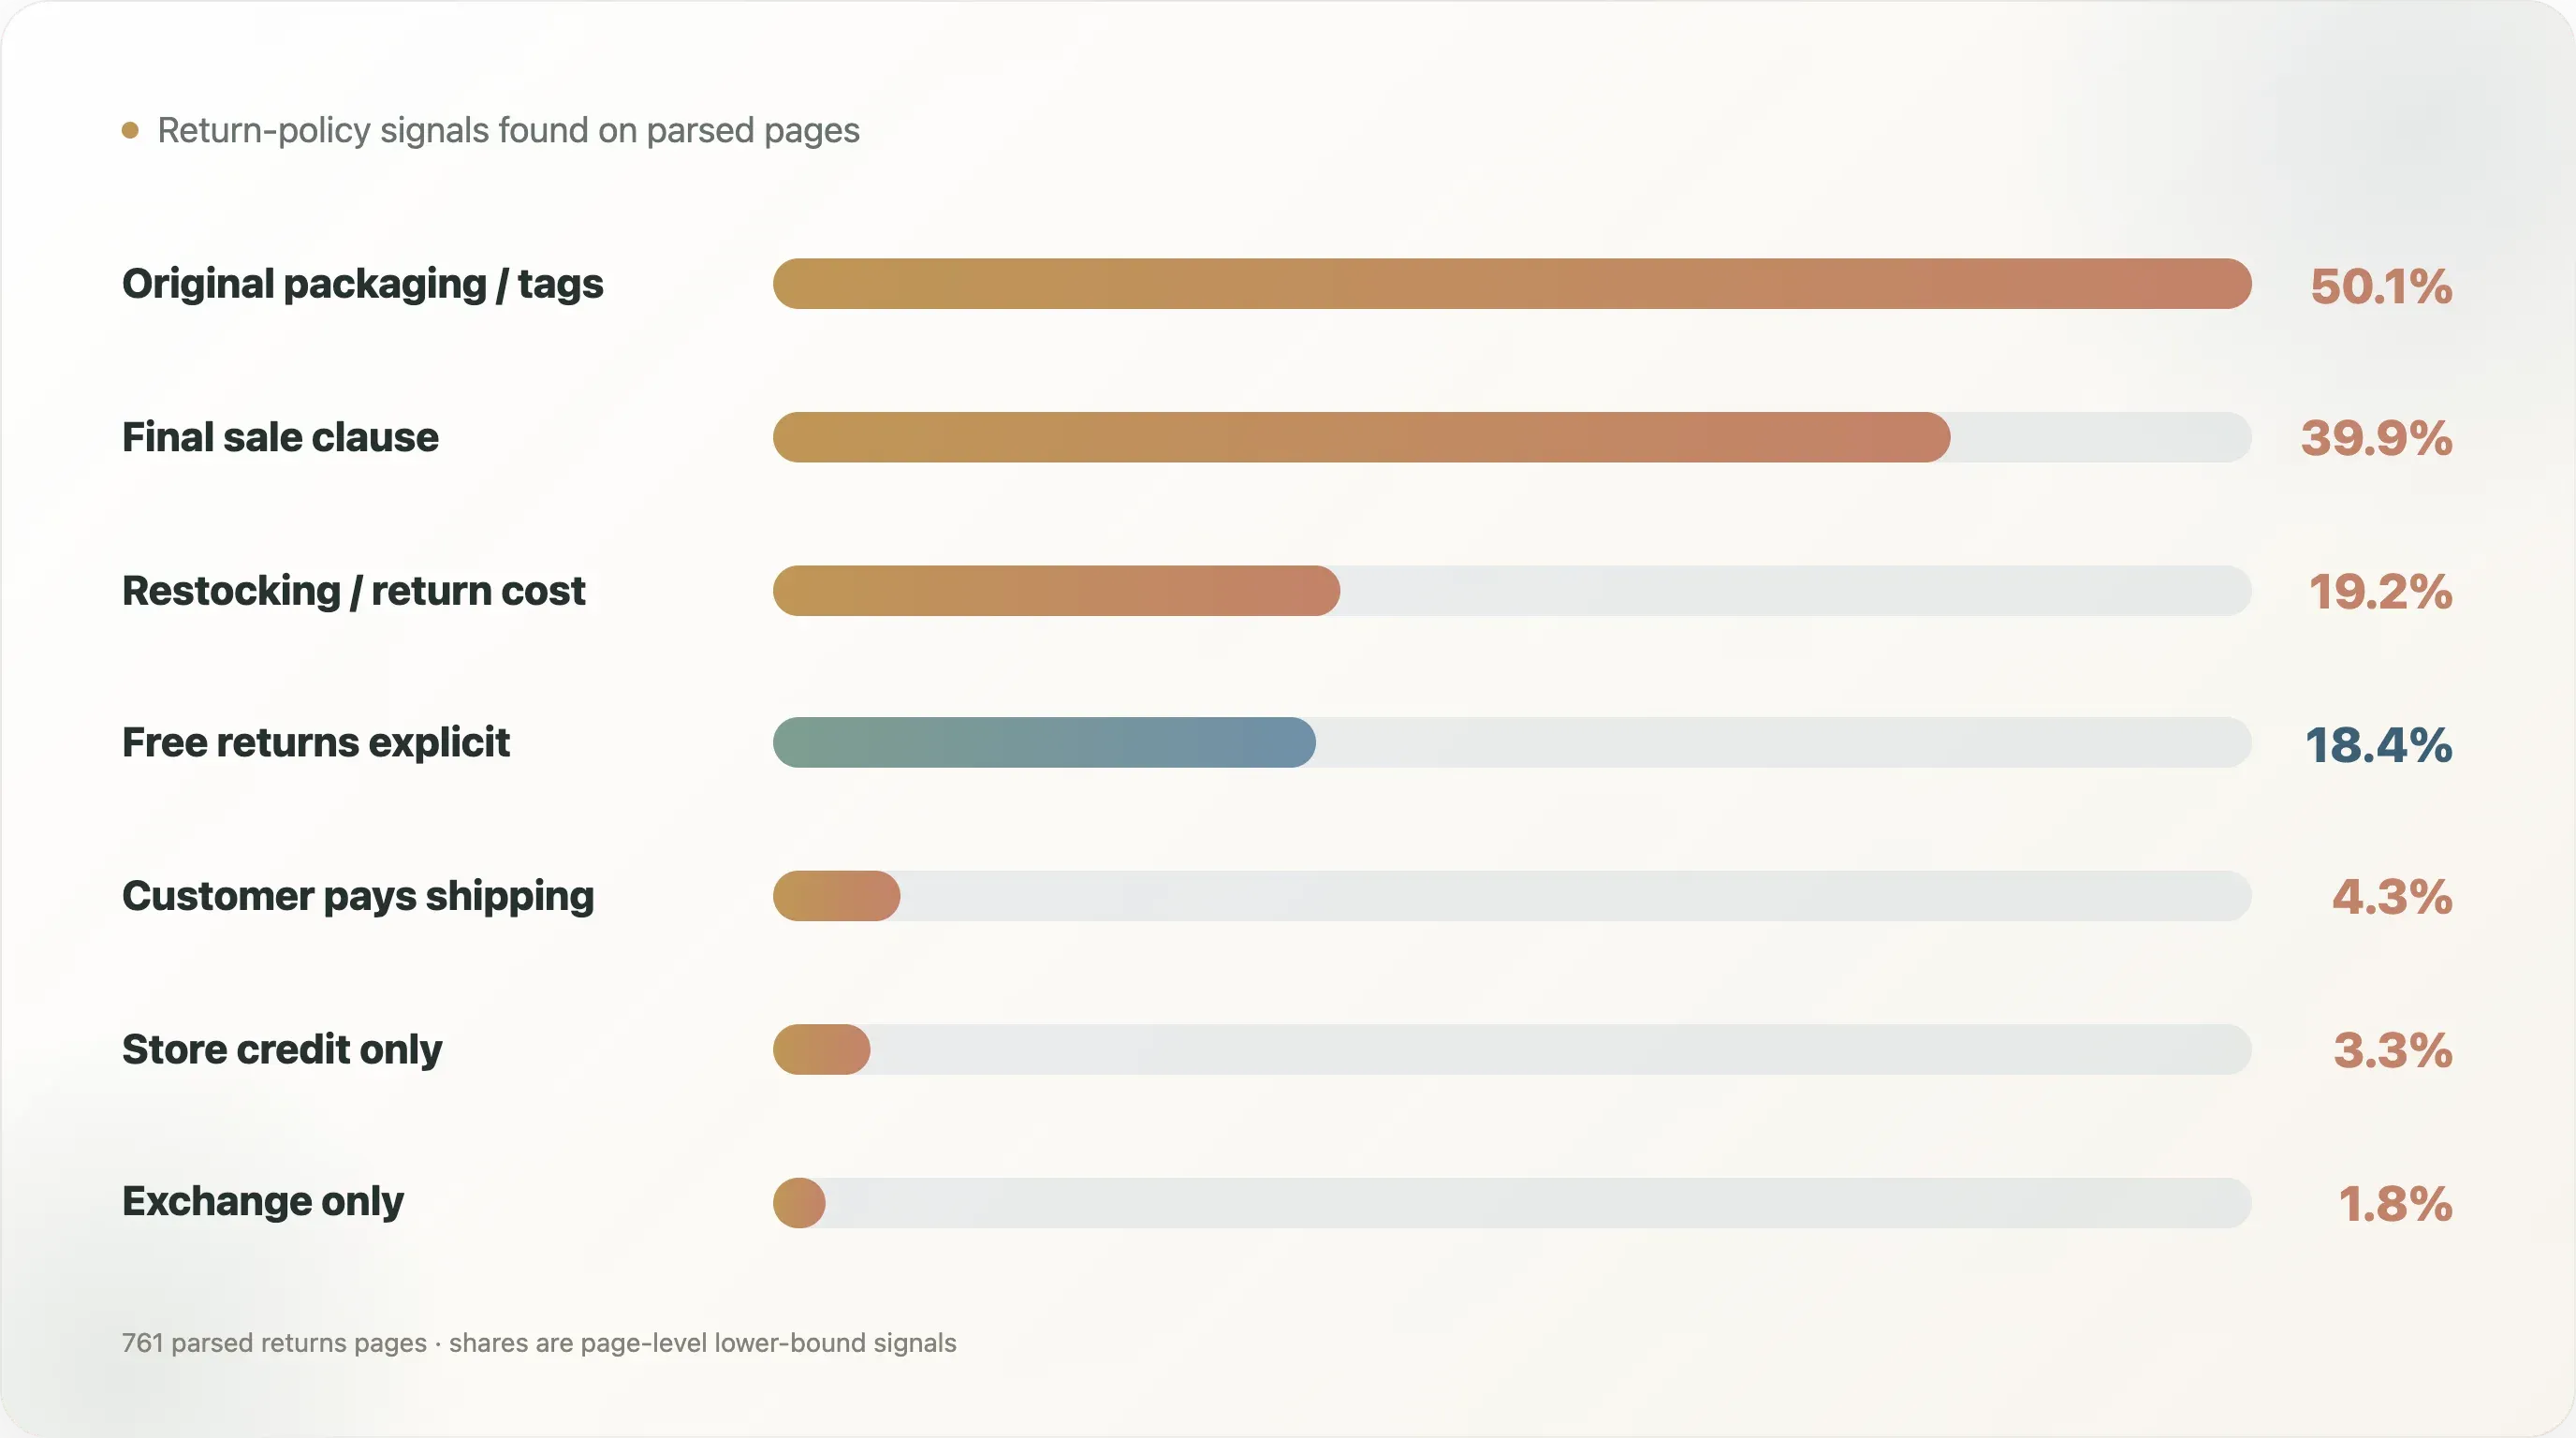
Scanning 761 returns pages, the hit rates for 7 core policy signals:
| Policy signal | Brands | Share |
|---|---|---|
| Free returns explicit | 140 | 18.4% |
| Restocking fee / return shipping cost | 146 | 19.2% |
| Customer pays return shipping (explicit) | 33 | 4.3% |
| Original packaging / tags required | 381 | 50.1% |
| Final sale clause | 304 | 39.9% |
| Store credit only | 25 | 3.3% |
| Exchange only | 14 | 1.8% |
A few numbers deserve standalone treatment. 50.1% requiring original packaging or tags is the most under-noticed line in this data — and the most defensible. This metric isn't a false-positive risk because "keep your original packaging" only ever appears on the returns page, never on marketing pages. Half of DTC brands treat original packaging as a precondition for returns. That means peeling the label off or tossing the box is a real cost to the buyer — you either decide to keep the item or return it with all the packaging intact; there's no allowed middle state of "opened but unused." For buyers who shop "try first, decide later," that's meaningful friction.
The 39.9% with final-sale clauses deserves a closer look. Final sale is the "once bought, no returns" condition, typically applied to discount items, intimates / swimwear, cosmetics, custom orders, and intimate-use accessories. 304 DTC brands surface this on returns pages, meaning nearly half of DTC brands carve out categories that simply can't be returned. This is operational wisdom DTC has absorbed over the past few years — final-sale isn't about punishing customers; it's about controlling return-loss cost (returnable inventory isn't just the shipping cost; it's the resaleability discount on the returned item too). But it's a seller self-protection clause, not a customer-experience-first design.
19.2% writing a restocking fee is the more interesting newer signal. 146 DTC brands surface a restocking fee or return-shipping cost on the returns page — typically $5-15 flat, or sometimes a 5-15% order percentage. This is a trend that DTC was reluctant to be open about pre-2024 — "charging restocking fees drives away customers" was the consensus. In 2024-2026 that consensus is loosening — more brands are concluding that being explicit about fees is more sustainable long-term than hiding return costs while marketing free returns. The 19.2% who write it explicitly is a floor; the actual share charging something is likely higher (some brands charge return-shipping costs without using the words "restocking fee").
2. Median return window is 30 days, but 16 brands sit under 14
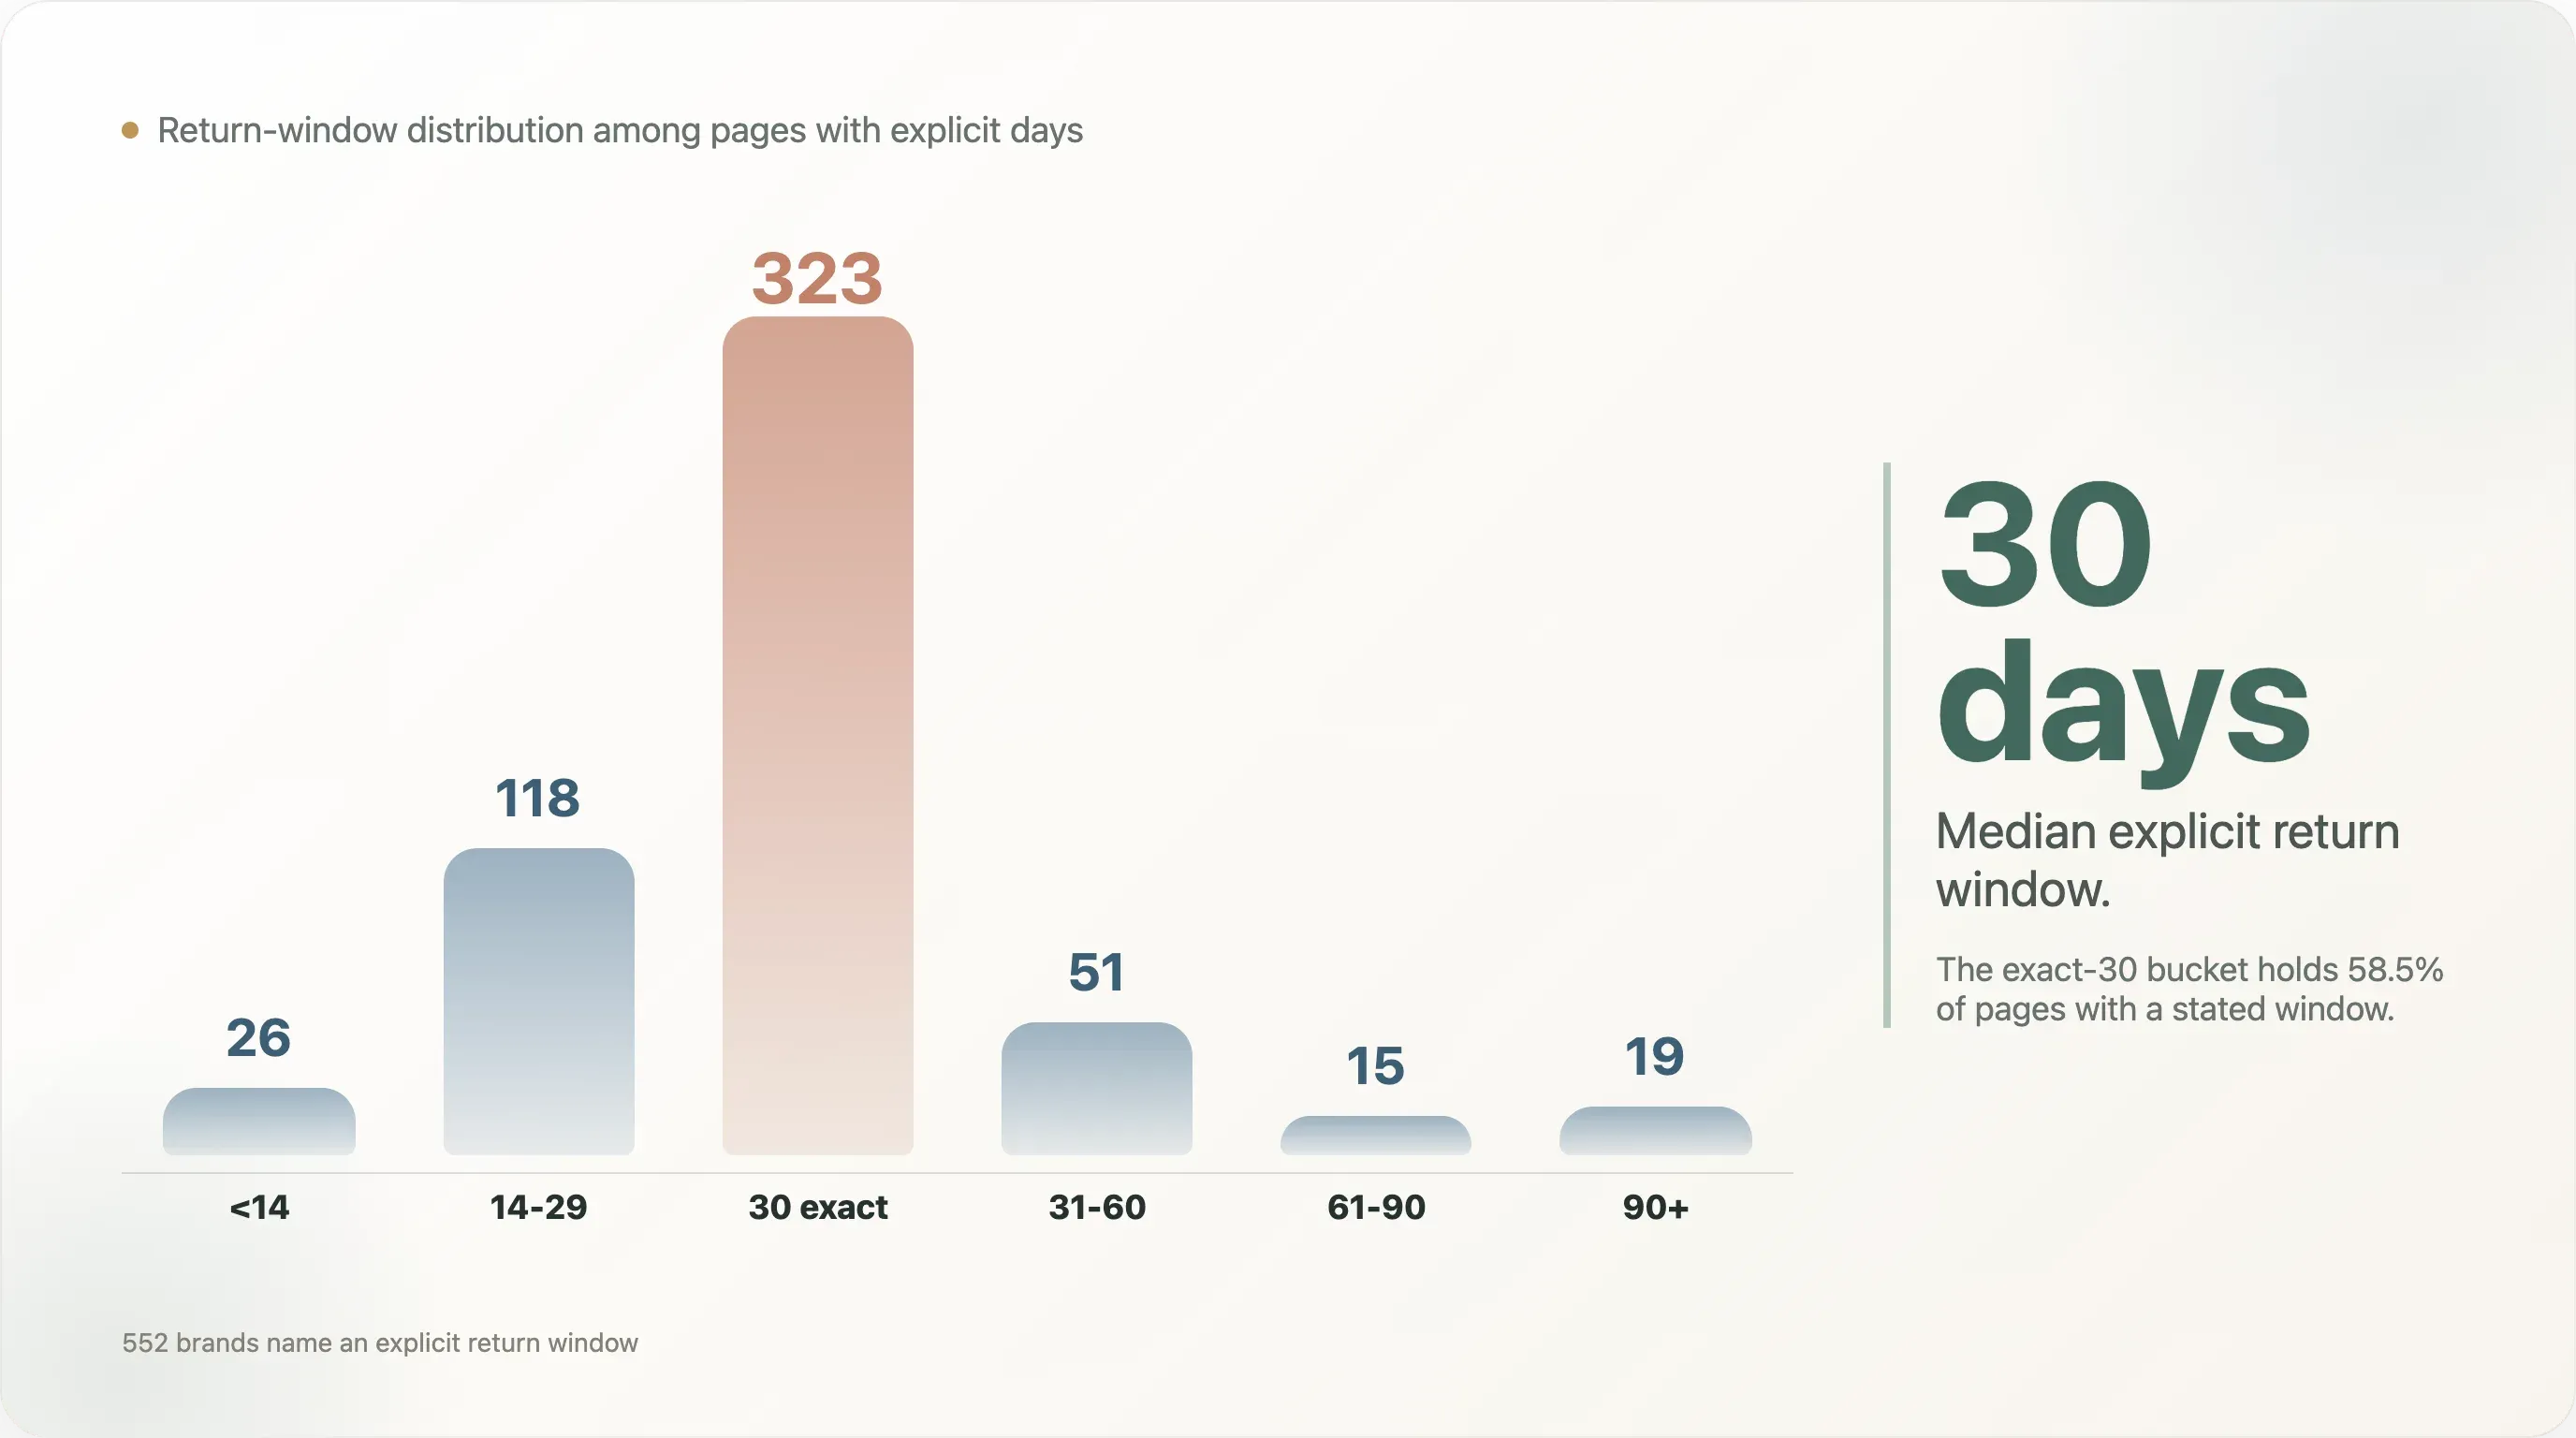
Among the 552 brands that name an explicit return window, the distribution:
| Window | Brands | Share |
|---|---|---|
| <14 days | 26 | 4.7% |
| 14-29 days | 118 | 21.4% |
| 30 days exact | 323 | 58.5% |
| 31-60 days | 51 | 9.2% |
| 61-90 days | 15 | 2.7% |
| 90+ days | 19 | 3.4% |
Median is 30 days. The exact-30-day bucket holds 323 brands — 58.5% of all brands with an explicit window. That concentration tells you something: 30-day returns has become the default anchor in DTC. Most brands aren't choosing 30 days after careful ROI math; they're choosing 30 days because that's what peers chose.
The tails are more interesting. The 26 brands under 14 days are typically low-AOV fast-moving categories (food / supplements / personal care) or brands pairing a short window with final-sale terms. The 19 brands at 90+ days are usually high-end furniture, high-AOV categories, or companies deliberately making generous returns an employer-brand differentiator (think 100-day try-before-you-buy on sleep products).
Operator takeaway: 30 days is the default anchor, but deviating from it is a brand decision. Shorter than 30 says "our product category doesn't support extended try-out." Longer than 60 says "we're confident enough in our product that you won't want to return." The first bet is that customers accept the tradeoff. The second is that return rates stay manageable. Both can work — when product and audience support them.
3. Composite strictness: median 3, but 11% land in strict territory
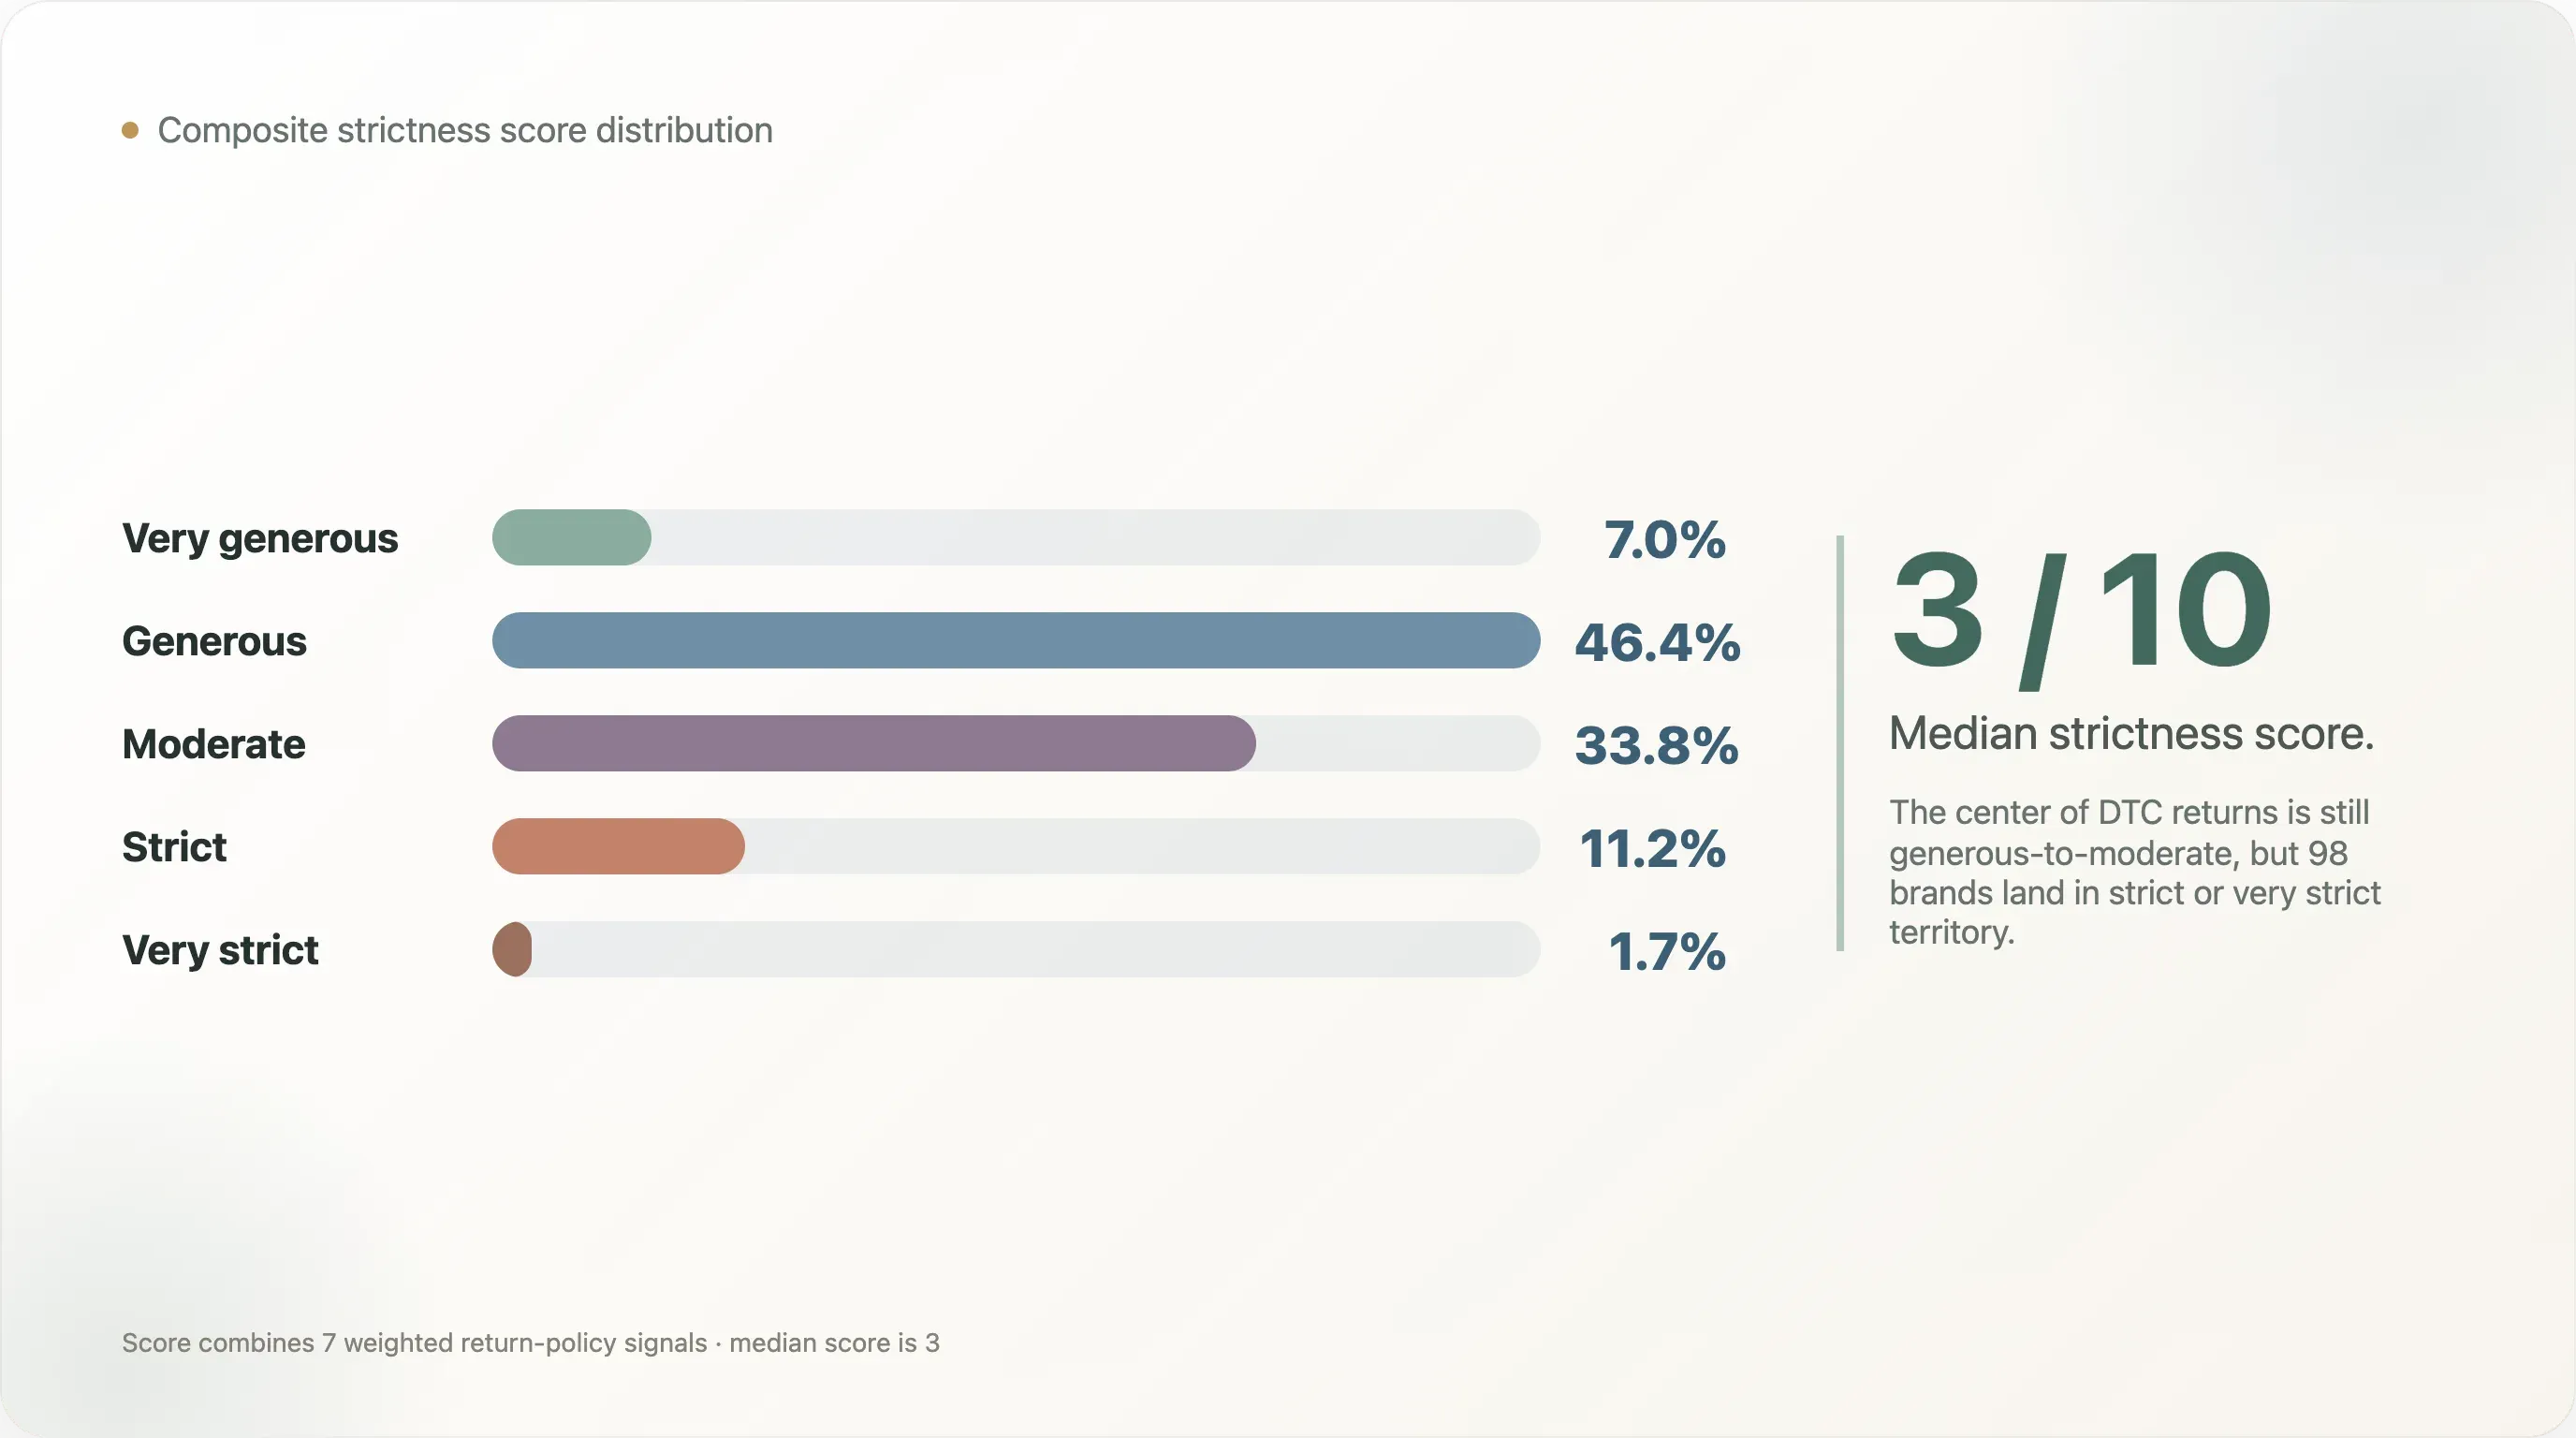
Combining 7 policy signals into a 0-10 strictness score (0 = fully generous, 10 = maximally strict), the distribution:
| Bucket | Brands | Share |
|---|---|---|
| very_generous (0-1) | 53 | 7.0% |
| generous (2-3) | 353 | 46.4% |
| moderate (4-5) | 257 | 33.8% |
| strict (6-7) | 85 | 11.2% |
| very_strict (8-10) | 13 | 1.7% |
Median is 3 — "slightly generous" is the default DTC shape. 353 brands sit in the 2-3 bucket; 257 in 4-5. The tails tell the most informative story.
7.3% sit at 0-1 (53 brands) — genuinely generous. Free returns + long window + no restrictive clauses. These tend to be high-end home goods, subscription products, or early DTC brands building generous returns into brand DNA.
1.9% sit at 8-10 (13 brands). This combination is rare — simultaneous restocking fee + short window + final-sale carve-outs + store-credit-only. Such extreme strictness isn't typical in DTC because customers will switch brands. But it exists, suggesting these brands' repeat rates are high enough that return friction doesn't deter new buyers — typically supplement subscriptions, beauty subscriptions, or niches where customer stickiness is unusually high.
The most under-noticed bucket is the strict (6-7) zone at 10.2% (85 brands). These aren't maximally strict; they're "quietly tightening without making it obvious." They haven't stacked restocking fee + store-credit-only + final-sale into one policy — but they have at least 2-3 restrictive clauses combined: shorter window + original packaging required, or restocking fee + customer pays shipping. This is where the real DTC returns trend lives — not an industry-wide swing to strict, but the middle 10% quietly drifting from generous toward neutral.
4. Loop owns 80% of the returns SaaS market we can detect
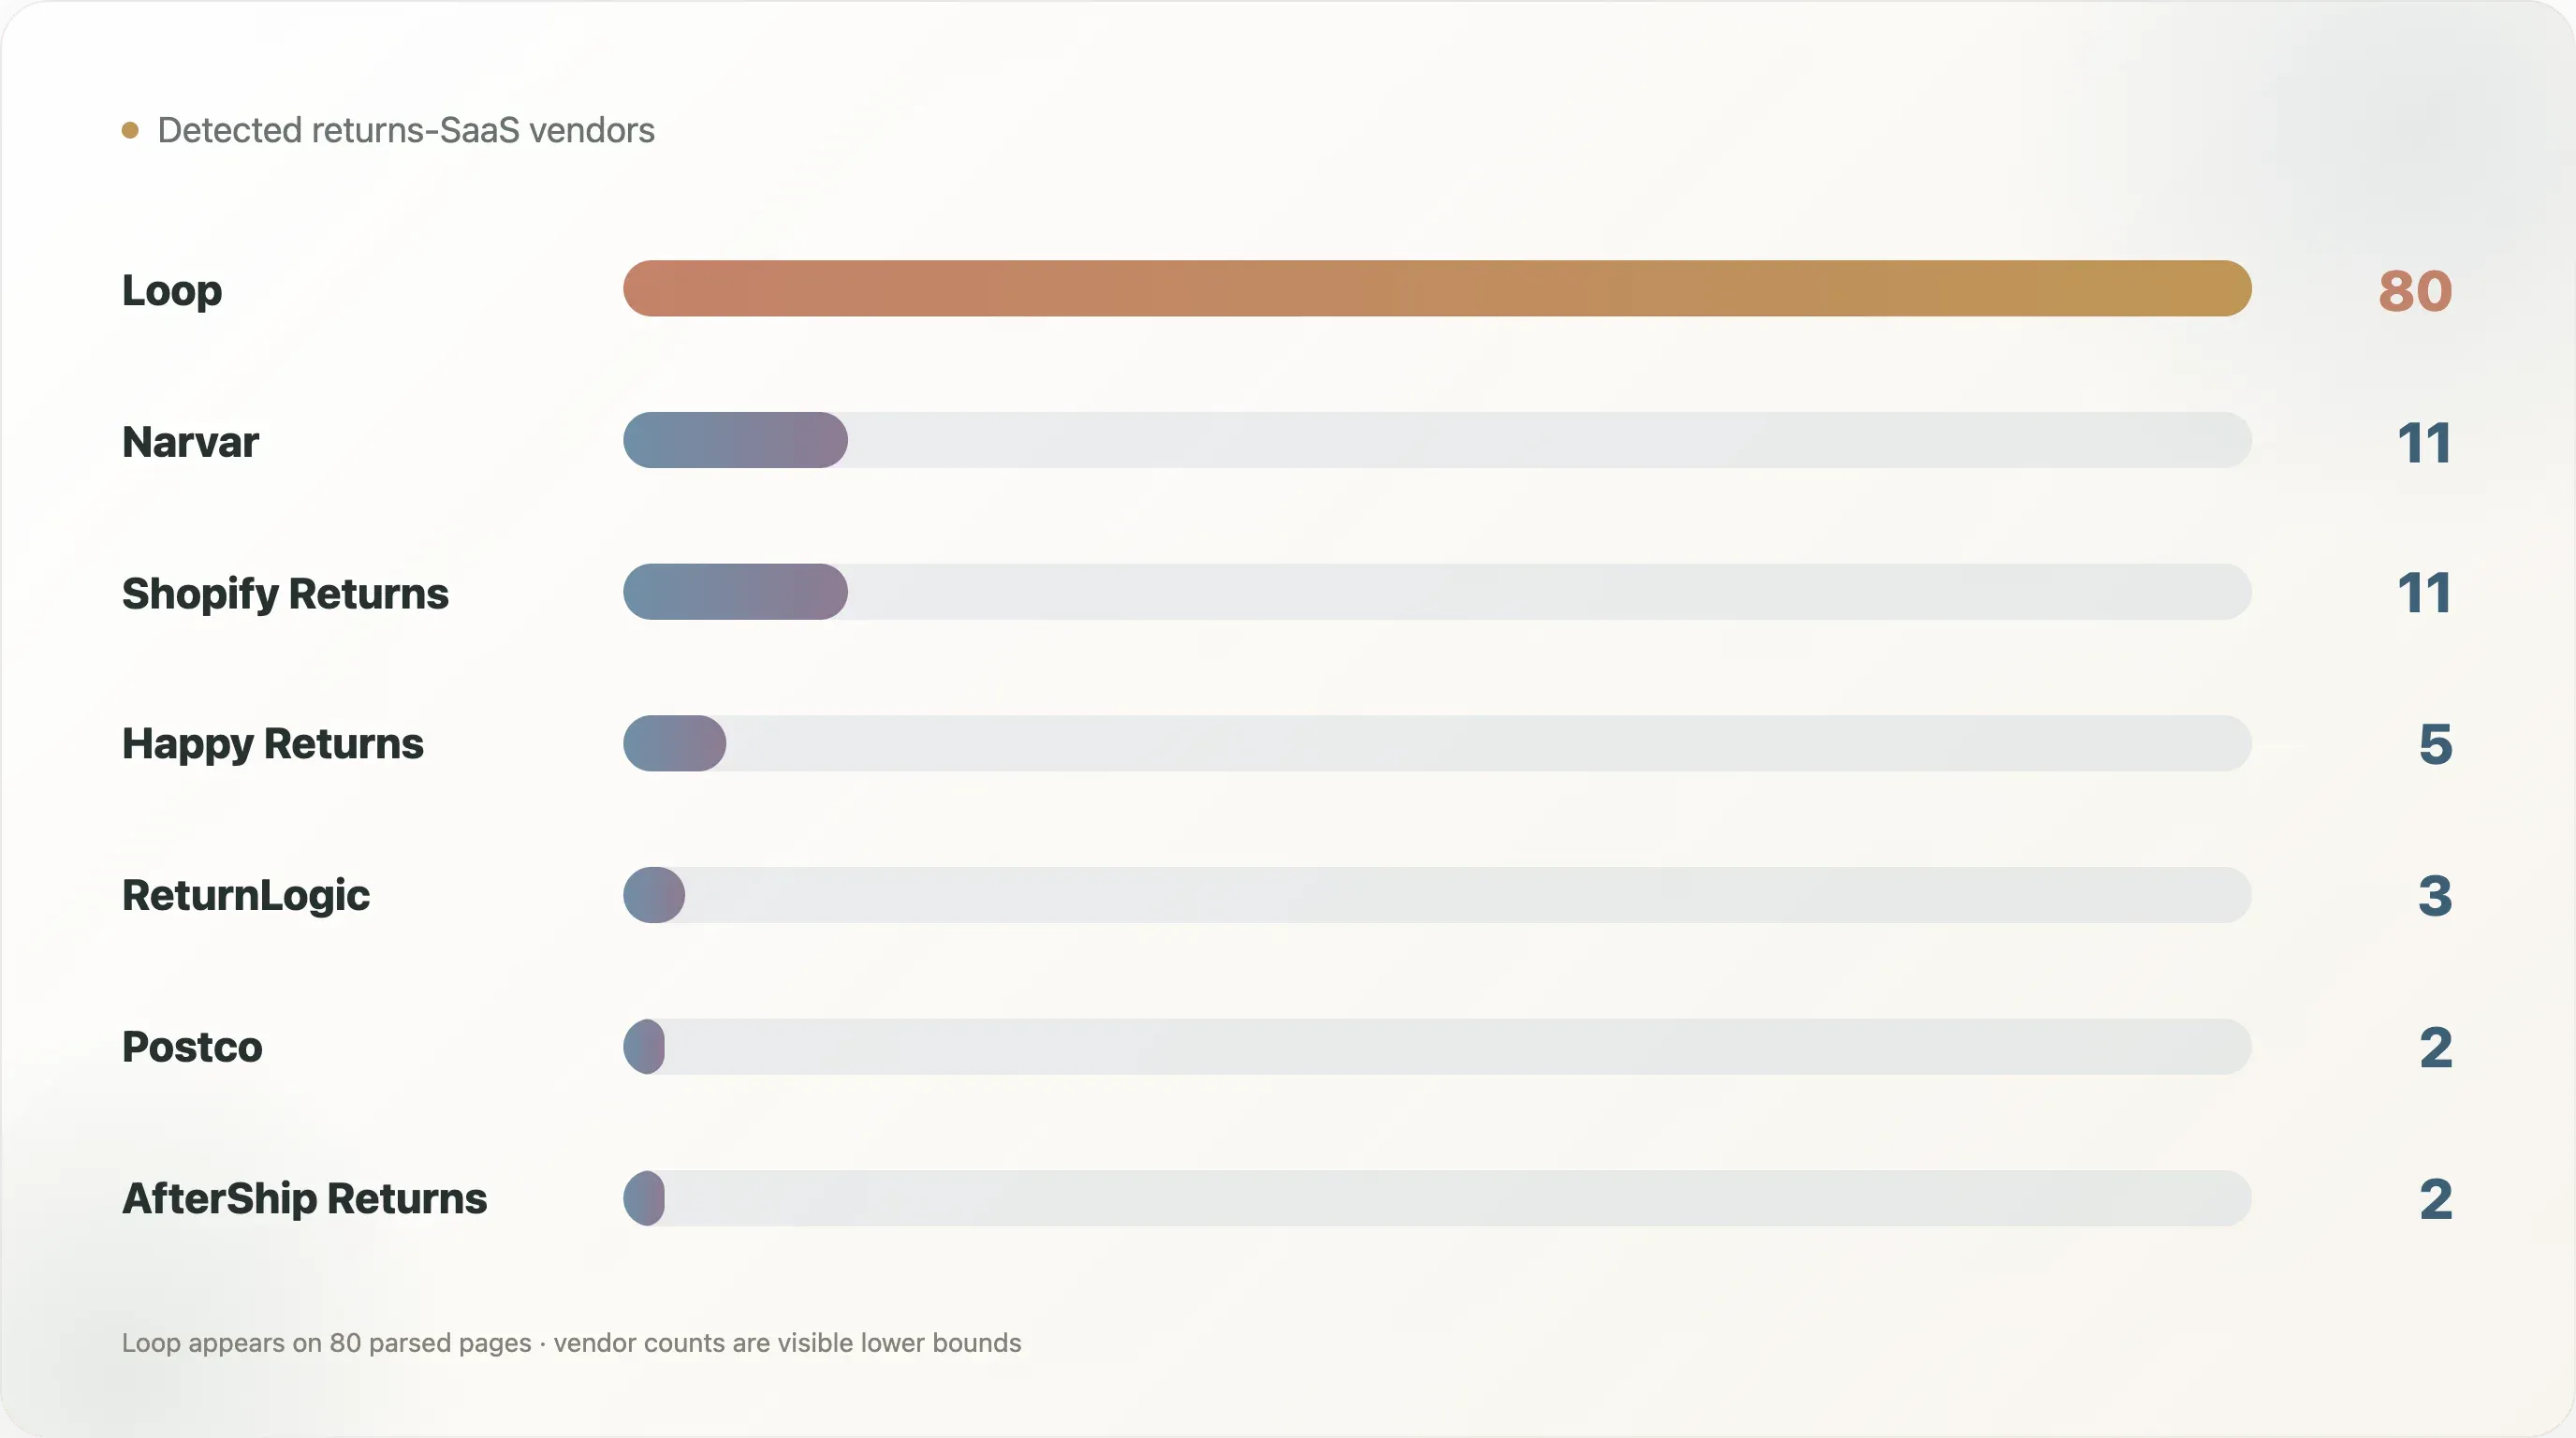
We checked returns pages for returns-SaaS vendor fingerprints — i.e., which third-party tool a brand outsources its returns workflow to:
| Vendor | Brands | Share of all parsed |
|---|---|---|
| Loop | 80 | 10.5% |
| Narvar | 11 | 1.4% |
| Shopify Returns | 11 | 1.4% |
| Happy Returns | 5 | 0.7% |
| ReturnLogic | 3 | 0.4% |
| Postco | 2 | 0.3% |
| AfterShip Returns | 2 | 0.3% |
Two takeaways.
First, Loop holds roughly 70% of brands where we can detect any vendor (52/114). Every other detected vendor combined doesn't reach a quarter of Loop's count. This is the returns-SaaS version of the Gorgias-in-DTC-customer-support story we documented in our adjacent report — same business model replicated in a different market. Loop's position in DTC returns mirrors Gorgias's position in DTC customer support: Shopify-native + deep order-data integration as the moat.
Second, the vast majority of DTC brands' returns pages reveal no vendor signal. 647 brands (85.0% of parsed) don't surface a recognizable returns-SaaS host in static HTML. Two possible reasons. One: these brands use Shopify-native returns or roll their own internal returns backend, with no third-party host exposed on the page. Two: vendor JS chunks load dynamically and our static scan misses them. Either way, the actual penetration of Loop / Narvar / Happy Returns is likely higher than this report shows — but Loop's relative leadership is the robust finding.
For DTC operators picking returns SaaS: Loop is the default (most peers use it, deepest Shopify integration). Differentiation alternatives: Narvar holds presence in omnichannel large brands; Happy Returns runs a physical drop-off model (customers return at UPS Store locations). The three products have meaningfully different philosophies — choosing among them is fundamentally choosing whether your customer's return experience is all-online or physical drop-off hybrid.
5. Which DTC brands still run "genuinely generous" returns
Brands in our sample with a strictness score ≤ 2 and explicit free-returns language — the DTC brands actively choosing generous in 2026:
| Brand | Return window | Strictness |
|---|---|---|
| boardroomsocks.com | 90 days | 0/10 |
| carters.com | 90 days | 0/10 |
| boatoutfitters.com | 60 days | 0/10 |
| duradry.com | 60 days | 0/10 |
| gainsinbulk.com | 60 days | 0/10 |
| naturopathica.com | 60 days | 0/10 |
| beardbrand.com | 120 days | 1/10 |
| pairofthieves.com | 101 days | 1/10 |
| blueland.com | 100 days | 1/10 |
| trueclassic.com | 100 days | 1/10 |
| studs.com | 90 days | 1/10 |
| bedjet.com | 60 days | 1/10 |
| lalo.com | 60 days | 1/10 |
| thrivecausemetics.com | 60 days | 1/10 |
| andcollar.com | 45 days | 1/10 |
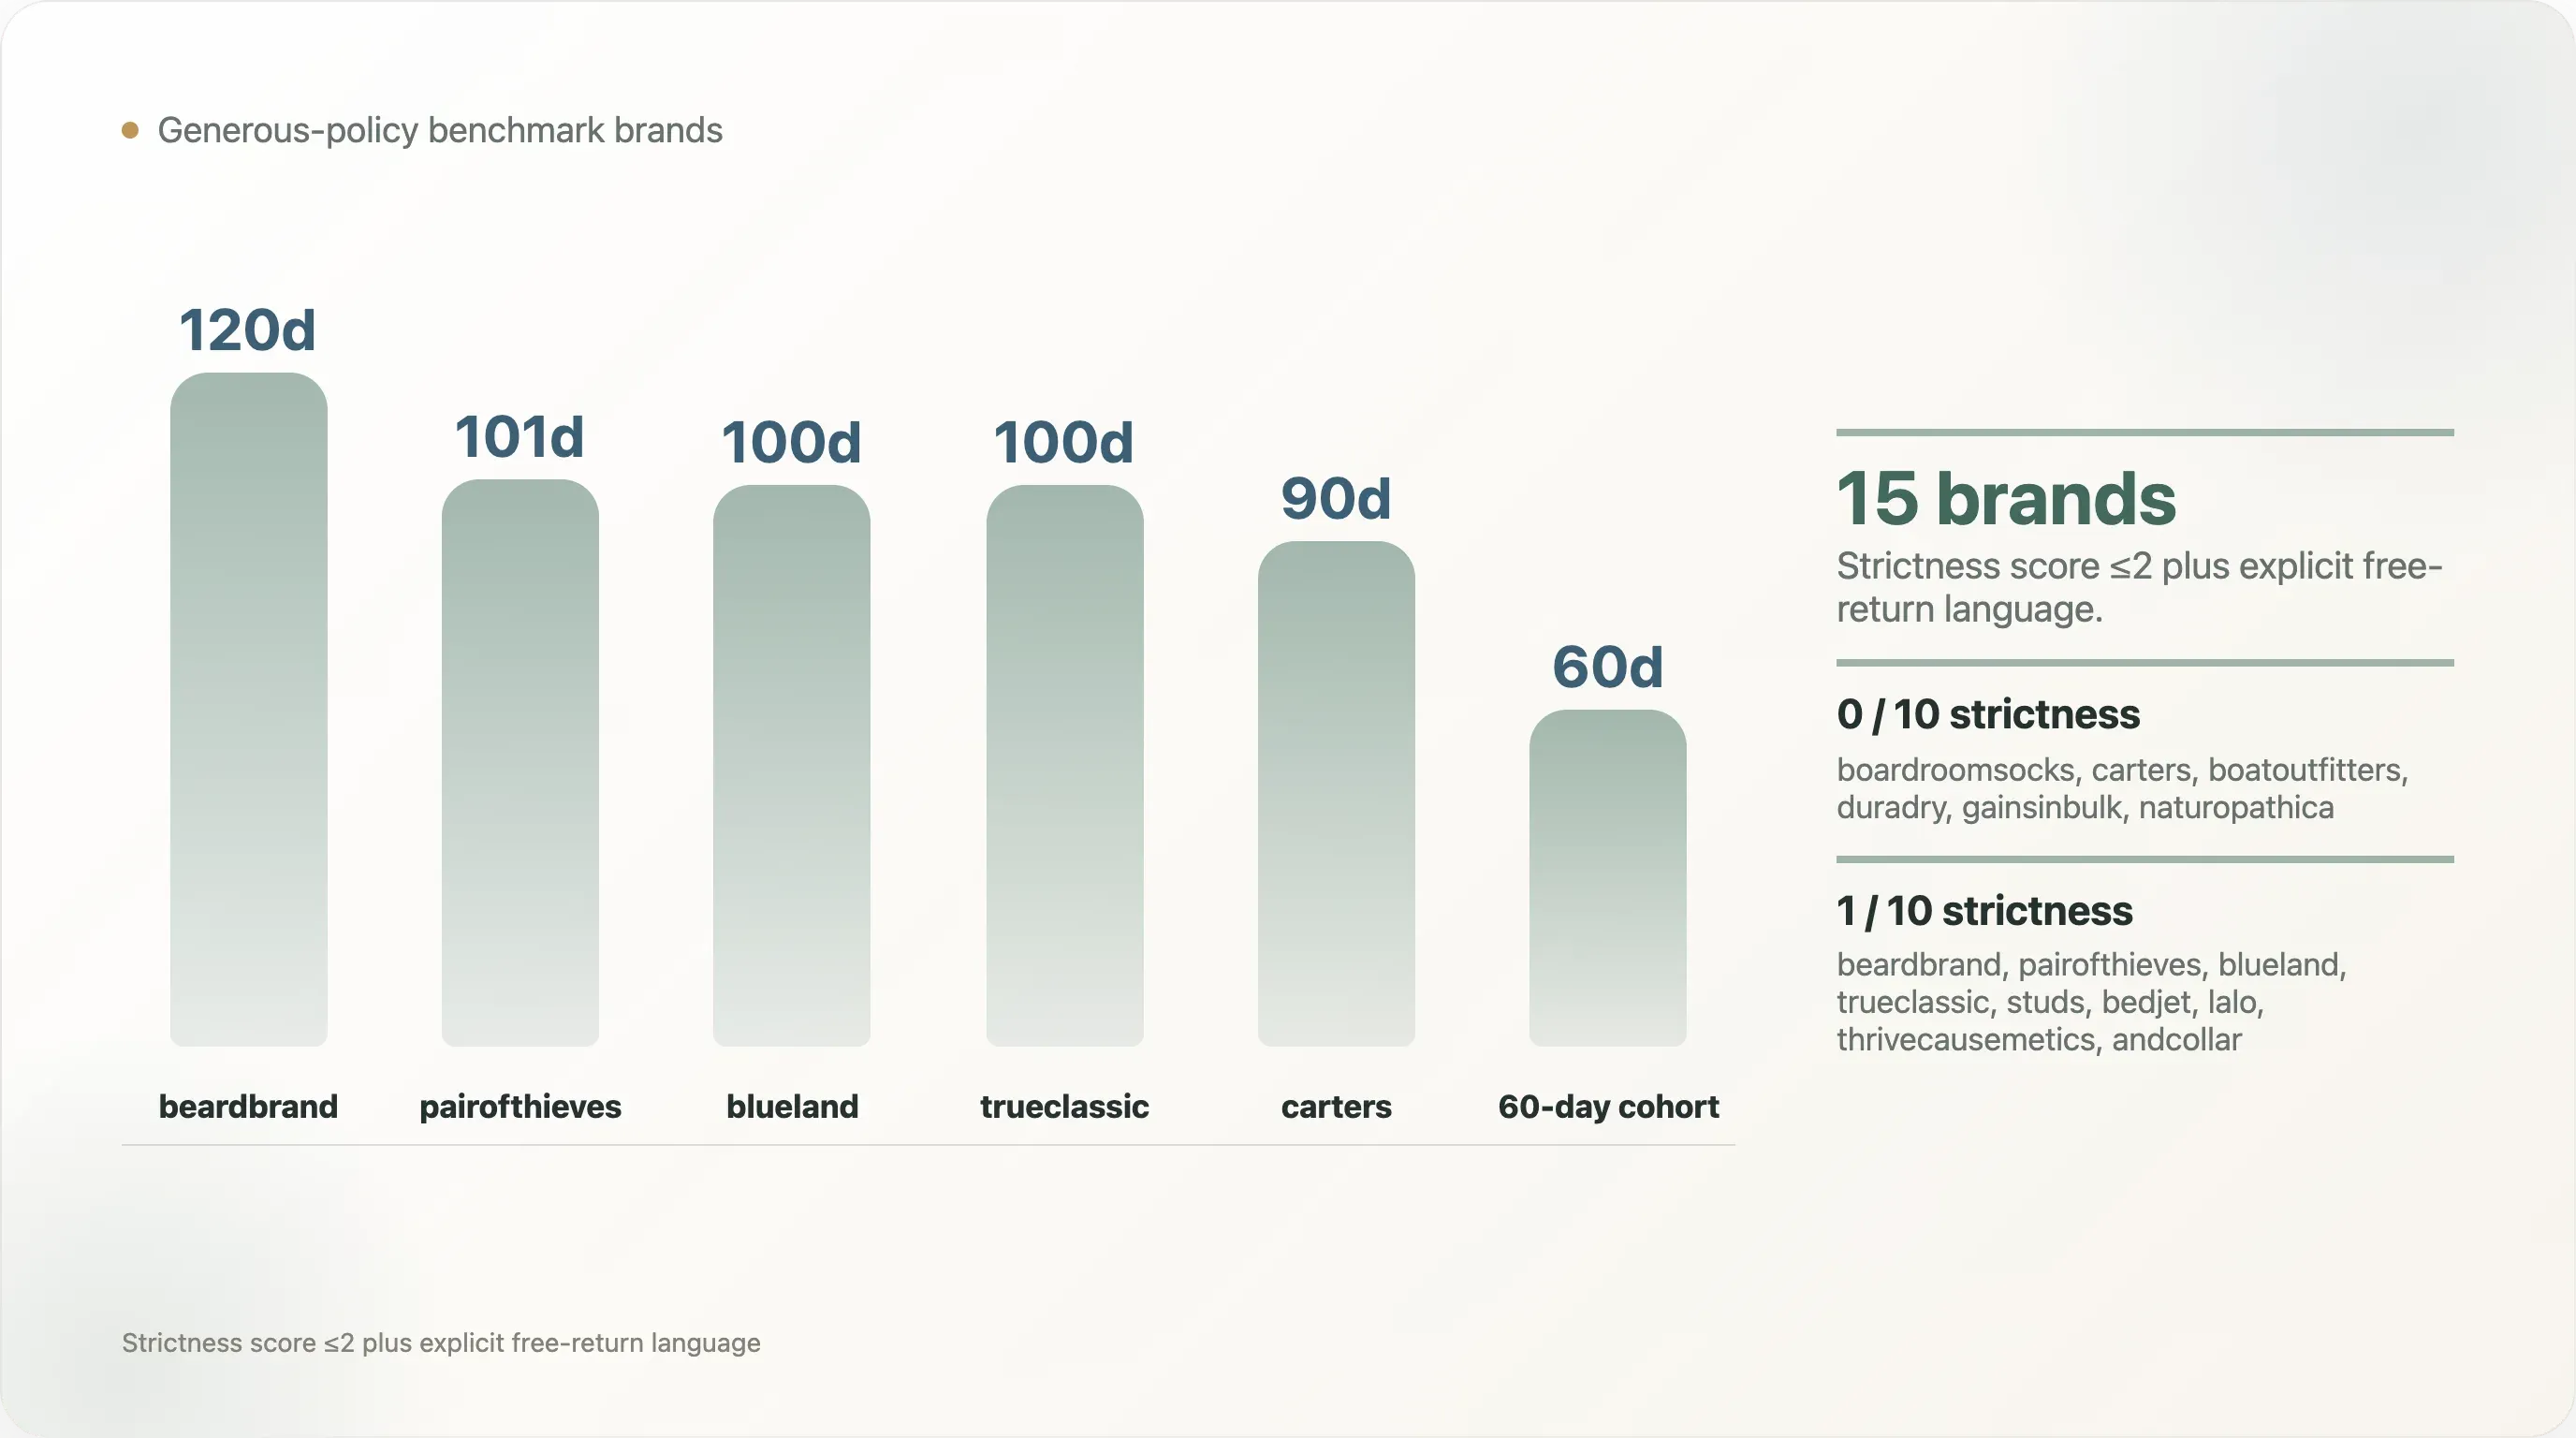
The value of this list isn't the ranking; it's the existence. It tells you that in 2026 a real subset of DTC brands has chosen generous returns as a brand asset — no restocking fee, no store-credit-only, long-enough window. These brands tend to share two traits: higher product prices (they can afford the return cost) and mature categories (they can absorb a known return rate).
For other DTC operators, the secondary value of this list is benchmarking — if your target customer expects this kind of experience, your returns policy needs to align. If your target customer is Amazon-price-sensitive, you can probably emulate the quietly tightening middle bucket instead.
6. How credible is this data, and where does it stop
We scanned returns / refund pages across 1,148 DTC brands, successfully parsing 761. The rest either had no findable returns page (404 / redirect to homepage / unstructured path) or returned a body shorter than 500 characters that we couldn't reliably parse. That missing ~40% is non-random — brands without a findable returns page tend to be early-stage DTC or pure dropshippers without a well-structured returns policy, and their policies are likely more lax than what shows up here. So this report likely understates the share of "casually-handled" returns policies.
Free returns at 18.4% is a floor, not a ceiling. This is the single highest-uncertainty line in the data. Returns pages don't typically brag "FREE RETURNS!" — that copy lives on marketing landing pages or product detail. So a brand's returns page not surfacing "free" doesn't mean returns aren't free. If you cite this number, say "at least 18.4% explicitly affirm free on the returns page," not "82% charge fees." The latter requires cross-referencing product pages for "free shipping both ways."
Restocking fee 19.2% and final sale 39.9% are directionally robust. These two signals are surfaced by the brand intentionally — no brand writes "we charge a $X restocking fee" unless the policy actually charges one. So 19.2% is a near-true lower bound. Same for 39.9% final-sale — it's brand-surfaced, so the number is grounded.
Brand pool tilts Shopify-ecosystem (67% of brands come from Shopify-stack case-study sources). The sample over-represents modern, marketing-led, Shopify-native DTC and under-represents legacy retail / mom-and-pop e-commerce. This is not the entire US DTC universe.
Wayback Machine historical comparison didn't work. We originally planned a 2023-01 vs 2026-05 trend comparison — but Wayback's historical coverage of Shopify returns pages is under 1%, far too sparse to support a trend narrative. So this report is a 2026-05 snapshot only; we don't claim direction over 12 months. To do a true time comparison, you need to rerun the same sample quarterly and build your own baseline over 12-24 months.
Strictness scoring is rule-based, not LLM. Seven weighted signals (window length / free-returns flag / restocking fee / customer pays / store credit only / exchange only / final sale). Rules are transparent and open. As with any rule-based scoring, there's false-positive / false-negative risk. If you cite "strict bucket = 10.2%," tag it as "by this report's rules."
One-line boundary: this report describes what's in returns-page static scans across our 1,148 DTC brand sample, not the US DTC industry market.
7. Practical guidance for DTC operators, growth, and CX teams
Returns policy is part of brand promise, not just a customer-support pain point. 35% of DTC brands stack restrictive clauses on the returns page (restocking fee / final sale / store credit only), but most don't surface this clearly on the marketing pages. The result: customers discover the policy is stricter than expected only after purchase, and trust quietly erodes. For long-term customer relationships, the rule is straightforward — either run a genuinely generous policy or display the policy honestly. Doing neither leaves the most damage on the table.
Restocking fee isn't taboo, but it has to be written clearly. 19.2% of brands surface restocking fees in this data — charging is no longer a taboo. But hiding fees is. Burying return costs in fine print, swapping cash refunds for store credit silently, requiring receipts to gate customers — these get screenshotted and shared on Reddit and Twitter, and the brand-damage cycle starts. If you decide to charge a restocking fee, write it in large text, place it in the first paragraph of the returns policy, and explain the reason ("To keep our 100-day try-before-you-buy policy possible, we charge a $X processing fee on unopened returns.").
Final-sale clauses should be category-rational. 39.9% of DTC brands have final-sale clauses, but good ones are category-rational — intimates / cosmetics / food are non-returnable for hygiene reasons, custom orders are non-returnable for obvious reasons; customers accept these. Bad final-sale is discount-tier-stacked — "any item discounted >30% is final sale," which reads as a sales gimmick. Customers who discover that pattern post-purchase immediately unsubscribe and unfollow.
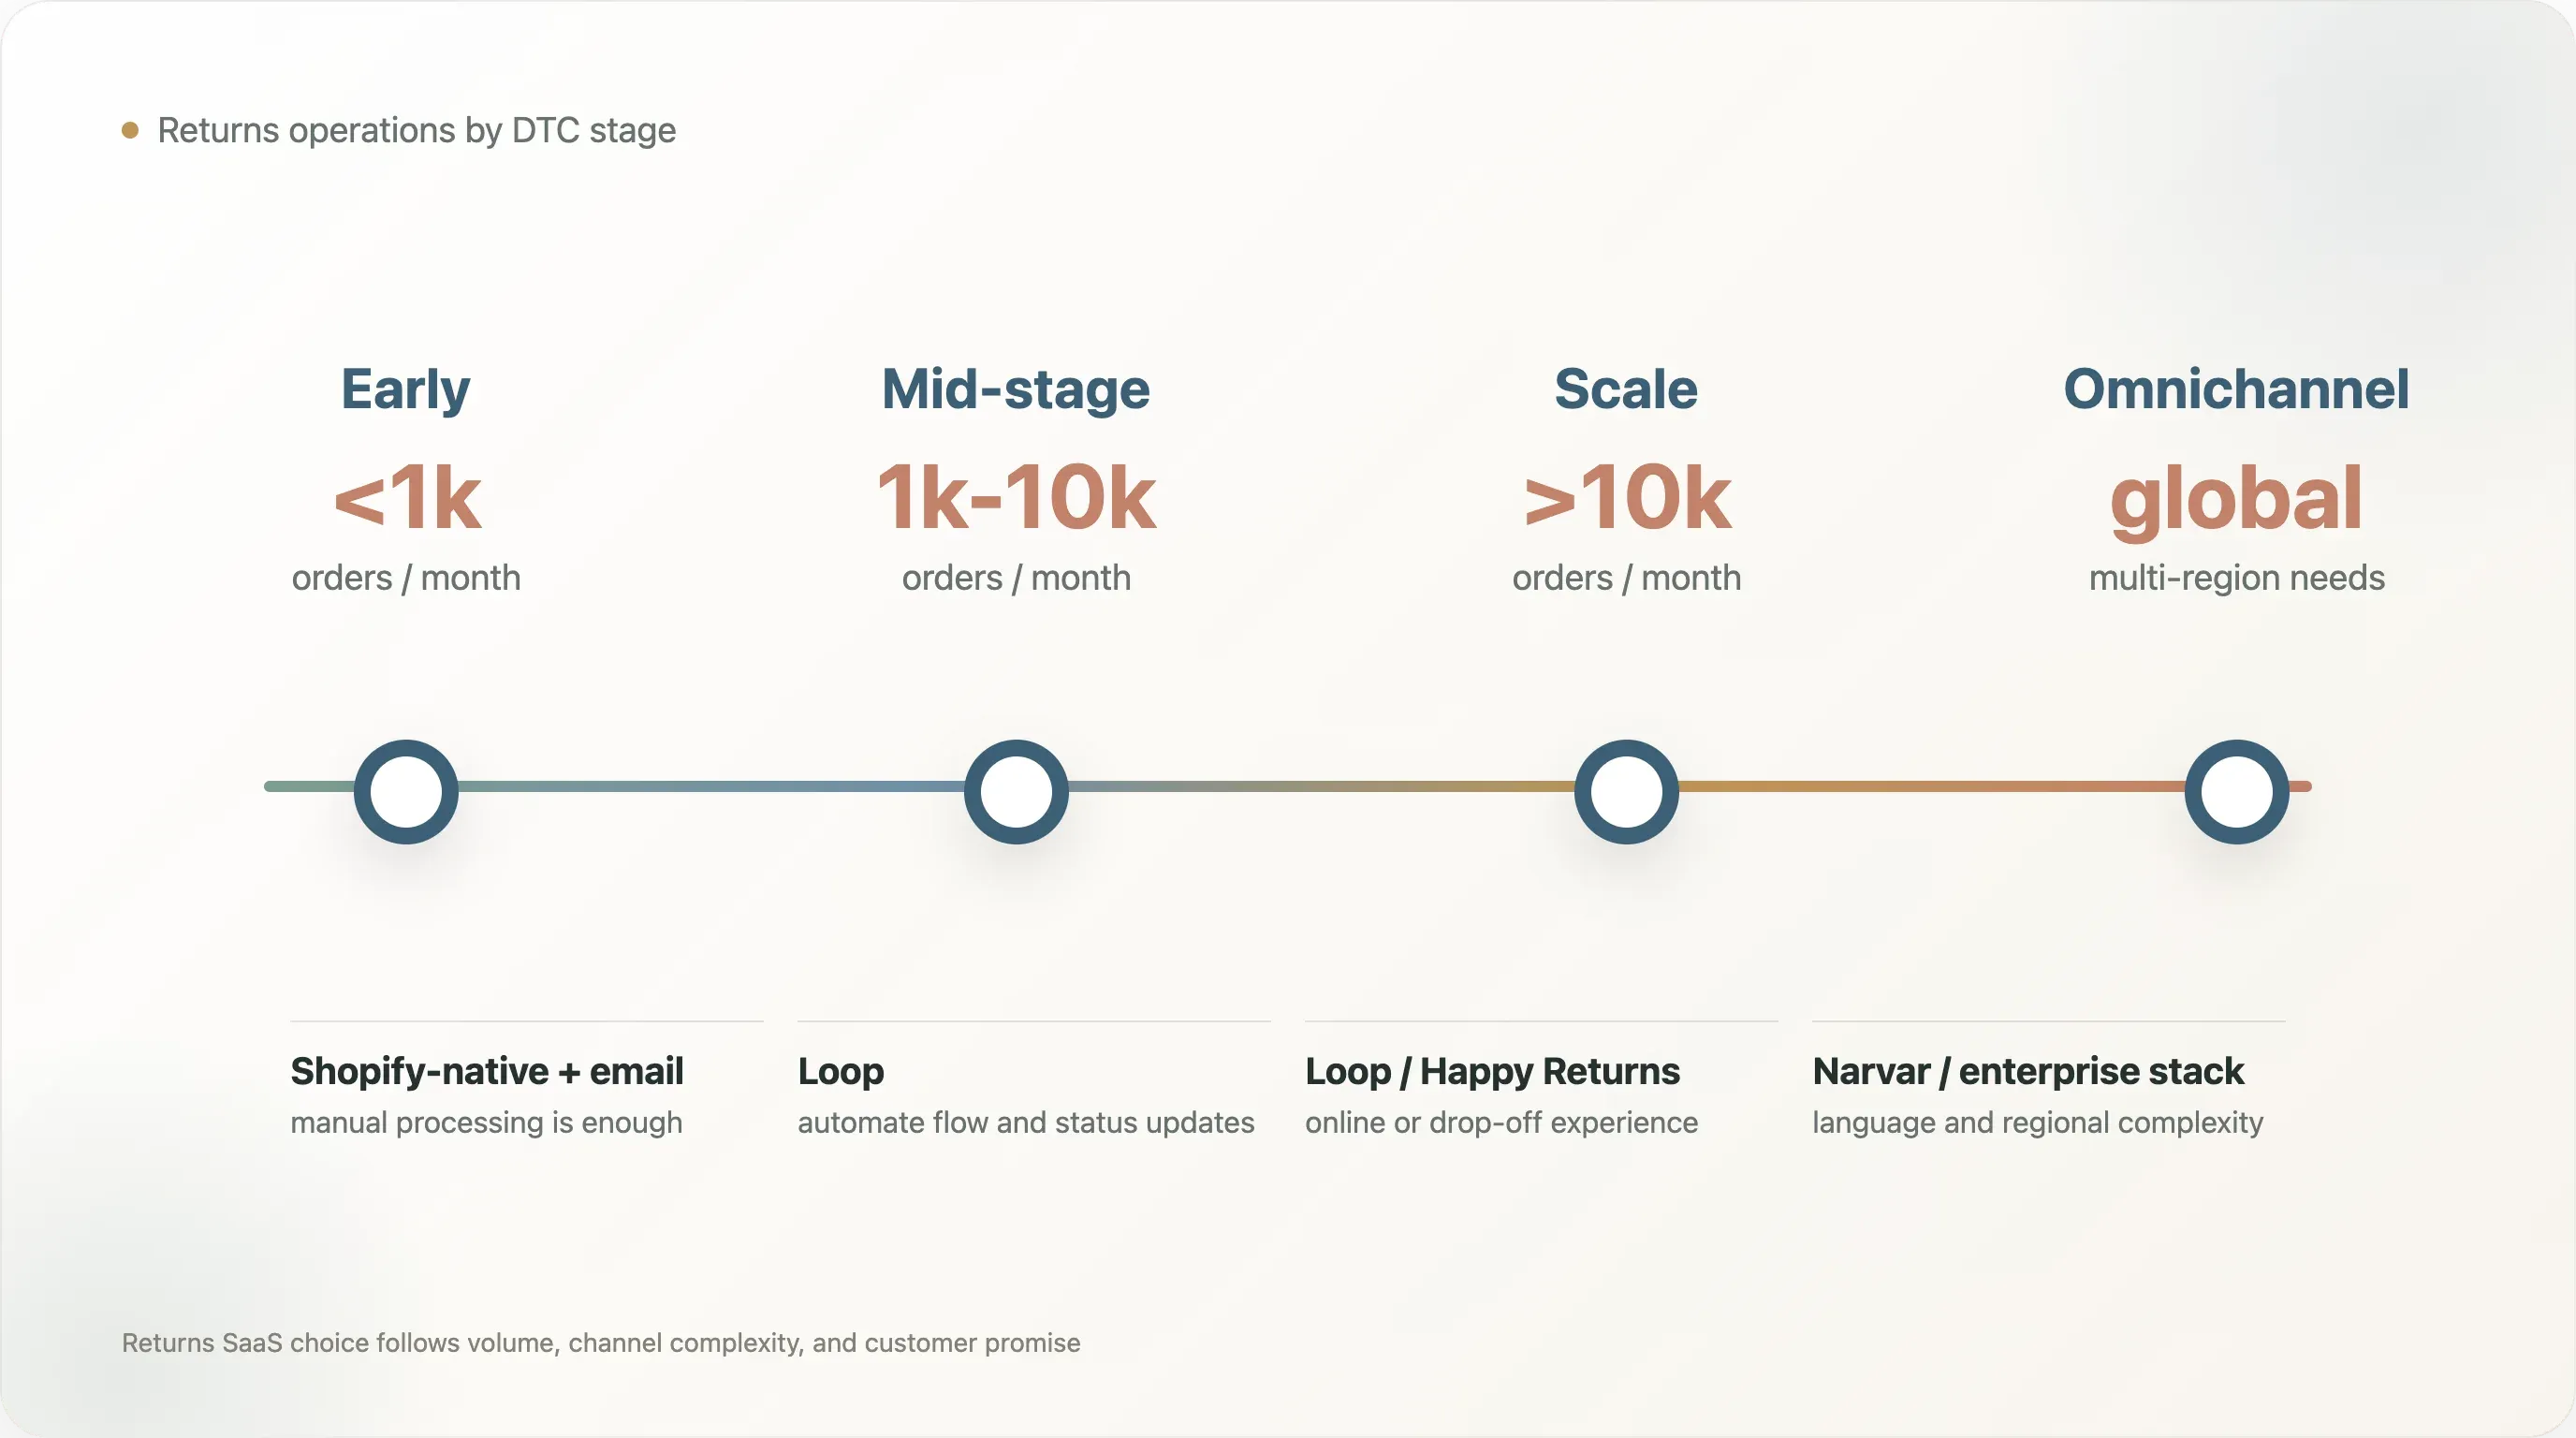
Returns SaaS picks: Loop is the default, the same way Gorgias is the default for customer support. Early DTC (monthly orders <1k) can use Shopify-native returns + email manual processing. Mid-stage DTC (1k-10k/month) should move to Loop; automating the returns flow saves 20-30% of CX team time. Scale DTC (>10k/month) — choose based on omnichannel needs: Happy Returns for physical drop-off, Narvar for international multi-language, Loop for deep Shopify integration.
For content / SEO teams: "DTC returns policy benchmark" is a high-intent / low-supply keyword cluster. The top-policy-signal stats in this report make a defensible SEO long-tail anchor — "What's a fair return window for DTC" / "How to write a returns policy that doesn't lose customers" — utility content that DTC founders and operators search repeatedly. First DTC SaaS or agency to lock this category content owns the search visibility for years.
Methodology
Data source: 1,148 effective DTC home-page captures from a 1,597-brand pool. We tried to find returns pages on each, successfully parsing 761 returns / refund / refund-policy pages. Returns-page fetch tried 8 candidate paths + homepage footer-link fallback, hit rate ~60%. Snapshot date 2026-05-12 UTC.
Free returns 18.4% is a lower bound, not an upper bound. The biggest directional uncertainty in this report. Returns pages don't typically brag "FREE RETURNS" — that copy lives elsewhere. A brand's returns page not surfacing "free" doesn't mean returns aren't free. Cite this as "at least 18.4% explicitly affirm free on the returns page," not "82% charge fees."
Restocking fee 19.2% / final sale 39.9% are robust numbers: both are clauses brands intentionally surface. False-positive risk is low; the directional read is near true.
Wayback Machine historical comparison didn't work: we initially planned a 2023-01 vs 2026-05 trend report, but Wayback's historical coverage of Shopify returns pages is under 1% — far too sparse for trend claims. This report is a 2026-05 snapshot only; we don't claim 12-month direction. To do a real time comparison, run the same sample quarterly and build your own baseline over 12-24 months.
Brand pool tilts Shopify-ecosystem (67% of brands trace to Shopify-stack case-study sources), so the sample over-represents modern, marketing-led, Shopify-native DTC and under-represents mom-and-pop e-commerce, legacy retail entering DTC, and pure dropshippers. This is not the entire US DTC universe.
Missing returns pages (~40%) introduces selection bias: of 1,148 brands, we could only locate and successfully parse 761 returns pages. The ~40% missing are likely early-stage DTC or dropshippers without well-structured returns policies — and their actual policies are probably more casual than what shows up here. So this report likely understates the share of casually-handled returns policies.
Strictness scoring is rule-based, not LLM. Seven weighted signals (window length / free-returns flag / restocking fee / customer pays / store credit only / exchange only / final sale). Rules are open in the repo. As with any rule scoring, false positive / false negative risk exists. If you cite "strict bucket = 10.2%," tag it as "by this report's rules."
Legal and copyright: all returns pages were publicly fetched. The report uses aggregate counts and percentages only — no full returns-policy text reproduction. The named brands in the generous-policy table appear in positive context only (their public free-returns commitment is their own marketing choice). No raw HTML or CSV download is published; every number is reproducible from the public brand pool + open rule set.
Caveats
What this report does NOT support:
- Not "82% of DTC charges for returns" (18.4% is a free-returns floor; the inverse doesn't follow)
- Not "DTC average return window is 30 days" (the 30-day median applies only to the 552 brands that surface an explicit window; the full sample includes brands with no stated window)
- Not "Loop has 10.5% of the returns SaaS market" (that's share within brands where we can detect a vendor; most brands don't expose a vendor host)
- Defensible: "Across 1,148 DTC brand returns pages we scanned, 50.1% require original packaging, 39.9% include a final-sale clause, and 19.2% explicitly write a restocking fee"
Data source & versioning
Dataset: dtc_returns_policy_evolution_2026/ (this repo). Snapshot date 2026-05-12 UTC, version v1.0 (2026-05 snapshot). Shares the DTC brand pool with dtc_dual_report_2026 and dtc_customer_support_map_2026 — the three reports can be cross-referenced, looking at the same 1,148 DTC brand subset through three lenses: tech stack, support tooling, and returns policy.
What SEO and Content Teams Can Cite
This research creates several citation angles for blog intros, data callouts, social posts, comparison pages, and follow-up explainers:
- 761 returns pages were successfully parsed from the 1,148-brand DTC pool.
- 18.4% explicitly affirm free returns on the returns page.
- 19.2% explicitly mention a restocking fee or return-shipping cost.
- 50.1% require original packaging or tags.
- 39.9% include a final-sale clause.
- Among pages with an explicit return window, the median is 30 days.
- Loop appears on 80 parsed returns pages, far ahead of Narvar, Shopify Returns, Happy Returns, and other detected vendors.
The caveat should travel with the citation. These numbers describe the specific sample and collection method used in this report. They should not be reframed as a full-market census, an internal adoption measure, or a claim about every company in the category.
For editorial use, the strongest framing is the one that pairs the headline statistic with the sample boundary. That makes the claim more durable and easier for readers to trust. For example, write "in this HN hiring sample," "in this DTC home-page static scan," or "across this YouTube channel sample" before turning the number into a broader trend discussion.
Reproducibility Notes
The delivery folder includes the following process files copied from the original local report packages. These are included so the published report can be checked against the actual scripts, intermediate outputs, charts, and source drafts used in the reporting workflow.
process_files/_shared/dtc_brand_pool_source/out/brand_pool_v2.csvprocess_files/_shared/dtc_brand_pool_source/out/detection.csvprocess_files/_shared/dtc_brand_pool_source/out/master.csvprocess_files/out/analysis_stats.jsonprocess_files/out/fetch_log.csvprocess_files/out/policies.csvprocess_files/scripts/01_fetch_returns_pages.pyprocess_files/scripts/02_parse_returns_policies.pyprocess_files/scripts/03_compute_stats.pyprocess_files/scripts/04_make_figs.pyprocess_files/scripts/05_build_report_bilingual.pyprocess_files/scripts/06_module_i_check.py
Methodology corrections, dataset issues, and follow-up analyses are welcome at . This report is based on public web or public API signals collected in May 2026 and should be read with the sample boundaries stated above.