
The world of work has never been more connected—or more complex. As we barrel toward 2026, collaboration tools have become the digital backbone of every team, from scrappy startups to sprawling global enterprises. I’ve watched this space evolve from simple chat apps to sophisticated, AI-powered platforms that promise to make teamwork not just possible, but productive, across every time zone and work model. And let’s be honest: with 93% of enterprises now using some form of unified communications and collaboration software, if your team’s still relying on email threads and sticky notes, you might as well be sending carrier pigeons.
But here’s the real kicker: the data behind these tools is just as important as the tools themselves. Whether you’re a sales leader, an ops manager, or the person everyone calls when “the Zoom isn’t working,” understanding collaboration tools statistics and usage data is the secret sauce for smarter decisions, happier teams, and a real edge in a crowded market. So, let’s dive into the numbers, trends, and insights that are shaping the future of team communication—and see how Thunderbit (my team’s AI web scraper) is helping businesses turn unstructured feedback into actionable strategy.
Try Thunderbit for AI Web Scraping
Top Collaboration Tools Statistics at a Glance
Let’s start with the headline numbers. Here are the most impactful collaboration tools statistics and usage data points you need to know for 2026:
| Topic | Statistic | Source |
|---|---|---|
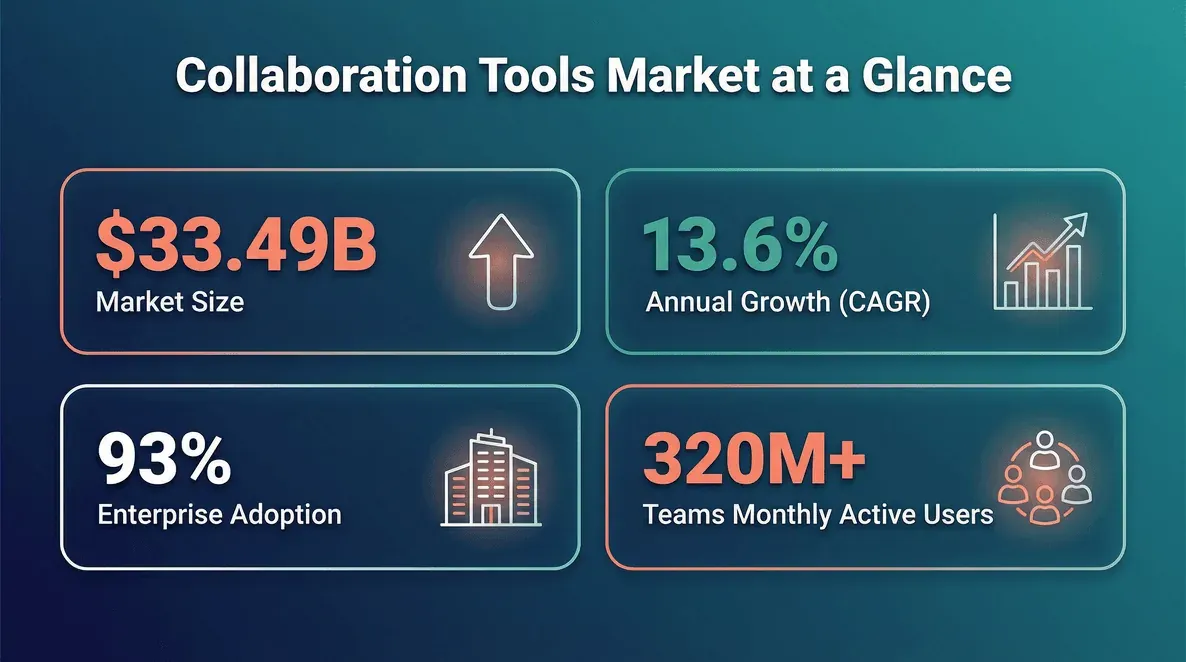
| 2026 Market Size | $33.49B team collaboration software market (2026) | GII Research |
| 2026 Growth Rate | 13.6% CAGR (2025→2026) | GII Research |
| Enterprise Adoption | 93% of enterprises use UC & collaboration apps | IDC |
| Videoconferencing Adoption | 90% of enterprises use videoconferencing systems | IDC |
| Platform Scale | 320M+ monthly active users on Microsoft Teams | Microsoft |
| Tech Gap | 75% of employees say remote-work tools need improvement | Zoom |
| Investment Pressure | 72% say org needs new tools/tech for remote work | Zoom |
| After-Hours Collaboration | Chats outside 9-to-5 up 15% YoY; avg 58 messages/user before/after hours | Microsoft |
| Late Meetings | Meetings after 8 p.m. up 16% YoY | Microsoft |
| Cross–Time-Zone Work | 30% of meetings span multiple time zones (up 8 pts since 2021) | Microsoft |
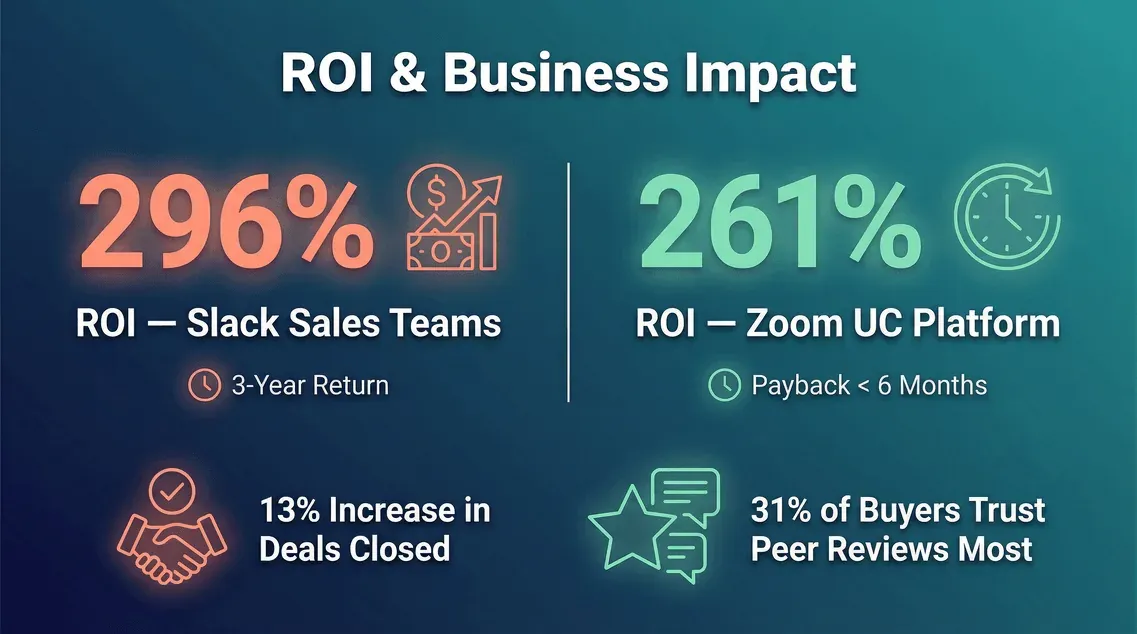
| Peer Reviews’ Role | 31% of buyers say public review sites are most consulted info source | G2 |
| Trust Breakdown | 9% cite “vendor websites are unreliable” as biggest purchase obstacle | G2 |
These numbers aren’t just trivia—they’re the pulse of how teams are working, what’s working (and what’s not), and where the next big opportunities are hiding.
Collaboration Tools Market Trends: What’s Driving Growth in 2026
Let’s zoom in on the trends behind the stats. The collaboration software market is on a tear, growing to $33.49 billion in 2026 at a 13.6% annual growth rate. But what’s driving this surge?
First, it’s all about stack consolidation and AI augmentation. Over half of organizations (51%) say it’s “extremely important” to consolidate the number of collaboration and communications providers they use (IDC). Teams want fewer, more powerful tools that integrate chat, meetings, file sharing, and project management—all under one roof.
Second, AI is everywhere — and the conversation has shifted from “will people use it?” to “what are people building with it?” Microsoft’s 2026 Work Trend Index found that 66% of AI users now say AI lets them spend more time on high-value work, and 58% report producing work they couldn’t have produced a year ago (that figure jumps to 80% among Microsoft’s “Frontier Professionals” — the most advanced AI users). Even more telling: active AI agents inside Microsoft 365 grew 15x year-over-year, and 18x in large enterprises. So it’s no longer just “shadow AI” creeping in from the edges — it’s agents being deployed inside the same collaboration platforms teams already live in. The IT governance question has shifted with it.
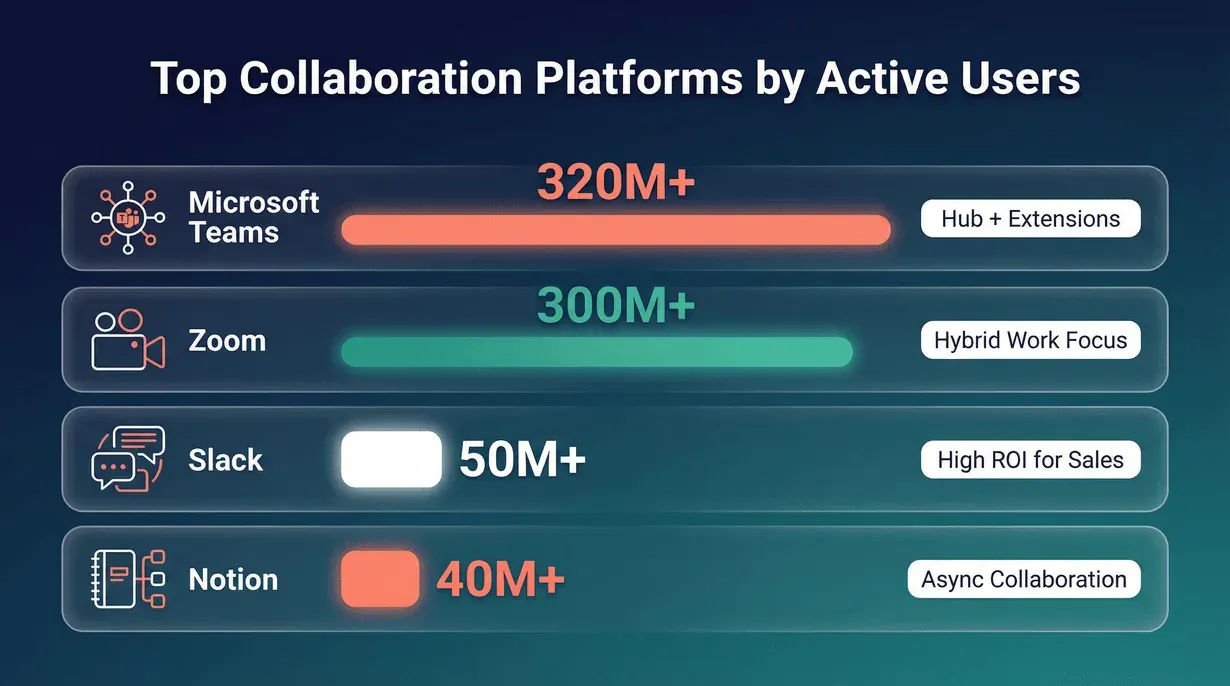
Third, the platform ecosystem is exploding. Microsoft Teams hit 320M monthly active users in its last official disclosure (FY24 Q1, October 2023), and the platform now hosts over 2,000 apps — with collaborative apps from Adobe, Atlassian, and Workday each crossing a million MAU inside Teams. Microsoft has since stopped breaking out Teams MAU in earnings calls (the FY26 Q3 release in April 2026 talked AI metrics instead), so the 320M figure is the floor, not the ceiling. The takeaway? Buyers want “hub + extensions,” not just another chat app.
And finally, user feedback is shaping the roadmap. With 31% of buyers consulting public review sites as their top info source (up from 13% in 2021), vendors are racing to address real-world pain points: reliability, integrations, notification overload, and admin headaches.
Team Communication Tools Data: Why It Matters More Than Ever
So, why is team communication tools data so crucial in 2026? Because the way we work—and the way we measure what works—has fundamentally changed.
Take sales teams, for example. It’s not enough to know that your reps are “using Slack.” What matters is how they’re using it: Are they collaborating on deals in real time? Are they leveraging integrations with CRM and document tools? Are they drowning in notifications, or actually closing more deals?
This is where data comes in. By extracting user behavior data from social platforms, internal chat logs, or even public reviews, teams can optimize everything from workflow design to tool configuration. At Thunderbit, I’ve seen teams use our AI Web Scraper to pull thousands of user comments from G2, Trustpilot, or even Reddit, then analyze which features drive satisfaction (or frustration). It’s like having a focus group running 24/7—no donuts required.
And the impact is real. According to a Slack TEI study, sales teams using integrated collaboration tools saw a 296% ROI over three years, with a 13% increase in deals closed. That’s not just a nice-to-have—that’s a competitive advantage.
Hybrid and Remote Work Trends: Why Collaboration Software Is Essential
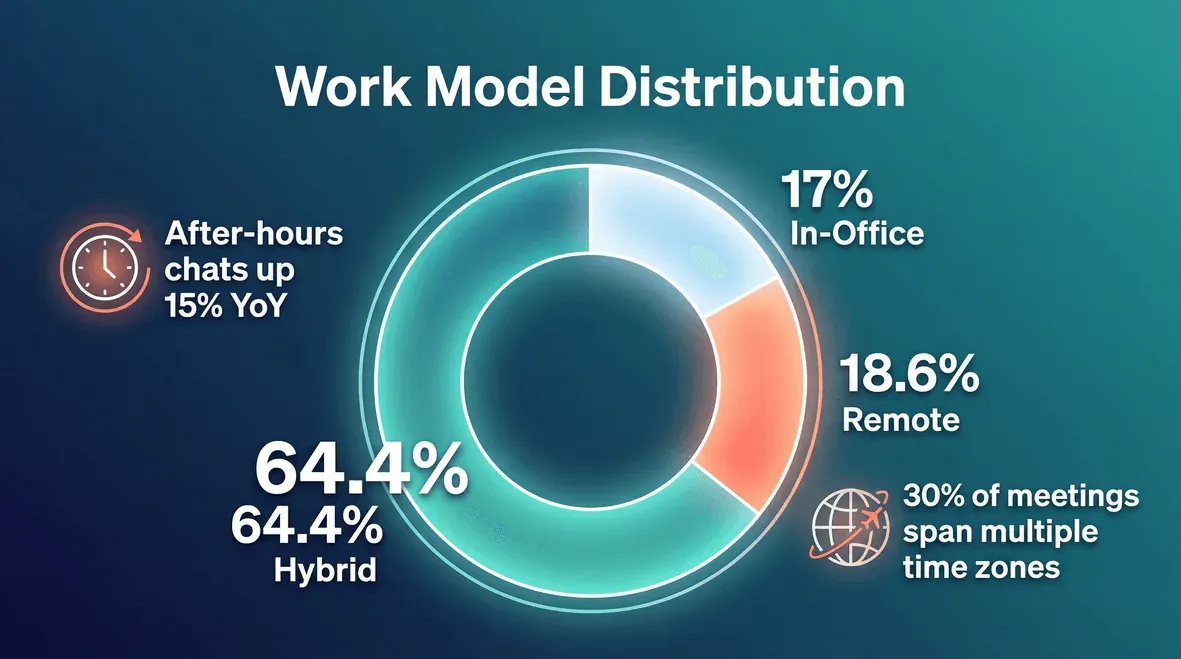
The rise of distributed and hybrid work has made collaboration software not just helpful, but essential. In 2026, 64.4% of organizations are hybrid, 17% are fully in-office, and 18.6% are fully remote (Zoom). And the tools we use have to keep up.
Hybrid and remote teams rely on collaboration tools for everything: meetings, project management, document sharing, and even watercooler chat. But the challenges are real—after-hours chats are up 15% year-over-year, and 30% of meetings now span multiple time zones (Microsoft). That means features like async messaging, automated summaries, and timezone-aware scheduling aren’t just nice—they’re necessary.
Turn review data into collaboration insights Get Started Free
Here’s where Thunderbit comes in. By scraping and analyzing review data from platforms like G2 and Trustpilot, teams can see which tools actually deliver for distributed teams. For example, you might find that users in APAC regions complain about meeting times, while North American users focus on integration gaps. With Thunderbit, you can turn this unstructured feedback into actionable insights—helping you pick the right tool, configure it for your team, and even inform vendor negotiations.
Unstructured Feedback and Reviews: Turning Collaboration Data into Insights
Let’s talk about unstructured data—the wild west of collaboration tool feedback. User reviews, forum posts, and social media threads are packed with insights, but good luck making sense of it all manually.
That’s why I’m so passionate about what we’re building at Thunderbit. Our AI Web Scraper can extract, structure, and analyze thousands of reviews from sites like G2, Trustpilot, or even niche SaaS forums. You can pull fields like reviewer role, company size, use case, pros/cons, and even AI feature mentions.
Here’s a mini-workflow I love:
- Scrape reviews for your shortlist of tools (say, Slack, Teams, Zoom, Notion).
- Normalize fields: tag each review for top pros, cons, and “deal-breaker” phrases.
- Chart complaint frequency by theme (e.g., notification overload, admin pain, integration gaps).
- Segment sentiment by role (IT admin vs. end user) or company size.
- Spot trends: Are AI features driving satisfaction? Are certain pain points unique to remote teams?
This isn’t just academic—31% of buyers now trust peer reviews more than vendor websites. If you’re not mining this data, you’re missing the conversation.
Collaboration Tools Strategy: Using Data to Shape Product and Market Decisions
Looking ahead, the real winners in the collaboration software market will be those who turn data into strategy. By analyzing usage data and user feedback, companies can spot market gaps, identify product improvement opportunities, and even shape their go-to-market playbook.
For example, if you notice that users consistently complain about “search/knowledge retrieval” in your tool category, that’s a roadmap opportunity. If AI-powered meeting summaries are mentioned as a top pro, double down on that feature. And if your competitors are getting hammered for poor integrations, that’s your chance to shine.
Thunderbit makes this kind of competitive intelligence not just possible, but practical. Sales and ops teams can scrape, categorize, and visualize review data—turning noise into signal, and signal into action.
Collaboration Software Usage Data: Adoption, Frequency, and Preferences
So, how often are teams actually using these tools? And which features matter most?
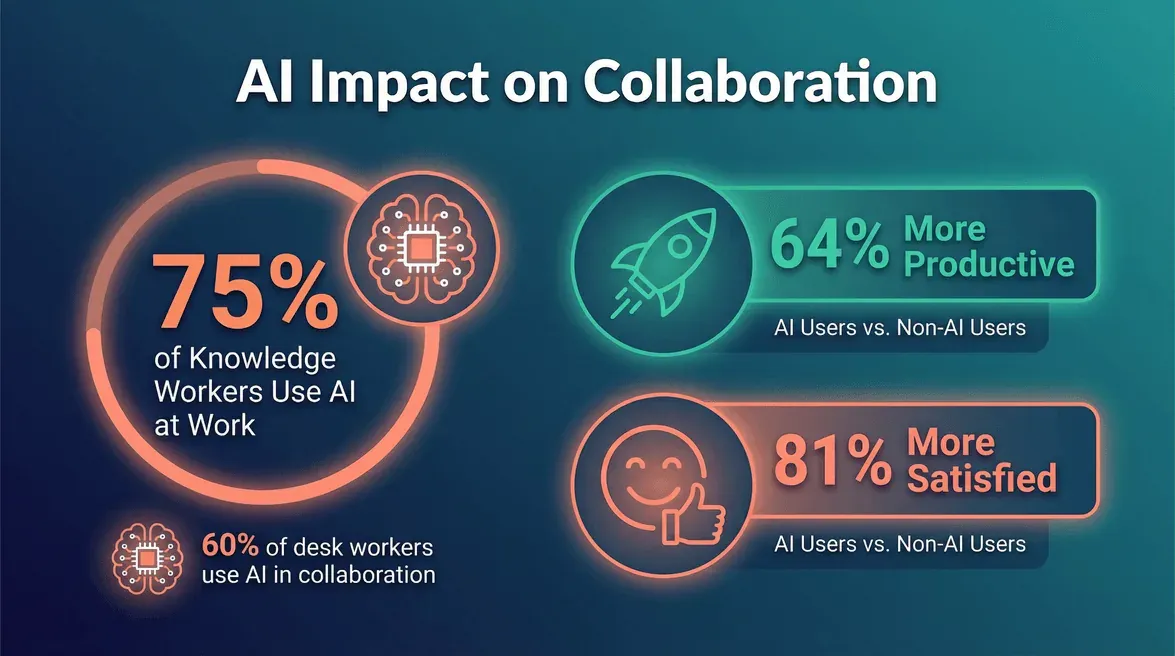
- Daily/Weekly Usage: Microsoft Teams’ last officially disclosed figure was 320M+ monthly active users (FY24 Q1, October 2023) — Microsoft hasn’t refreshed that number in subsequent earnings, but the trajectory has clearly continued. Slack’s Workforce Index shows that 60% of desk workers now use AI in their collaboration workflows.
- Feature Preferences: The most requested features in 2026? AI-powered meeting recaps, real-time translation, deep integrations with CRM/project tools, and robust mobile experiences (IDC).
- Usage by Industry/Region: Tech and professional services lead in adoption, but even regulated industries (finance, healthcare) are ramping up—often with stricter compliance and governance needs. APAC teams prioritize async features and translation, while North America leans into integrations and workflow automation (Capterra).
Here’s a quick table for context:
| Tool | Daily Active Users | Most Popular Features | Notable Trends |
|---|---|---|---|
| Microsoft Teams | 320M+ | Chat, meetings, file sharing, AI recaps | Hub + extensions model, rapid AI adoption |
| Slack | 50M+ | Messaging, integrations, workflow builder | High ROI for sales/service teams, AI agents |
| Zoom | 300M+ | Video, webinars, phone, whiteboard | Hybrid work focus, AI-powered meeting tools |
| Notion | 40M+ | Docs, wikis, project mgmt, AI | Knowledge management, async collaboration |
Team Communication Tools Data: Impact on Productivity and Engagement
Let’s get to the bottom line: do these tools actually move the needle?
- ROI: Slack for sales teams delivered a 296% ROI over three years, and Zoom’s unified communications platform showed a 261% ROI with payback in under six months.
- Productivity Gains: Zoom users reported up to 52 minutes of productivity added per employee per week, and Slack sales teams closed 13% more deals.
- Engagement: Daily AI users in collaboration tools are 64% more productive and 81% more satisfied than non-AI users.
The message is clear: the right tools, used the right way, drive real business outcomes.
Collaboration Tools Data by Work Model: Remote, Hybrid, and In-Office
Work model matters—a lot. Here’s how collaboration software usage data breaks down:
- Hybrid Teams: 64.4% of organizations are hybrid, with workers spending about 46% of their week in the office (Gallup). These teams need tools that support both synchronous and asynchronous work, seamless device switching, and robust mobile/web parity.
- Remote Teams: Prioritize async messaging, timezone fairness, and AI-powered summaries. APAC teams, in particular, cite meeting time challenges and rely heavily on post-meeting recaps (Capterra).
- In-Office Teams: Still use collaboration tools, but often focus on meeting room hardware, whiteboarding, and integrations with on-prem systems.
No matter the model, the trend is clear: collaboration tools are table stakes for productivity and engagement.
Regional and Industry Variations in Collaboration Tools Statistics
Collaboration tools aren’t one-size-fits-all. Here’s how the data varies:
- Region: North America leads in platform adoption and integration depth. APAC prioritizes translation, async features, and timezone fairness. EMEA often faces stricter data privacy and compliance requirements (Capterra).
- Industry: Tech, professional services, and education are early adopters. Finance and healthcare are catching up, with a focus on security and governance. Manufacturing and logistics teams increasingly use collaboration tools for frontline coordination and incident response.
Understanding these nuances is key for both buyers and vendors.
Key Takeaways: What the 2026 Collaboration Tools Data Means for Your Team
Let’s wrap up with the most actionable insights:
- Adoption is nearly universal: 93% of enterprises use collaboration tools, and usage intensity is only rising.
- AI is the new normal: If your tool doesn’t have AI-powered features, you’re behind the curve.
- Peer feedback matters: 31% of buyers trust review sites most—scrape and analyze this data for smarter decisions.
- Hybrid is here to stay: Design your workflows and tool stack for flexibility, not just “remote” or “in-office.”
- Thunderbit can help: Use Thunderbit to extract, structure, and analyze unstructured feedback—turning reviews into real competitive advantage.
FAQs about Collaboration Tools Statistics & Usage Data
1. What is the size of the collaboration tools market in 2026?
The global team collaboration software market is projected to reach $33.49 billion in 2026, growing at a 13.6% CAGR.
2. How widely are collaboration tools adopted by businesses?
93% of enterprises use unified communications and collaboration apps, and 90% use videoconferencing systems.
3. What impact do collaboration tools have on productivity and ROI?
Studies show ROI ranging from 261% to 296% over three years, with significant gains in productivity, deal velocity, and employee satisfaction.
4. Why is unstructured feedback from reviews so important in 2026?
31% of buyers now consult public review sites first, making peer feedback a critical source for tool selection, configuration, and competitive intelligence.
5. How can Thunderbit help teams make sense of collaboration tools data?
Thunderbit enables teams to scrape and analyze unstructured data from review sites, forums, and social media—transforming raw feedback into structured insights for smarter decisions.
6. What’s actually new about collaboration tools in 2026?
The biggest 2026 shift is AI agents moving from experimentation into deployment inside the platforms teams already use. Microsoft reports that active agents inside Microsoft 365 grew 15x year-over-year, and 18x in large enterprises, per its 2026 Work Trend Index. The question buyers are asking is no longer “should we use AI features?” but “which agents do we let into the workflow, and who governs them?”
Further Reading & Resources
- Thunderbit Official Website
- Thunderbit Chrome Extension Download Page
- Thunderbit Blog
- IDC MarketScape: Worldwide Unified Communications and Collaboration Platforms 2024
- G2 2024 Buyer Behavior Report
- Microsoft Teams FY24 Q1 Earnings
- Zoom Hybrid Work Trends
- Capterra Global Team Collaboration Survey
- Slack TEI Study for Sales Teams
- Zoom Total Economic Impact Report
- Salesforce Slack Workforce Index
- Microsoft 2026 Work Trend Index Annual Report
- Gartner Multimodal Enterprise Apps Forecast
If you’re ready to turn collaboration tools data into your team’s next big advantage, give Thunderbit a try—and let’s make teamwork in 2026 smarter, not just busier.
Try Thunderbit to Analyze Collaboration Tools Data Get Started Free