
Picture this: It’s a Monday morning in 2026, and you’re sipping your coffee while scrolling through Amazon for everything from groceries to gadgets—maybe even a new pair of socks you didn’t know you needed. You’re not alone. At any given minute, over a million dollars is changing hands on Amazon’s platforms, and somewhere, a Prime truck is probably delivering a package to your neighbor’s porch (or maybe even to your own, again).
Amazon isn’t just an online store anymore—it’s a global ecosystem, a tech powerhouse, and, let’s be honest, a bit of a habit. Whether you’re a business leader, marketer, seller, or just a curious shopper, understanding the latest Amazon statistics—from Amazon Prime membership to sales, revenue, and beyond—can help you make smarter decisions in 2026. So, let’s dive into the numbers that are shaping the future of commerce, technology, and, well, how we all shop for socks.
Amazon by the Numbers: Key Amazon Statistics for 2026
Before we get granular, here’s a high-level snapshot of Amazon’s scale in 2026. These headline numbers set the stage for everything that follows:
| Metric | 2024–2025 Figure | Source |
|---|---|---|
| Total Net Sales (2024) | $638 billion (up 11% YoY) | Capital One Shopping |
| Projected Net Sales (2025) | ~$700 billion | eDesk |
| Amazon Prime Members (2025) | ~250 million worldwide | Accio |
| U.S. Prime Members | 168–180 million | eDesk |
| Market Share (U.S. e-commerce) | 37–40% | Capital One Shopping |
| Active Customer Accounts | 310+ million | Capital One Shopping |
| AWS Revenue (2024) | $107.6 billion | Capital One Shopping |
| Advertising Revenue (2024) | $56.2 billion | Capital One Shopping |
| Marketplace Sellers | 2+ million active | Capital One Shopping |
| Brand Value (2025) | $320 billion (#3 globally) | Business Insider |
These numbers are almost hard to wrap your head around. Amazon’s reach is so vast that it’s not just a retailer—it’s a force of nature in global commerce and technology.
Amazon Sales Statistics: How Big is Amazon’s Sales Engine?
Let’s get into the heart of Amazon’s business: sales. If you’ve ever wondered just how much stuff Amazon moves, the answer is… a lot. And then some.
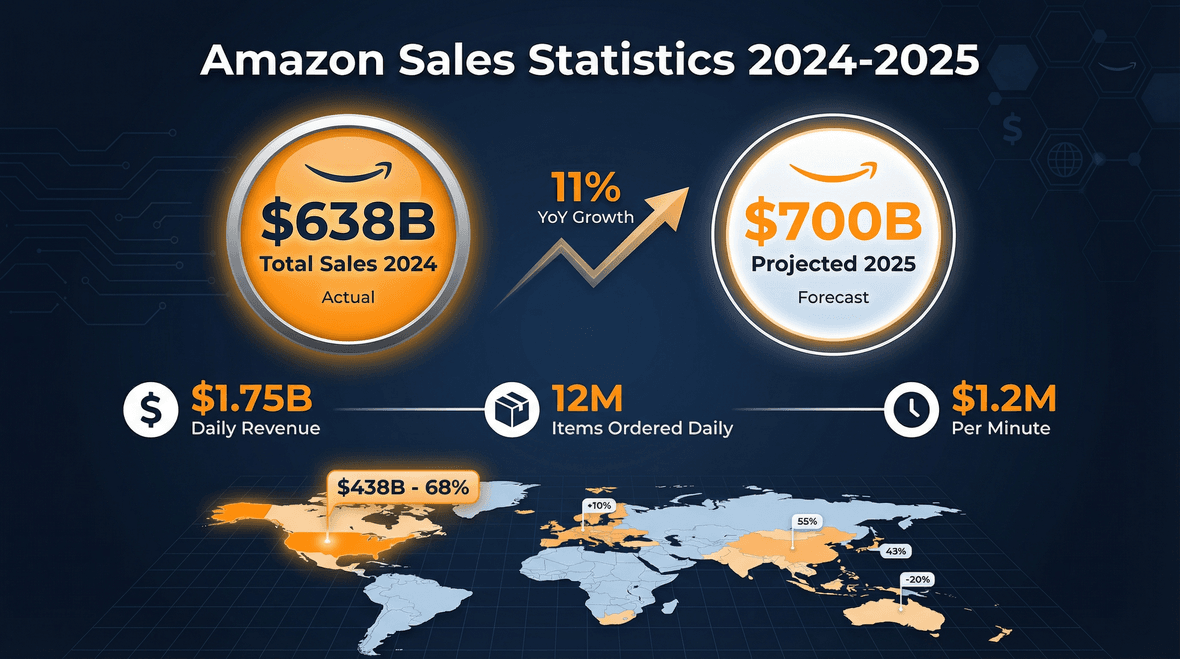
- Total Annual Sales (2024): , up 11% from the previous year.
- Projected Sales (2025): On track to hit .
- Daily Revenue: .
- Items Ordered Daily: .
- Revenue Per Minute: .
Global Amazon Sales Breakdown
Amazon’s sales are global, but the U.S. is still the engine:
- U.S. Sales (2024): (68% of global revenue).
- International Sales: About (22% of total).
- Top International Markets: Germany , UK , Japan .
- Amazon ships to 130+ countries and operates marketplaces in 20+ countries ().
Top Product Categories on Amazon
What are people buying?
- Electronics & Tech: Always a top performer ().
- Home & Kitchen: Huge growth as people invest in their living spaces.
- Health & Beauty: .
- Apparel & Fashion: .
- Grocery: Over on Amazon last year.
Key trend: as a top reason for choosing Amazon, and 44% say it’s the most convenient shopping site.
Amazon Prime Statistics: Membership, Engagement, and Value
Amazon Prime is the glue that holds the Amazon universe together. It’s not just about free shipping anymore—it’s about media, groceries, and perks galore.
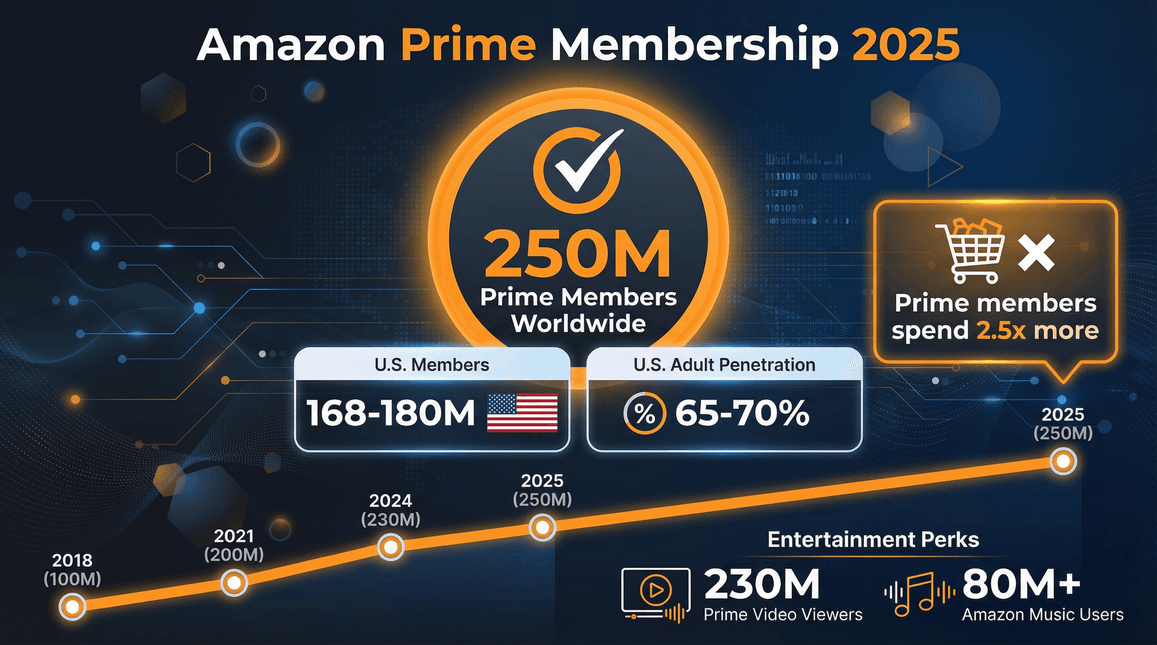
- Total Prime Members (2025): .
- U.S. Prime Members: .
- Prime’s U.S. Penetration: .
- Prime Member Spending: than non-Prime shoppers.
Amazon Prime Subscriber Growth
Prime’s growth has been nothing short of rocket-fueled:
- 2018: ~100M members.
- 2021: .
- 2024: ~230M members.
- 2025: .
Prime’s U.S. growth is plateauing, but international markets are picking up the slack.
Amazon Prime Video, Music, and Other Perks
- Prime Video: ; tied Netflix for U.S. streaming share in 2024.
- Prime Video Content Spend (2024): .
- Amazon Music: .
- Prime Reading & Kindle: .
Prime is more than shipping—it’s a lifestyle subscription.
Amazon Revenue Statistics: Where the Money Comes From
Amazon’s revenue streams are as diverse as its product catalog. Here’s how the pie is sliced:
| Revenue Stream | 2024 Revenue | % of Total | Source |
|---|---|---|---|
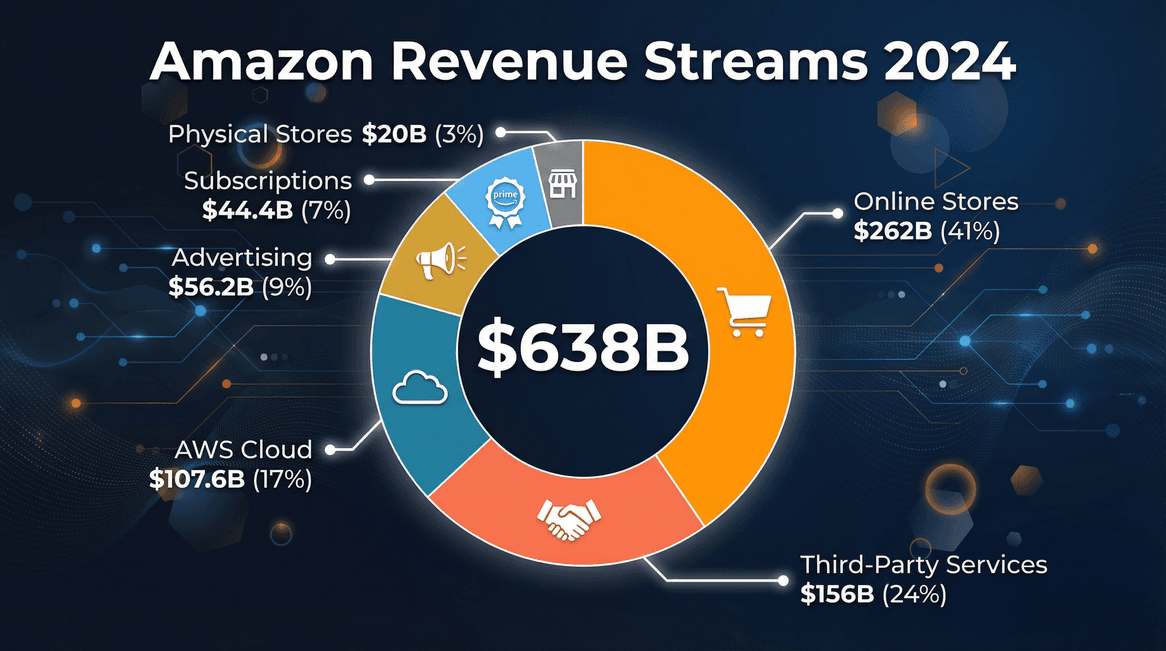
| Online Stores (1P) | ~$262B | 41% | Capital One Shopping |
| Third-Party Seller Services | ~$156B | 24% | Capital One Shopping |
| AWS (Cloud) | $107.6B | 17% | Capital One Shopping |
| Subscriptions (Prime, etc.) | $44.4B | 7% | Capital One Shopping |
| Advertising | $56.2B | 9% | Capital One Shopping |
| Physical Stores | ~$20B | 3% | Reuters |
Amazon Web Services (AWS) Revenue
- AWS Revenue (2024): .
- AWS Share of Global Cloud Market: .
- AWS Share of Amazon’s Operating Profit: .
AWS is the engine that lets Amazon take big bets elsewhere.
Amazon Advertising Revenue
- Ad Revenue (2024): , up 20% YoY.
- Share of Global Digital Ad Market: .
- Projected Ad Revenue (2026): .
Amazon ads are now a must for brands—pay-to-play is the new normal.
Amazon Marketplace & Seller Statistics
Amazon’s marketplace is a universe of its own, powering millions of businesses.
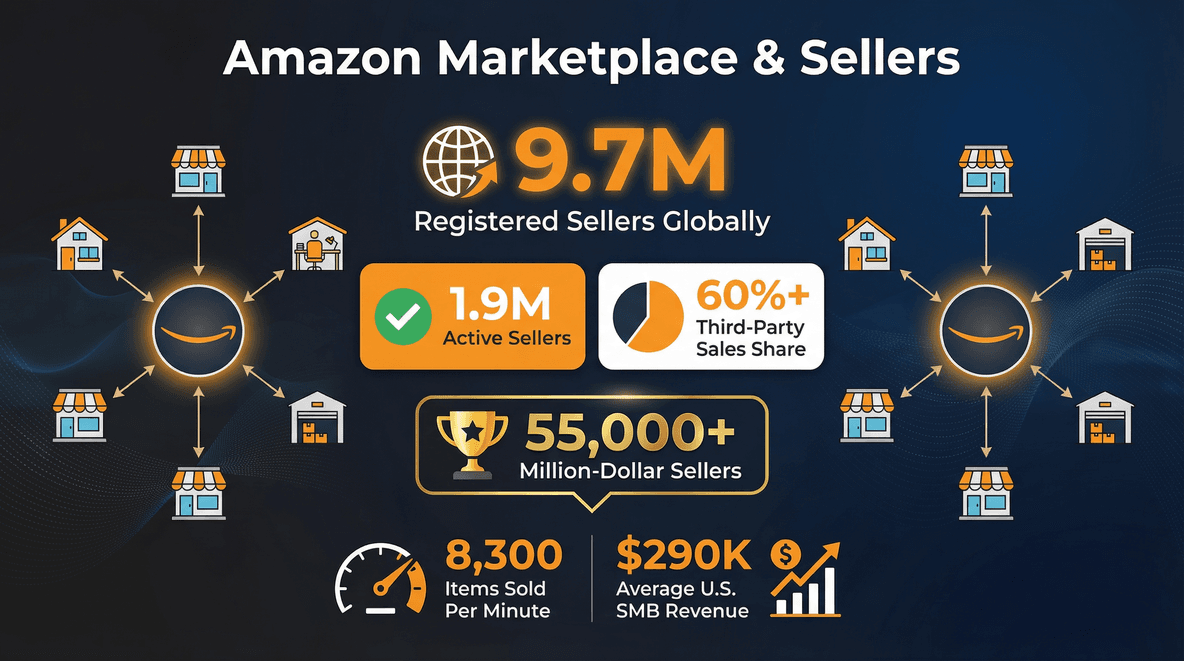
- Registered Sellers: .
- Active Sellers: .
- U.S.-Based Sellers: .
- Share of Sales from Third-Party Sellers: .
- Average U.S. SMB Seller Revenue: .
- Sellers with $1M+ in Sales (2024): .
Independent Sellers’ Impact
- Products Sold by U.S. SMBs (2024): .
- Items Sold per Minute by U.S. Sellers: .
- SMBs Exporting via Amazon: Over .
Amazon’s marketplace is where small businesses can become global brands—if they can stand out in the crowd.
Amazon Prime Day and Seasonal Sales Statistics
Prime Day isn’t just a sale—it’s a retail phenomenon.
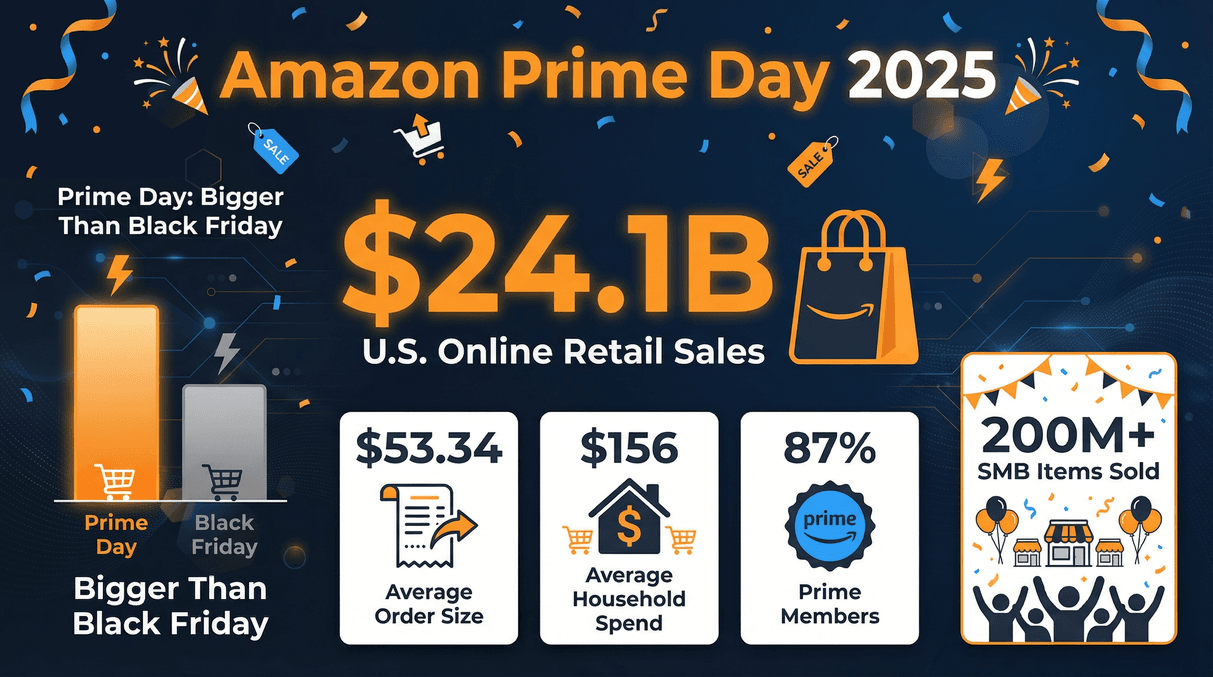
- Prime Day 2025: .
- Prime Day U.S. Online Retail Sales (2025): .
- Average Order Size: .
- Average Household Spend: .
- Prime Day Shoppers Who Are Prime Members: .
- SMB Items Sold on Prime Day (2024): .
Prime Day now regularly outpaces Black Friday and Cyber Monday on Amazon’s own platform.
Amazon Customer and Traffic Statistics
Amazon’s reach is, frankly, wild.
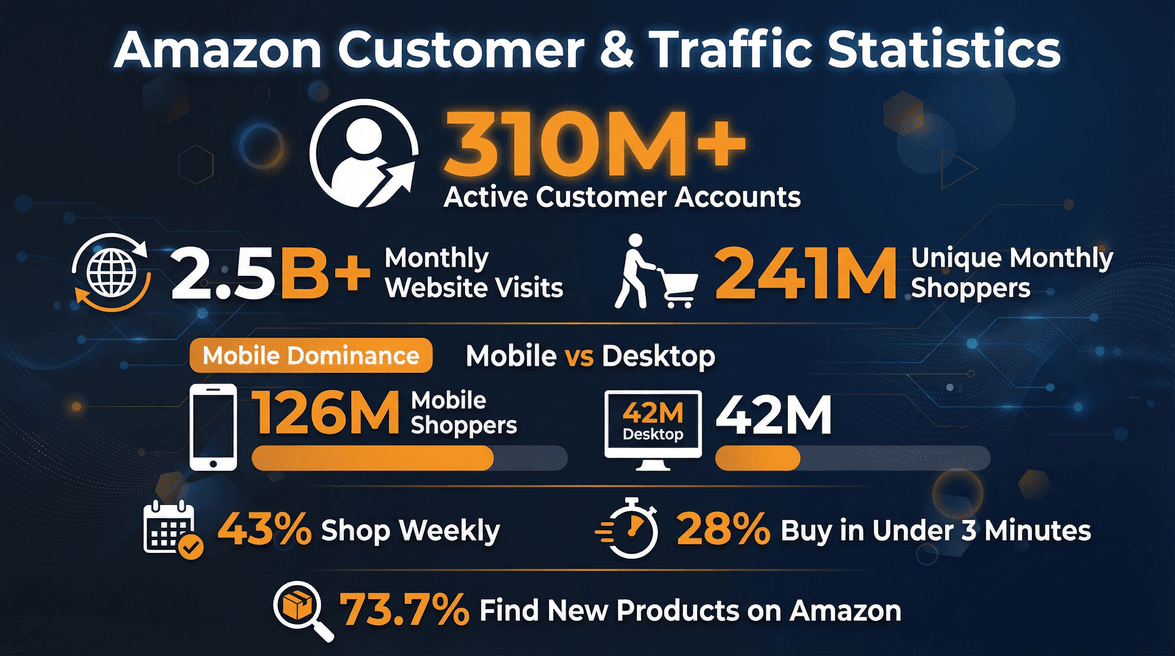
- Active Customer Accounts: .
- Monthly Website Visits: .
- Unique Monthly Shoppers: .
- Mobile vs. Desktop: vs. 42M on desktop in the U.S.
- Shopping Frequency: .
- Time Spent Shopping: .
Amazon is a daily utility for millions—sometimes it feels like it’s just a tap away (because it is).
Amazon Brand Value and Market Position
Amazon isn’t just big—it’s one of the most valuable brands on the planet.
- Brand Value (2025): .
- Market Cap (2025): .
- U.S. E-commerce Market Share: .
- Cloud Market Share: .
- Fortune/Forbes Rankings: Top 5 globally by revenue, profit, and assets ().
Amazon is now as much a tech company as it is a retailer.
Amazon’s Physical Presence: Stores, Devices, and More
Amazon’s not just digital—it’s in your neighborhood and your living room.
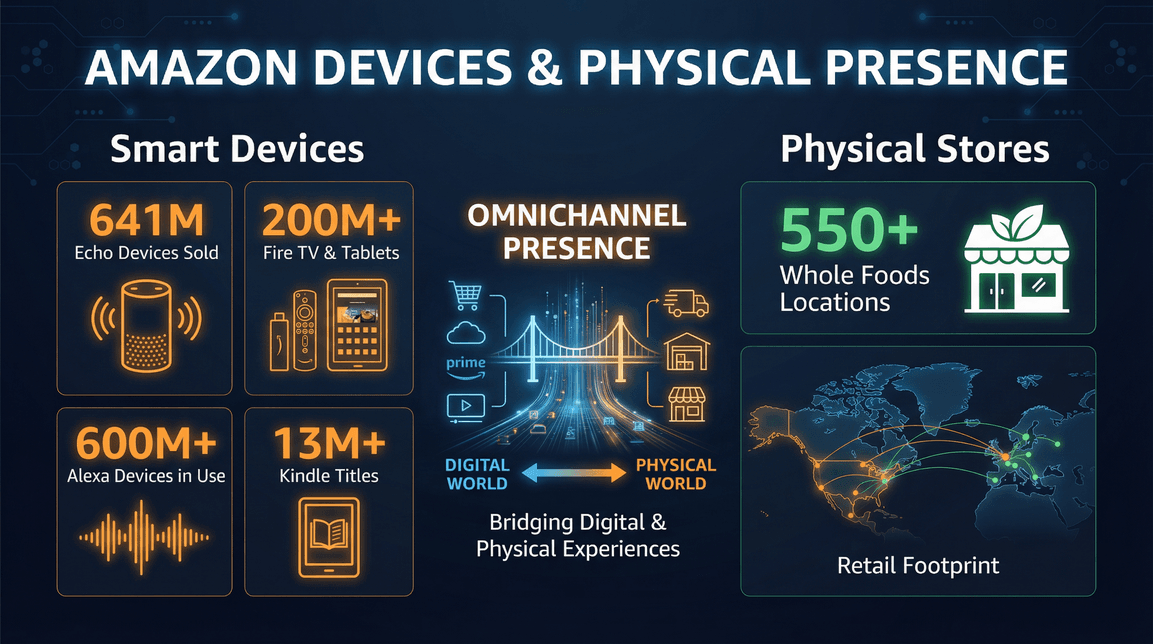
- Whole Foods Stores: .
- Amazon Fresh & Go Stores: 20+ Fresh, dozens of Go (but many closing in favor of Whole Foods) ().
- Amazon Echo Devices Sold: .
- Alexa Devices in Use: .
- Fire TV & Tablets Sold: .
- Kindle Store Titles: .
Amazon’s devices are everywhere—sometimes I wonder if my toaster will start recommending me books soon.
Amazon Sustainability and Social Impact Statistics
Amazon’s scale means its sustainability efforts matter—a lot.
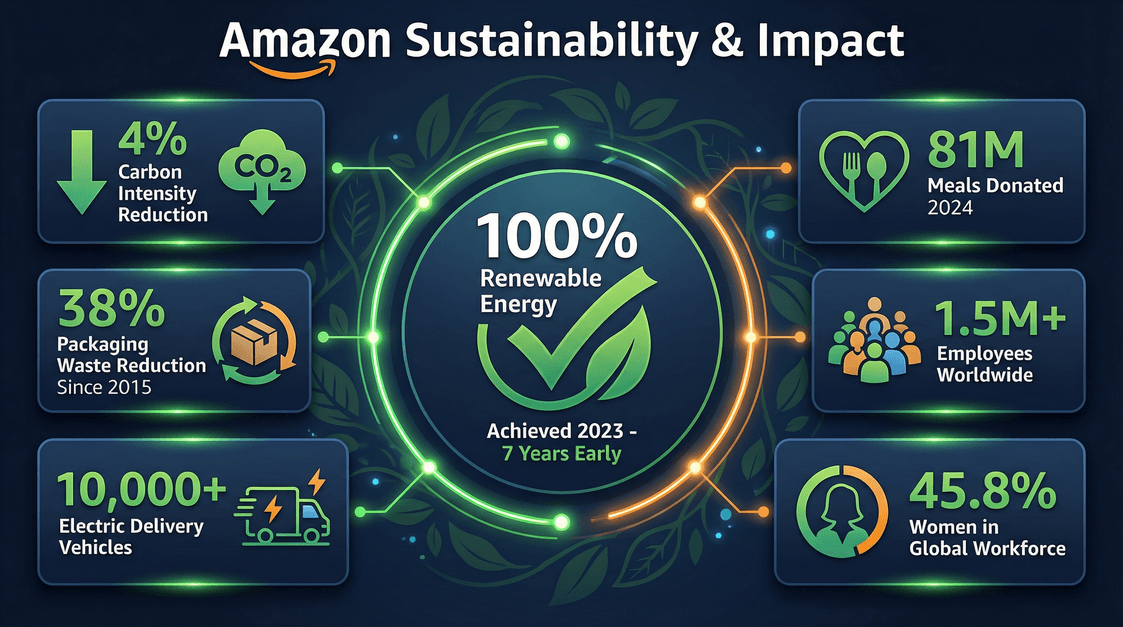
- 100% Renewable Energy: Achieved in 2023, .
- Carbon Emissions: .
- Electric Delivery Vehicles: .
- Packaging Waste Reduction: .
- Food Donations: .
- Diversity: .
Amazon’s environmental footprint is massive, but so is its potential for positive impact.
Amazon Global Expansion: International Sales and Reach
Amazon’s not just an American story—it’s a global one.
- International Sales (2024): .
- Country Marketplaces: .
- India Users: .
- Europe Revenue (2024): ~$100B (combined UK, DE, FR, IT, ES, NL, SE, PL).
- Global Shipping: .
Amazon is still expanding, especially in emerging markets.
Amazon Employee and Workplace Statistics
With over 1.5 million employees, Amazon is a workplace behemoth.
- Total Employees (2023): .
- Warehouse vs. Corporate: Majority in operations; ~300K in corporate/tech.
- Diversity (U.S.): .
- Average Ops Wage: .
- Employee Stockholders: .
Amazon’s workforce is as diverse as its product catalog—and just as busy.
Amazon Shopping Trends: Consumer Behavior Insights
How are people shopping on Amazon in 2026? Fast, mobile, and often.
- Mobile Shopping: .
- Quick Purchases: .
- Prime Member Engagement: .
- Product Discovery: .
- Voice Commerce: .
- Grocery Shoppers: .
Amazon has set the pace for convenience and speed in online shopping.
Amazon Statistics: Quick Facts & Surprising Numbers
Let’s rapid-fire some jaw-dropping stats:
- $1.2M spent per minute on Amazon ().
- 600M+ products for sale ().
- 8,300 items sold per minute by U.S. sellers ().
- 9B+ items delivered to Prime members in 2024 ().
- Alexa in 600M+ devices worldwide ().
- $88.5B spent on tech/R&D in 2024 ().
- 400M+ square feet of warehouse space ().
- 520,000+ robots in warehouses ().
- Prime Day > Black Friday/Cyber Monday on Amazon’s platform ().
If you’re ever feeling unproductive, just remember: somewhere, an Amazon robot is moving a shelf at 3 a.m.
So, what do all these Amazon statistics, Amazon Prime statistics, and Amazon sales statistics really tell us about 2026?
- Amazon’s scale is unprecedented. With revenue approaching , a customer base larger than most countries, and a logistics network that delivers billions of items at breakneck speed, Amazon is setting the standard for what’s possible in commerce and tech.
- Diversification is Amazon’s superpower. Whether it’s AWS, advertising, or the marketplace, Amazon’s multiple engines mean it’s resilient and always growing somewhere—even if one area slows down.
- Prime is the ultimate loyalty program. With and perks that keep expanding, Prime is the moat that competitors struggle to cross.
- Consumer expectations have shifted. Fast shipping, mobile-first shopping, and discovery on Amazon are the new normal. If you’re a business, you have to meet customers where they are—and increasingly, that’s on Amazon.
- Global growth is still happening. Amazon’s international expansion means new opportunities (and new competition) in markets worldwide.
- Opportunities abound—for those who can compete. With millions of sellers, standing out is tough, but the rewards are real: per year.
- Innovation and sustainability are front and center. From Alexa to electric vans to 100% renewable energy, Amazon is shaping the future of both tech and the environment.
As someone who’s spent years in SaaS and automation, I’m always fascinated by how Amazon’s numbers reflect not just business trends, but changes in how we all live, work, and shop. Whether you’re a seller looking for your next big break, a marketer planning your next campaign, or just a data nerd (no judgment—I’m right there with you), these statistics are your roadmap to Amazon’s world in 2026.
Want to dig deeper into data, automation, and e-commerce? Check out more insights on the or see how AI can help you automate your own Amazon research with . Because if there’s one thing Amazon teaches us, it’s that scale—and speed—matter.