
Picture this: You’ve spent months nurturing a promising lead, looping in your product team, customizing proposals, and scheduling demo after demo. The finish line is in sight… and then the deal stalls. Or worse, it disappears into the black hole of “no decision.” Sound familiar? Welcome to sales in 2026, where closing a deal feels less like a sprint and more like running an obstacle course—with a few extra hurdles thrown in for good measure.
In today’s digital-first, data-driven world, the sales process has become more complex, competitive, and, frankly, unpredictable than ever. The numbers don’t lie: the average B2B deal close rate is just 20%—meaning four out of five opportunities slip through the cracks—and sales cycles have stretched a whopping 16% longer than last year alone (). If you’re still relying on gut instinct and charisma to get deals across the finish line, it’s time to let the data lead the way.
As someone who’s spent years building SaaS and automation tools (and now leading Thunderbit), I’m obsessed with the numbers behind what really works in sales. So, let’s dig into the 40 most important sales closing statistics for 2026—plus the stories, strategies, and actionable insights behind them.
Quick-Glance: Top Sales Closing Statistics for 2026
For the skimmers, here’s your cheat sheet of the most eye-opening, actionable stats every sales leader and rep should know this year:
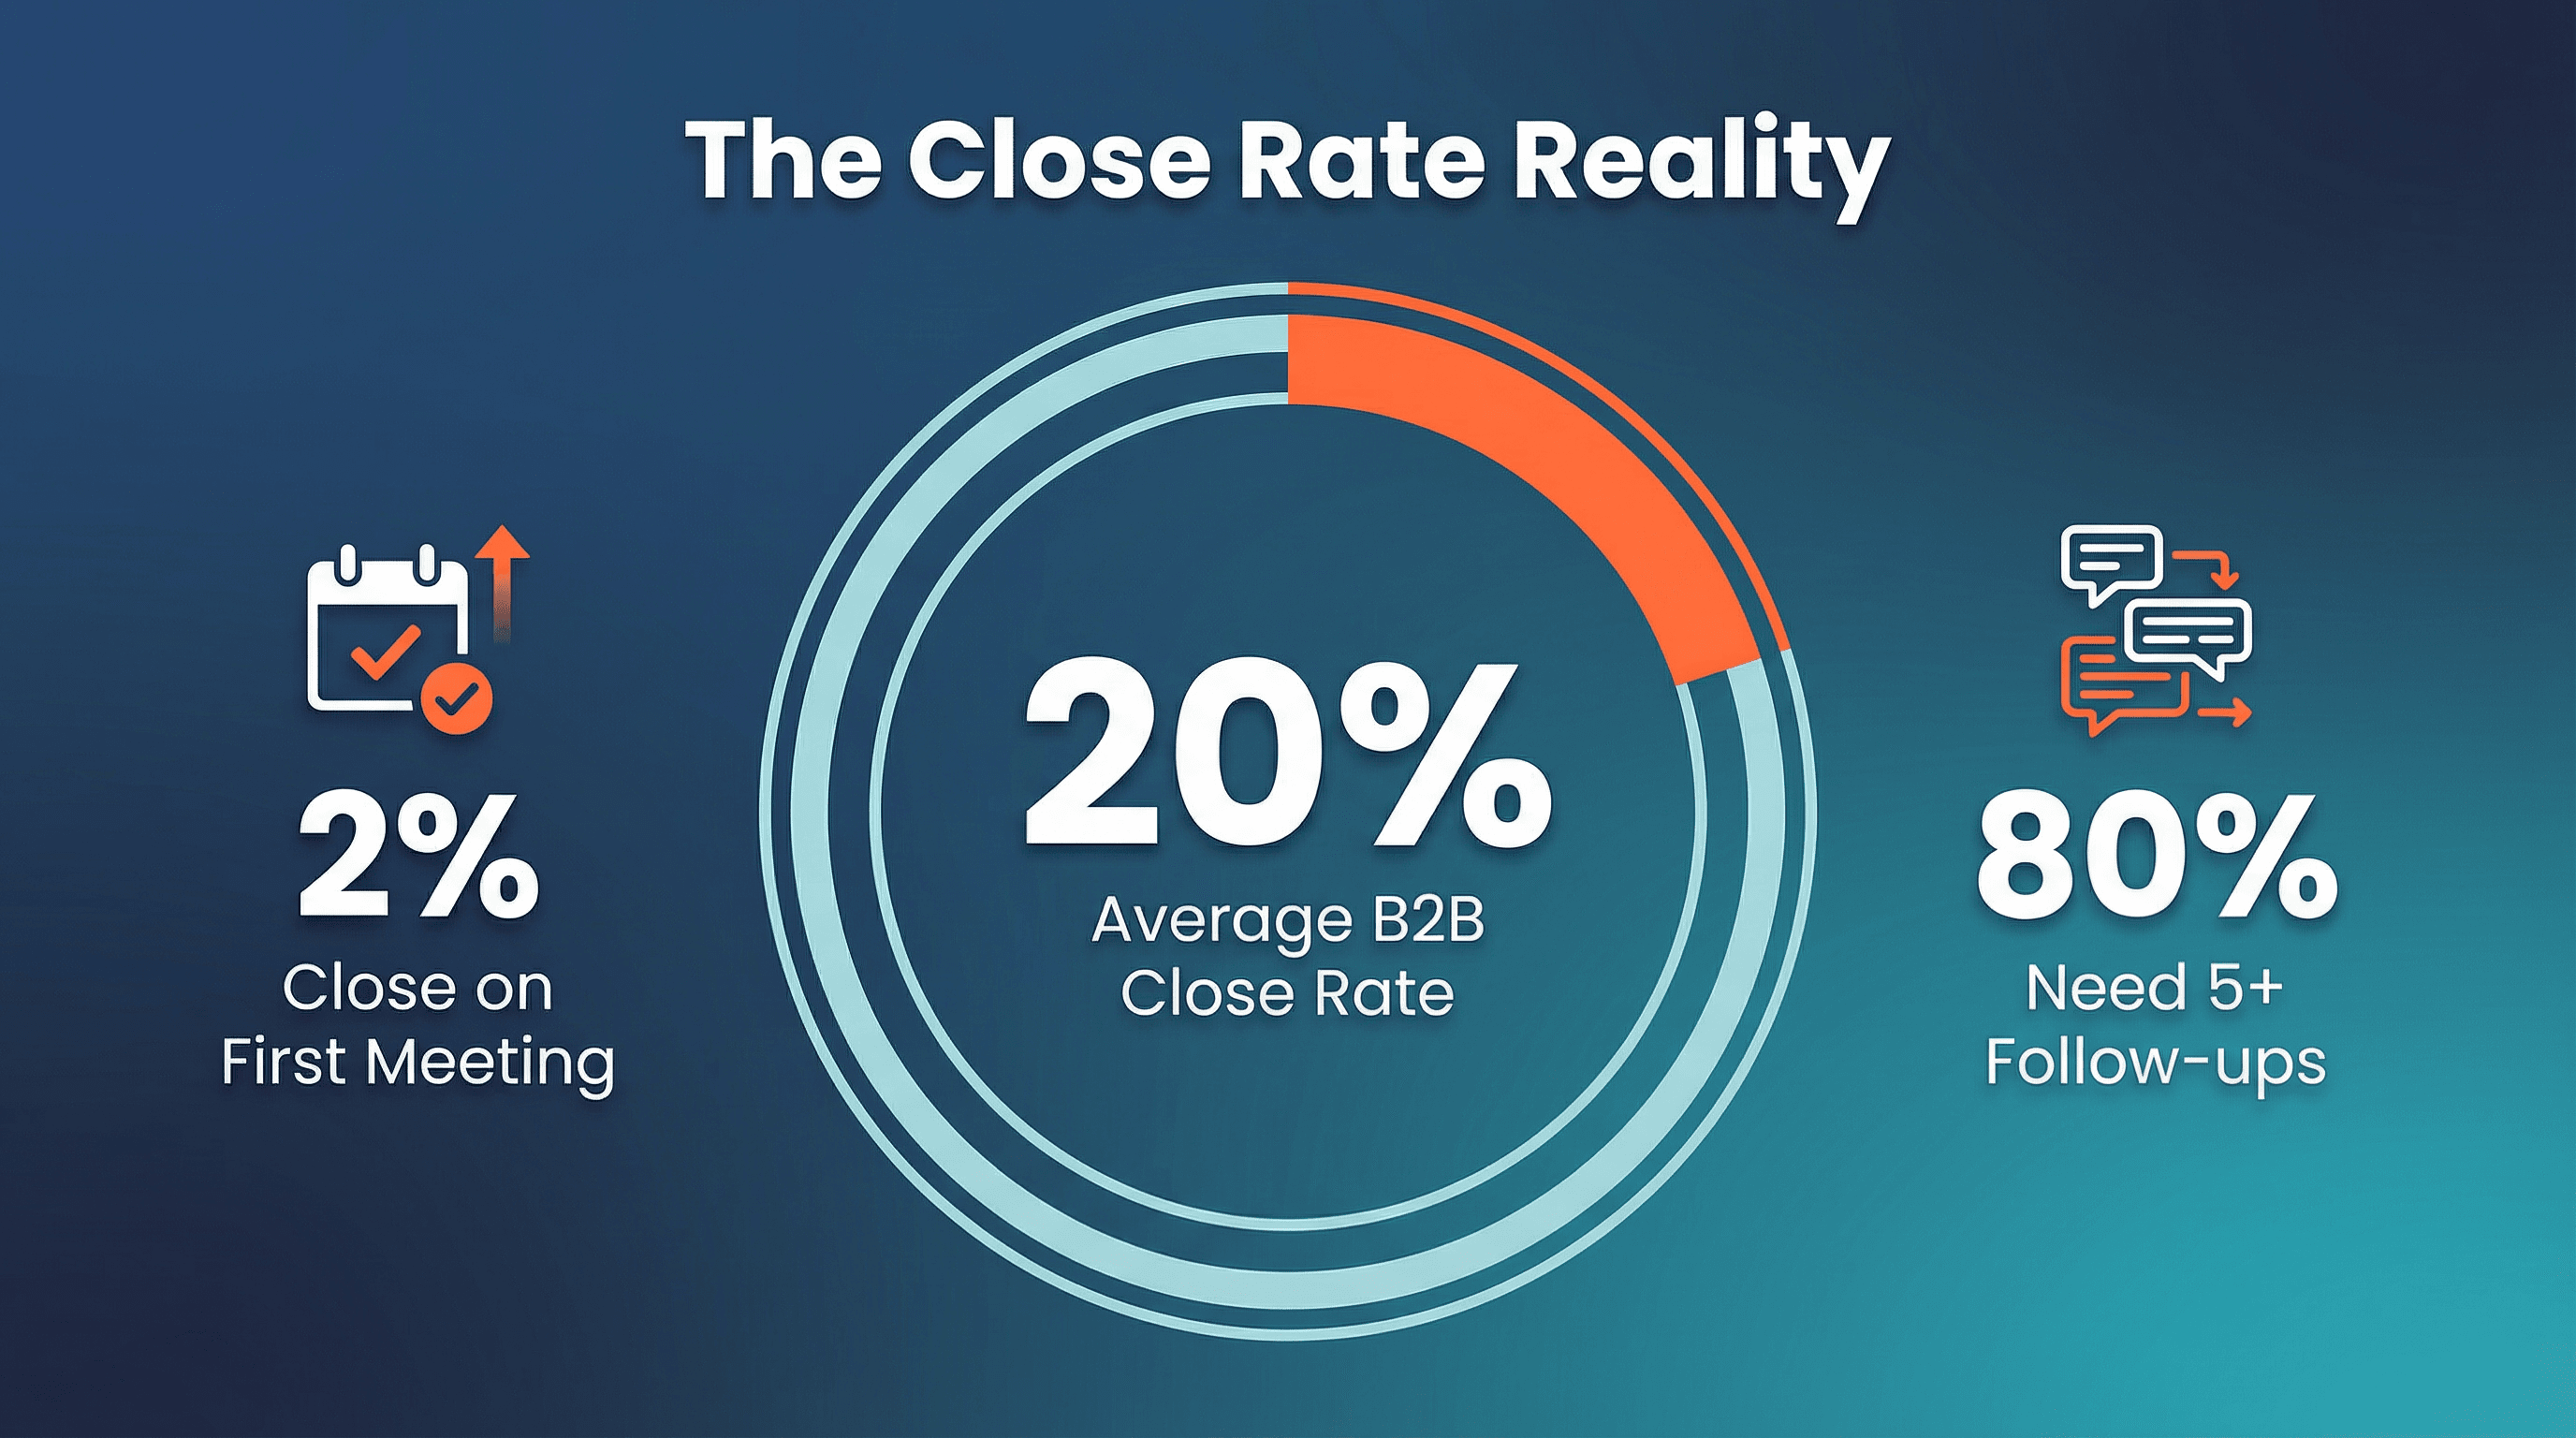
- Average B2B sales close rates hover around 20%. Most industries see only about one in five deals convert to a win ().
- Only 2% of sales close on the first meeting. The vast majority require multiple interactions and follow-ups ().
- 80% of deals require at least five follow-up touchpoints to close—yet 44% of reps give up after just one attempt (; ).
- The average B2B deal now involves ~5 decision-makers on the buyer’s side ().
- Enterprise deals take 64% longer to close than small business deals ().
- The average B2B buying journey spans about 7 months (211 days) from first touch to close ().
- A typical B2B deal requires 31 touchpoints (calls, emails, meetings, etc.) before closing ().
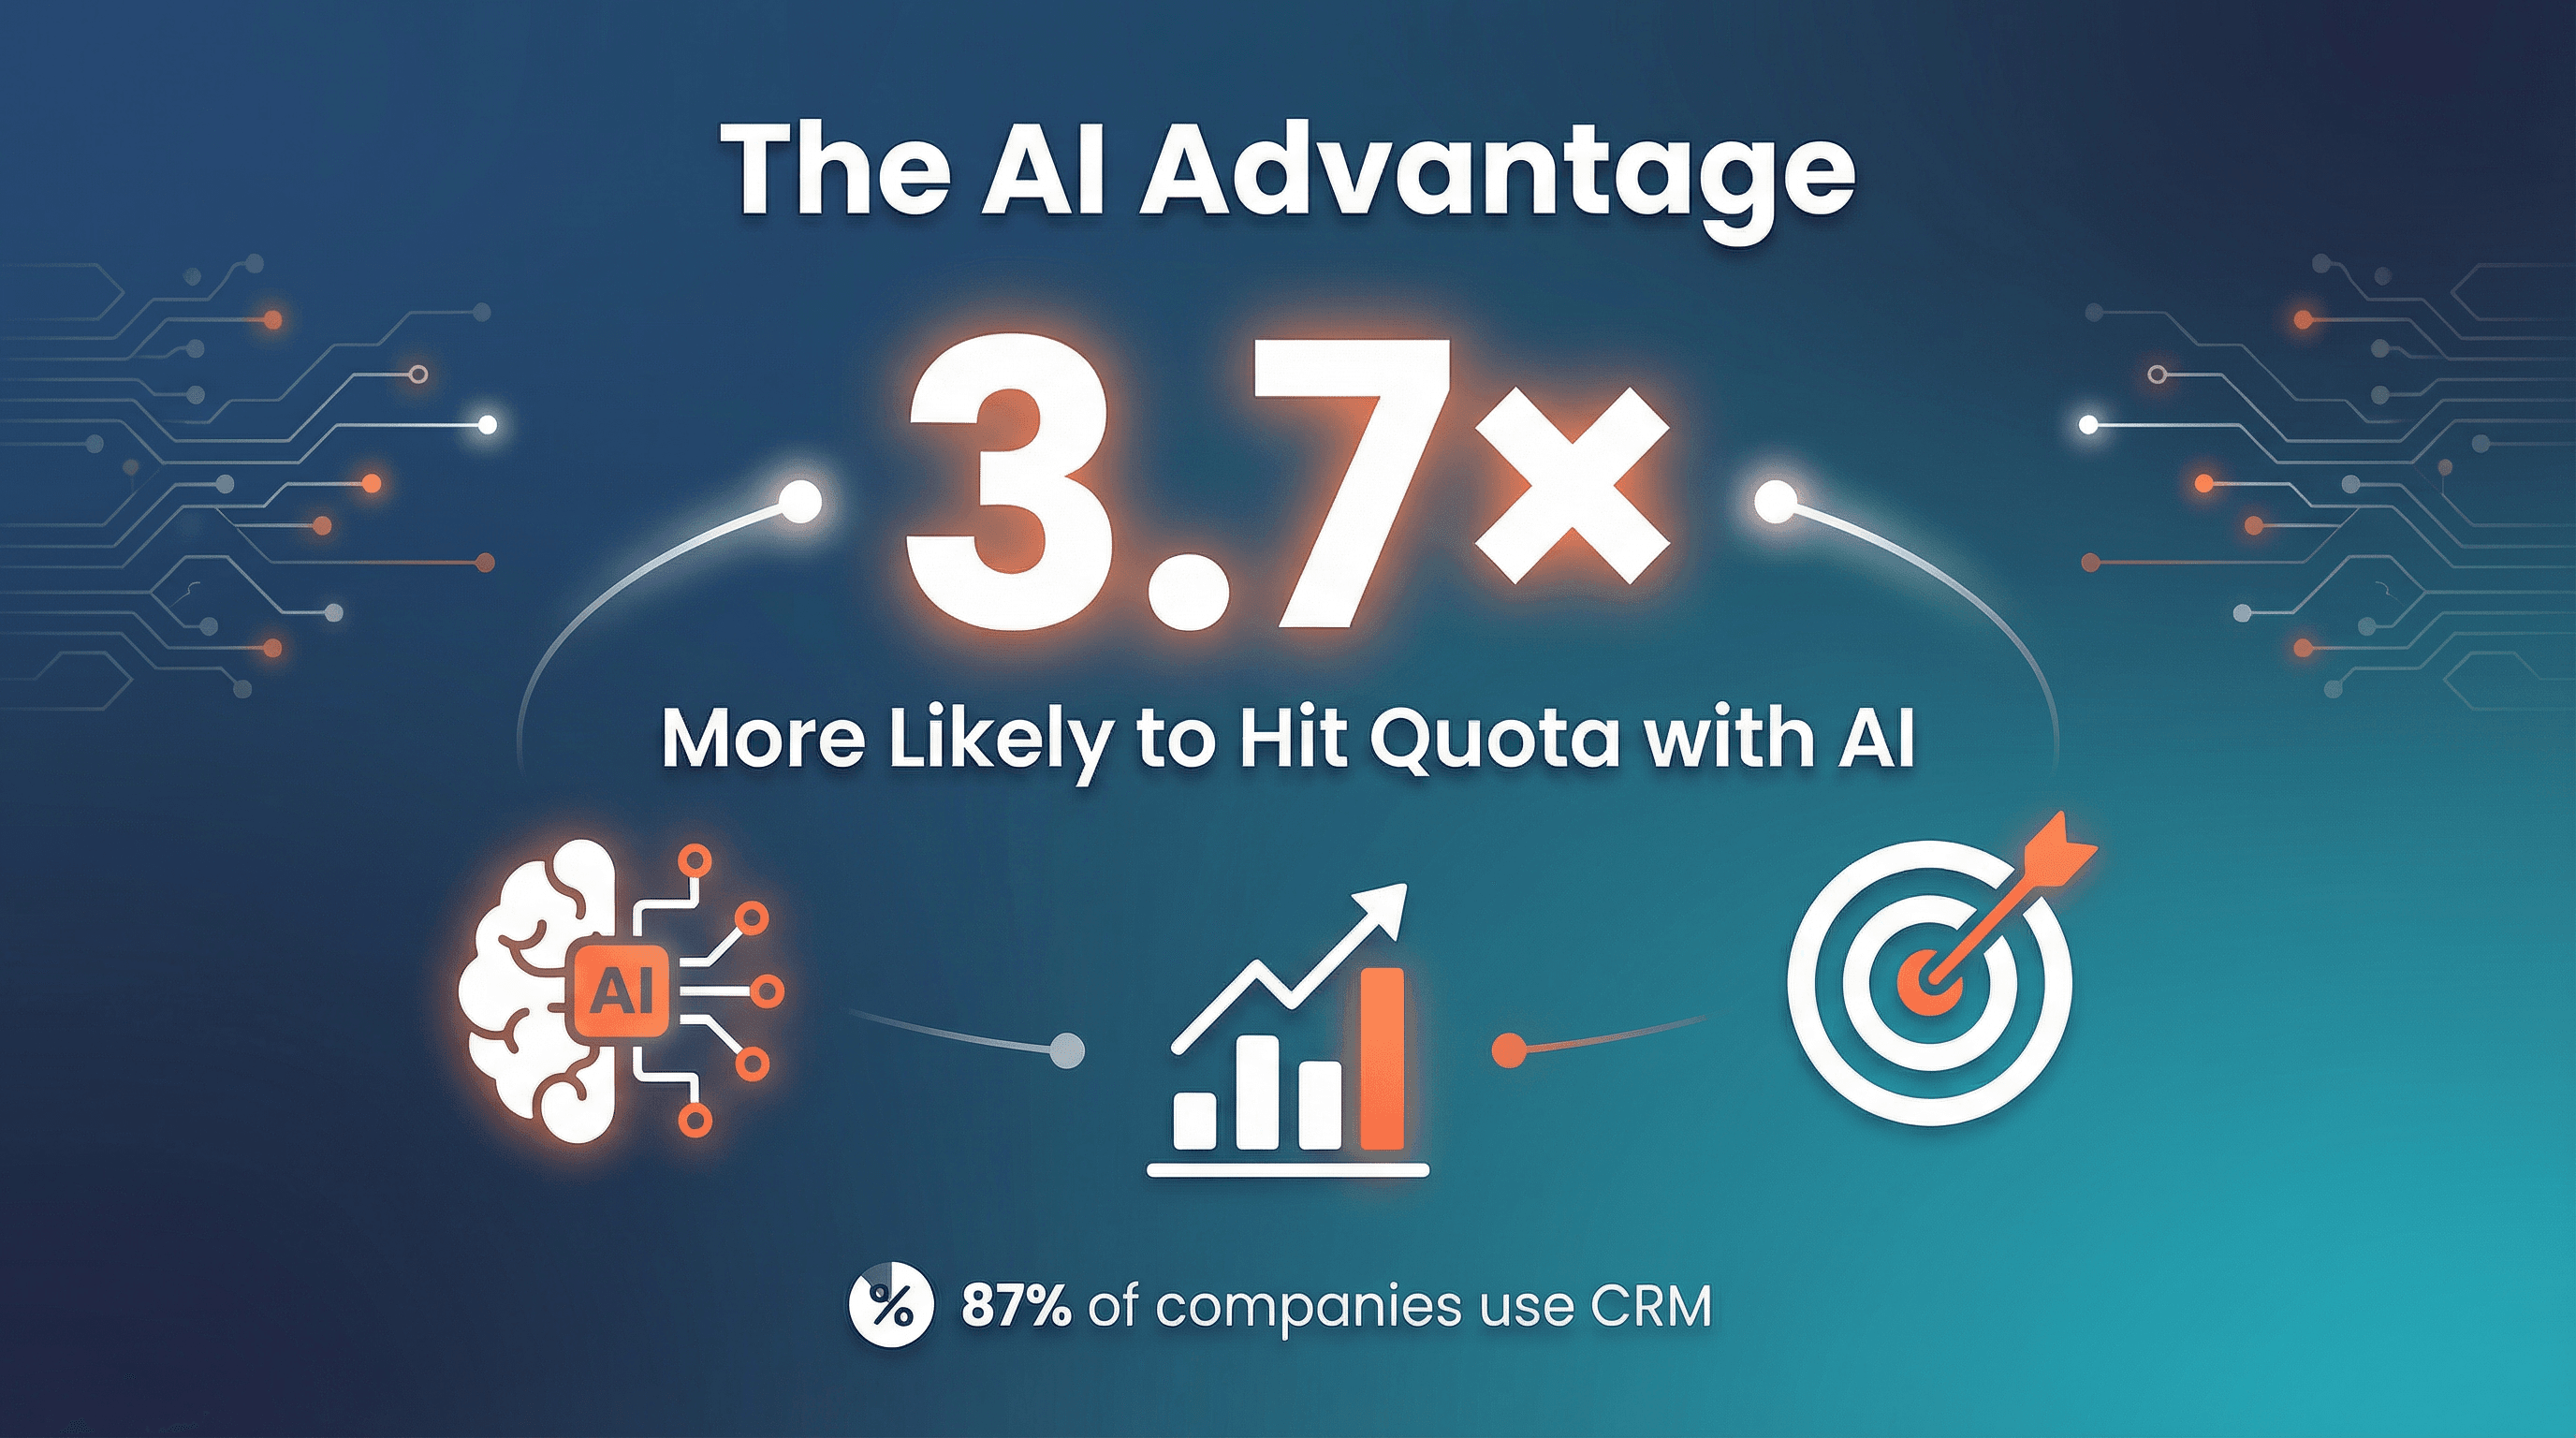
- Sales reps who leverage AI tools are 3.7× more likely to meet their quotas ().
- Well-qualified opportunities close at 50% on average, while poorly qualified ones close at just 8% ().
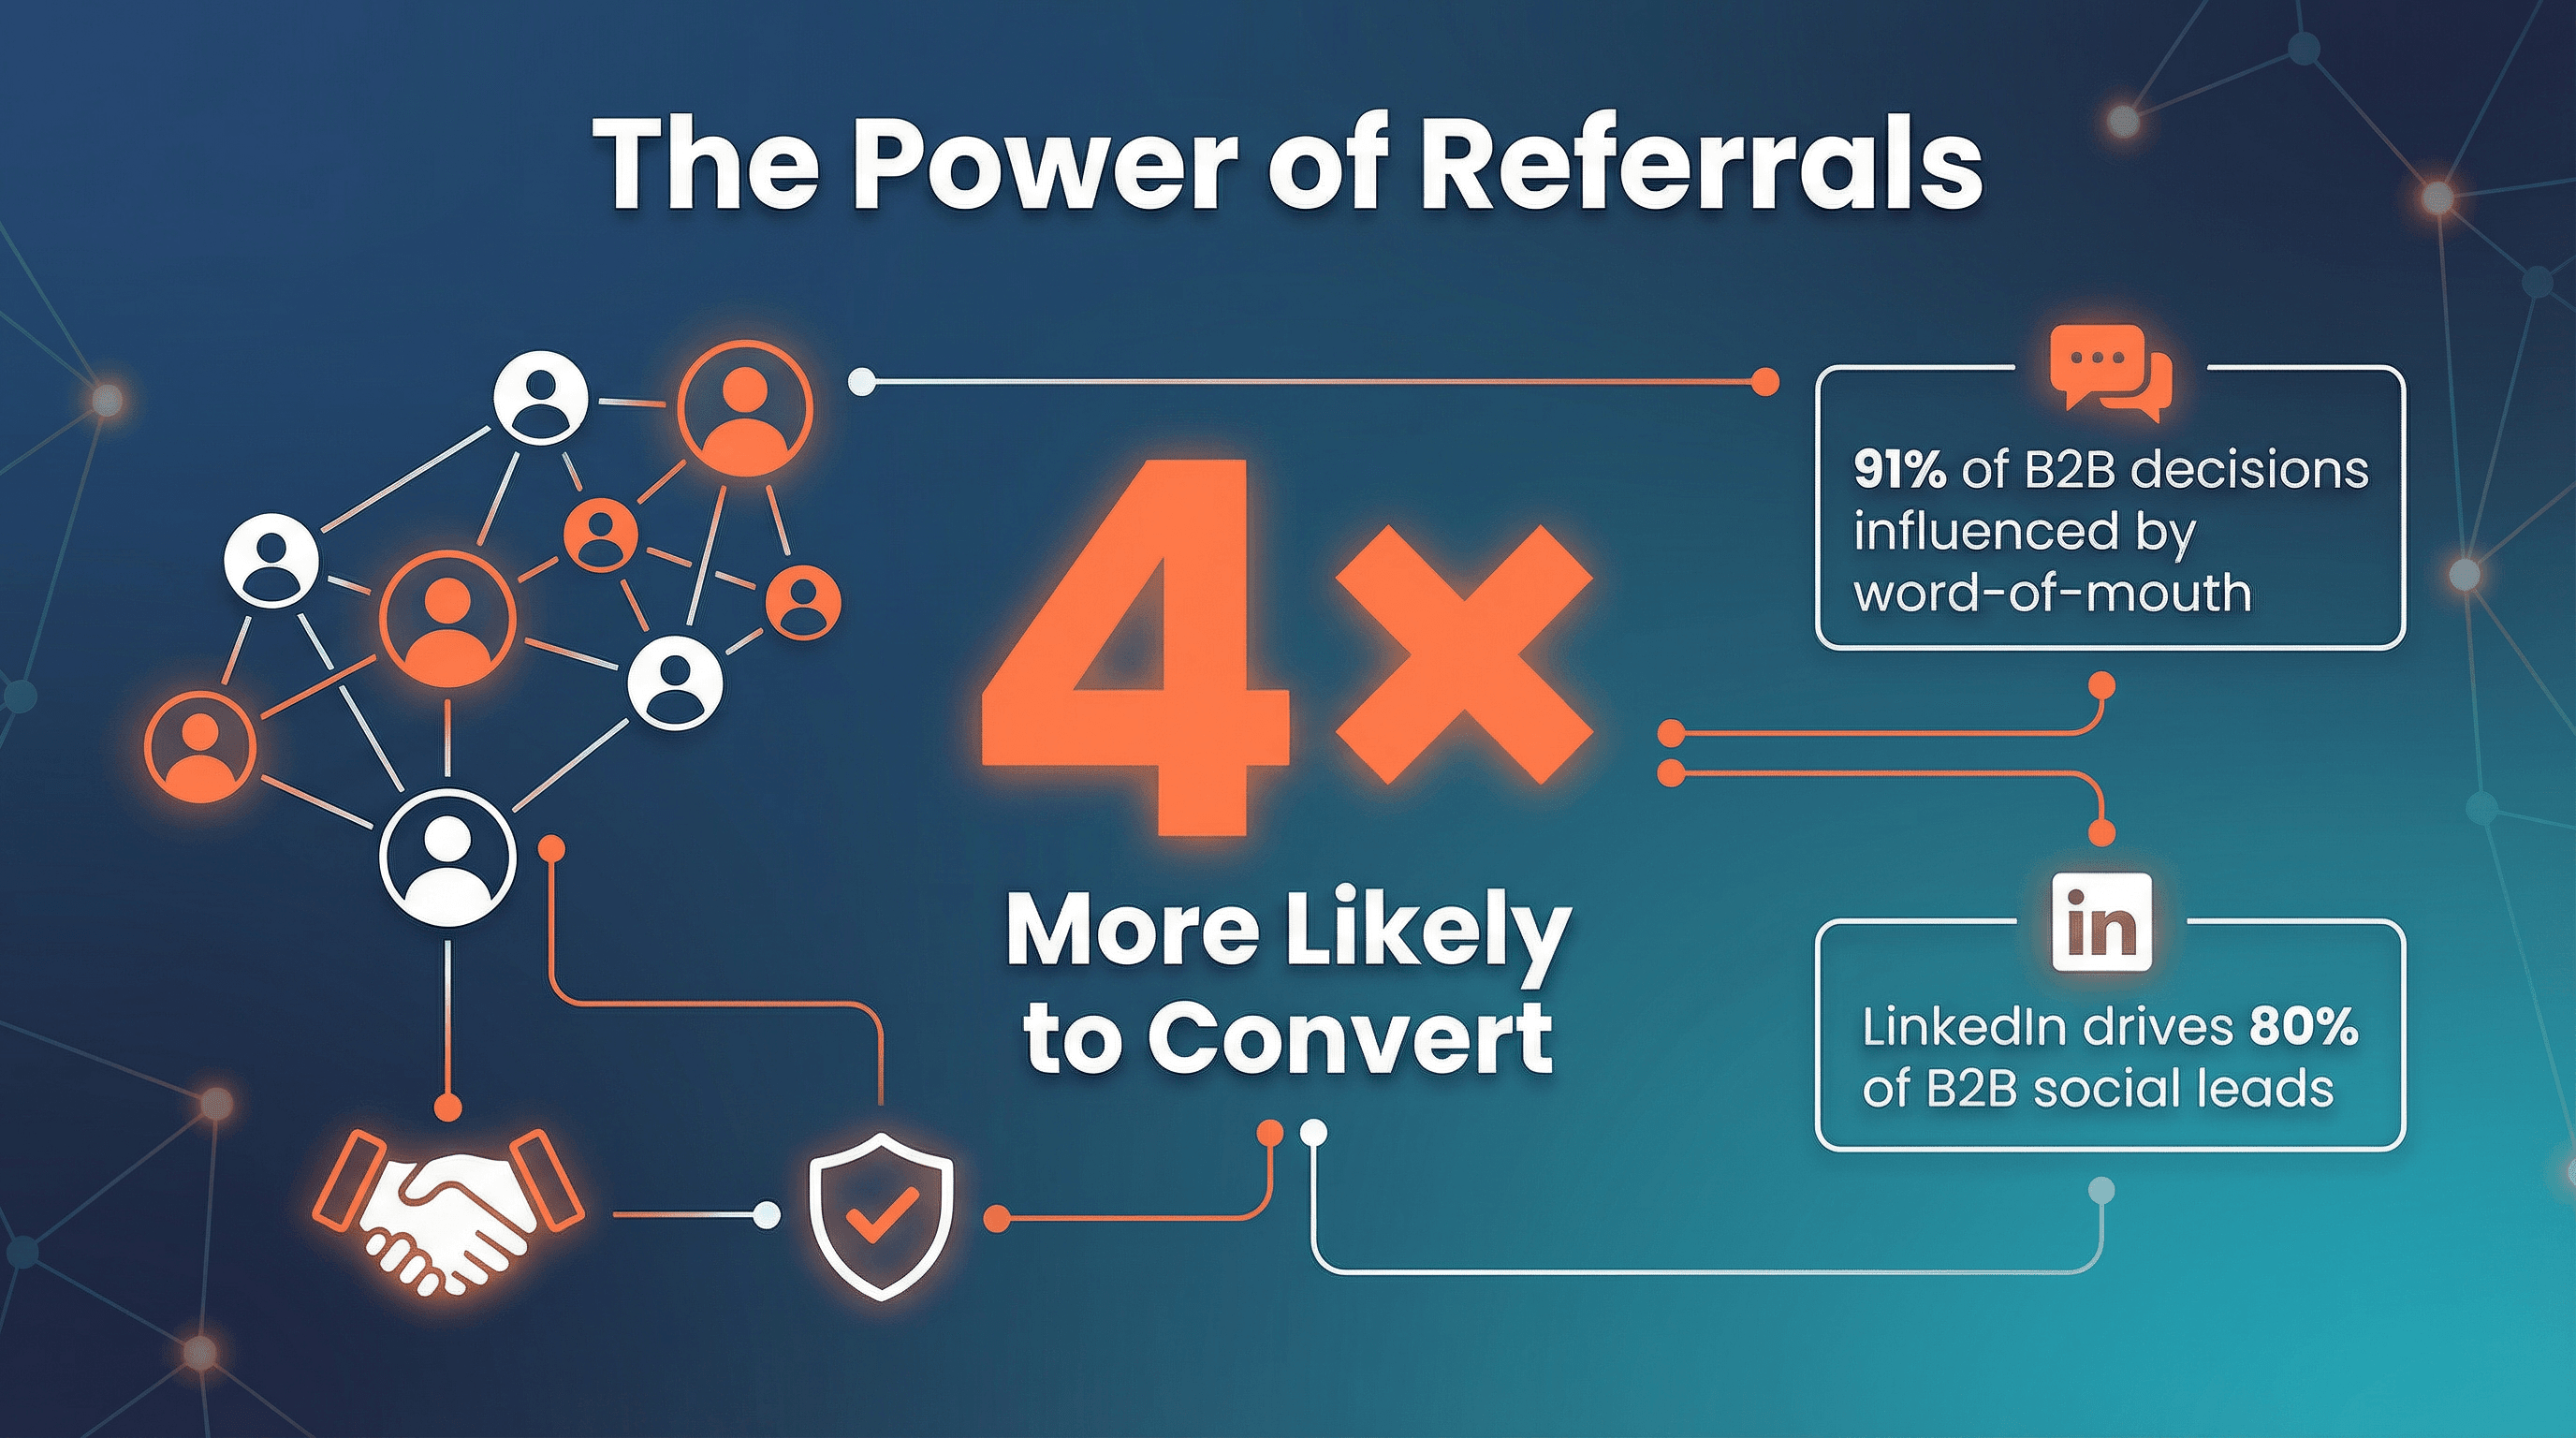
- Referrals are 4× more likely to convert than non-referral leads ().
If you’re thinking, “Wow, that’s a lot of hurdles,” you’re right. But each of these stats is also a roadmap for where to focus your energy, tech stack, and training. Let’s break down what these numbers mean—and how you can use them to close more deals in 2026.
Why do I geek out over sales closing statistics? Because, as the old saying goes, “what gets measured gets managed.” In today’s sales environment, tracking metrics like close rates, win rates, and sales cycle lengths isn’t just a nice-to-have—it’s essential for forecasting, resource allocation, and continuous improvement.
These stats are your reality check. For example, if your average close rate is 20%, you know you need at least 5× pipeline coverage to hit your revenue goals (). High-performing teams are about 50% more likely to make performance data widely available internally, which leads to better coaching and faster course-correction (). And companies that rigorously manage their pipelines (think: at least 3 hours per month per rep) see 11% higher revenue growth than those that don’t ().
But stats aren’t just about hitting quota—they also reveal how the sales landscape is shifting. With more decision-makers, longer cycles, and digital-first buyers, the old “lone wolf” approach is out. Data-driven, multi-threaded selling is in. And if you’re not tracking where deals are stalling, you’re flying blind.
Average Sales Close Rates by Industry
 Let’s get specific: What’s a “good” close rate in your industry? Here’s how the numbers stack up for 2025–2026:
A few quick takeaways:
- SMB deals and lower-priced offerings tend to close at higher rates (up to 30–35%), while enterprise deals often close at only 15–18% ().
- If your close rate is below these benchmarks, it’s time to dig into your qualification process or ICP targeting.
- In SaaS, product-led growth and quick demos help boost close rates, while in biotech or enterprise IT, lengthy pilots and strict reviews drag them down.
My advice? Benchmark your team’s close rates by industry or product line and compare them to these numbers. A simple bar chart in your next QBR can spark some lively debate—and maybe a few “aha” moments.
Sales Cycle Length: How Long Does It Take to Close a Deal in 2026?
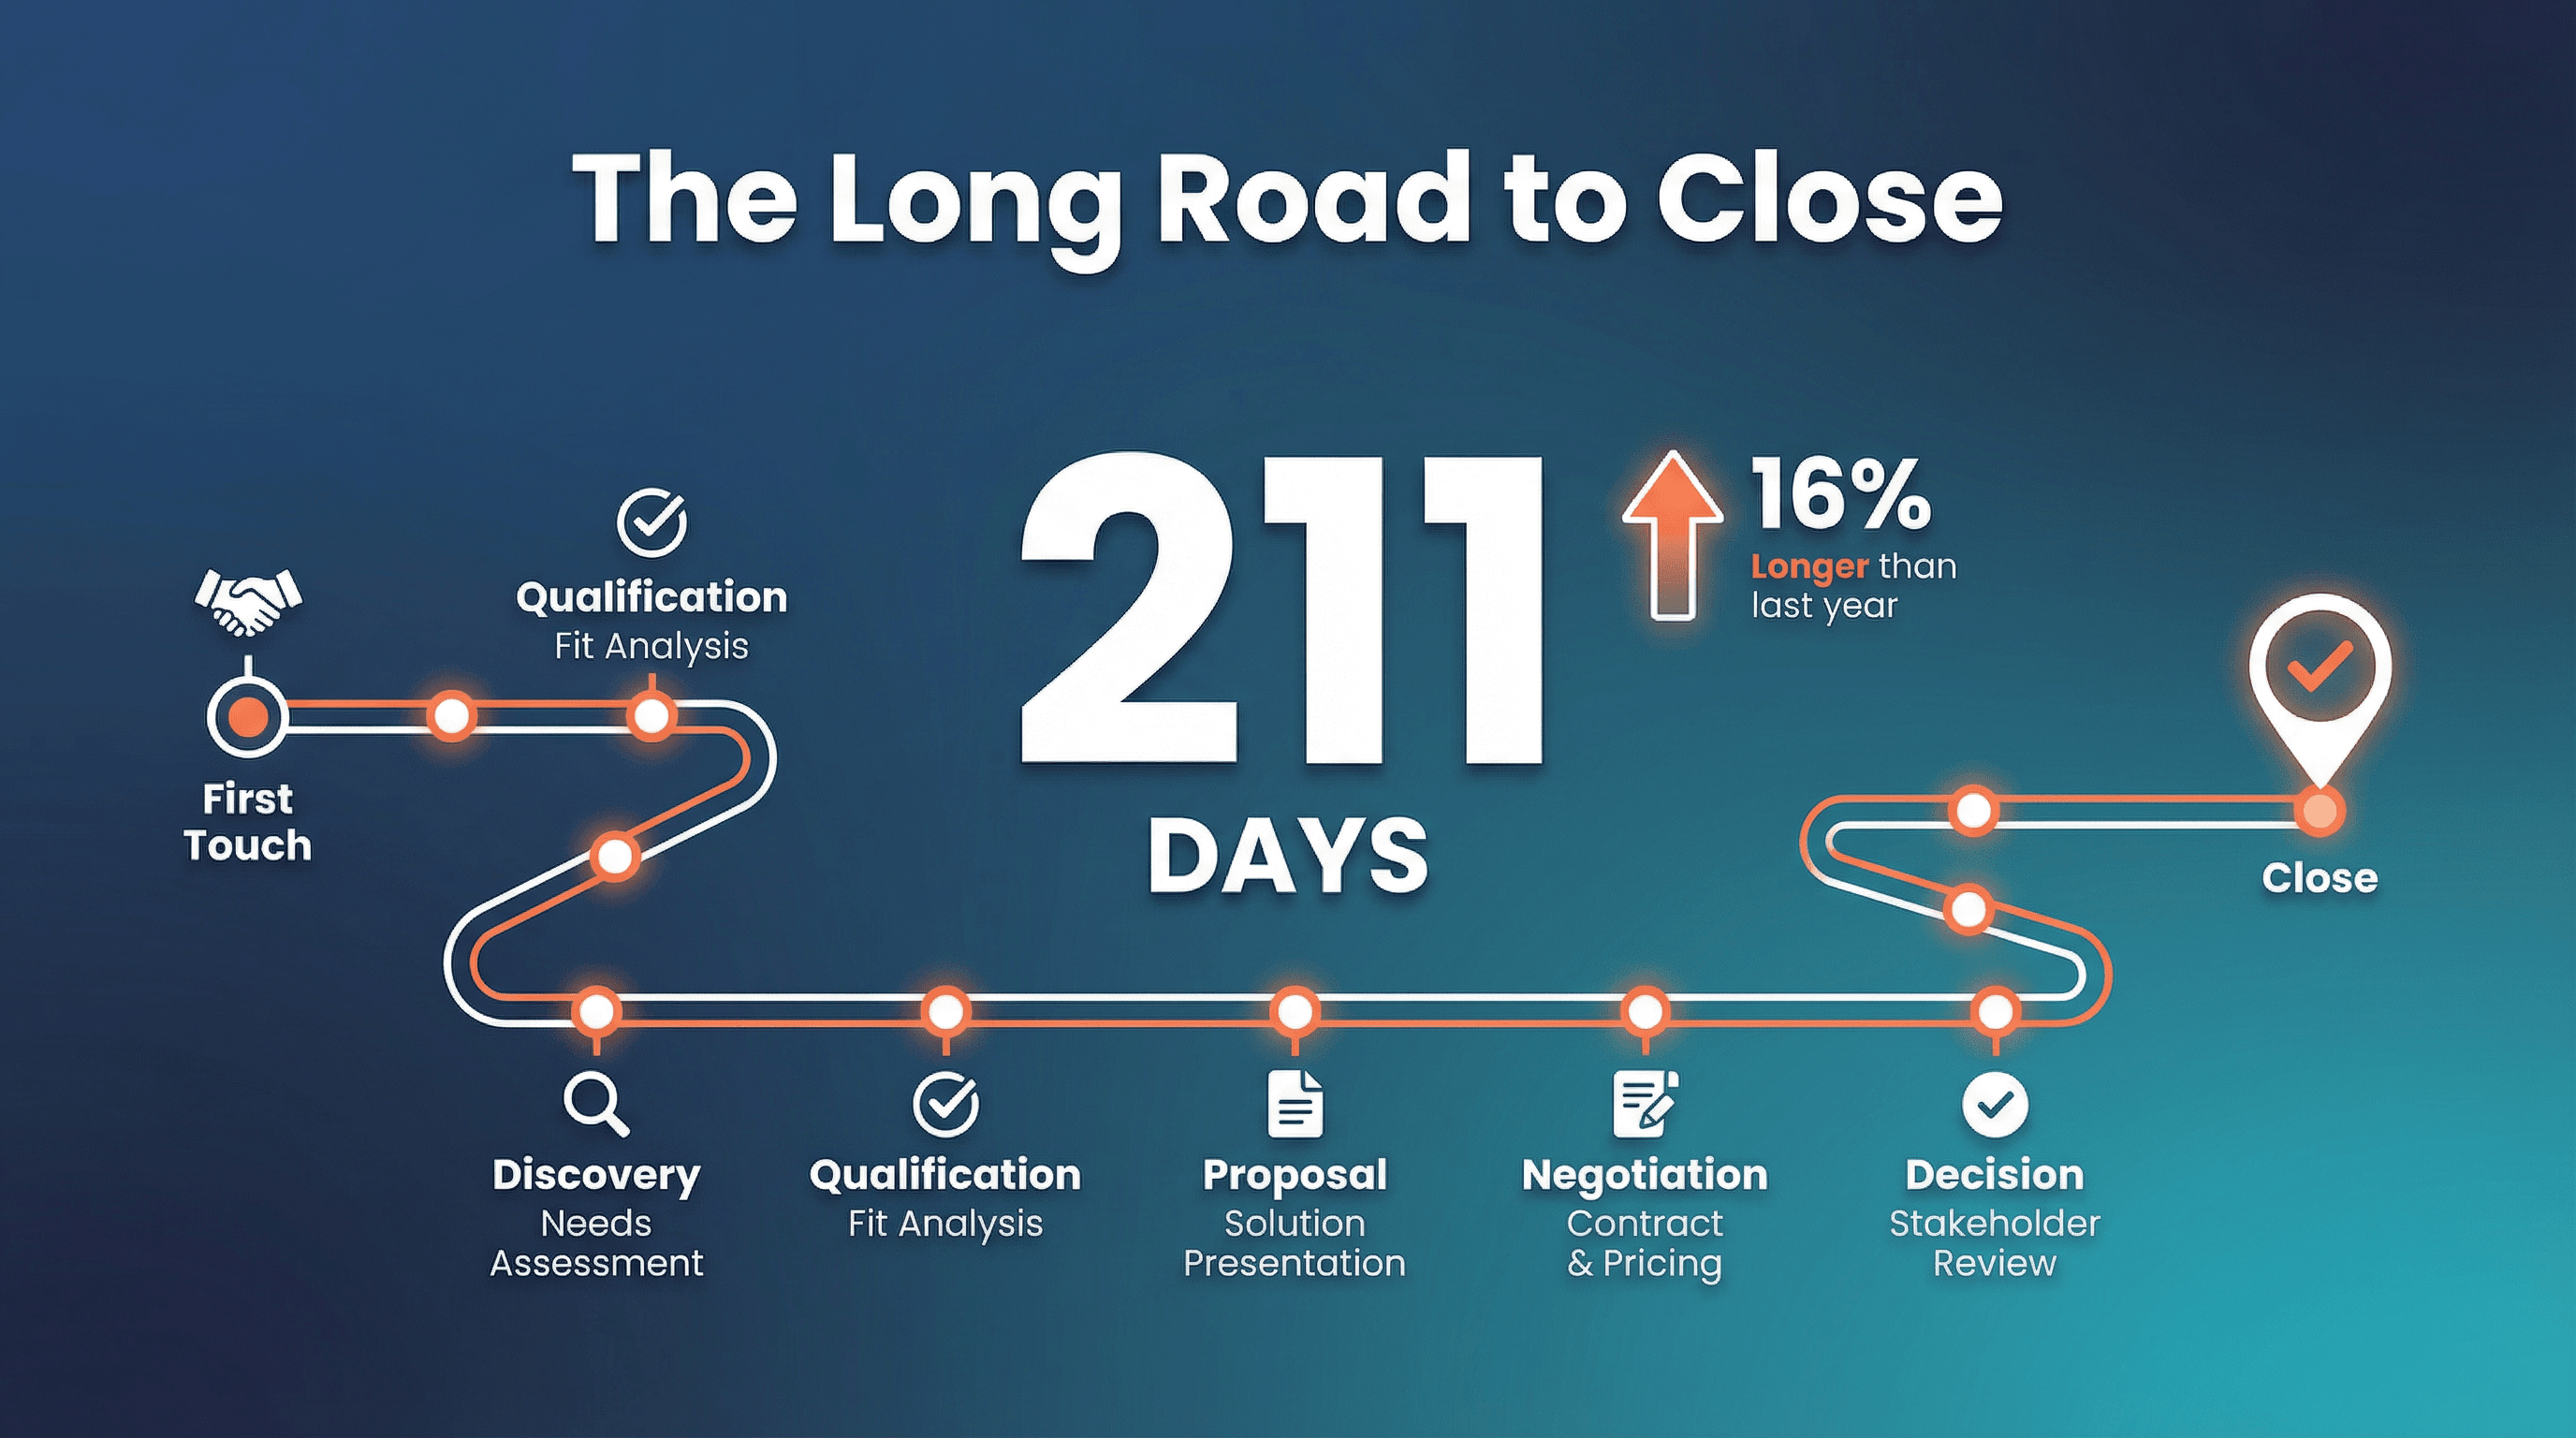 If it feels like deals are dragging on forever, you’re not imagining things. The average B2B deal now takes 6–7 months to close—211 days from first touch to signature (). That’s up 16% from just a year ago ().
Here’s how cycle length breaks down by deal size ():
- Deals under $10k: 15–30 days
- $10–50k: 1–2 months
- $50–100k: 2–3 months
- $100k+: 3–6+ months (and enterprise deals can easily run 9–12 months)
Why so long? More decision-makers, tighter budgets, procurement and legal delays, and—let’s be honest—good old-fashioned “analysis paralysis.” In fact, 40–60% of “lost” deals are actually lost to no decision at all ().
Tips for shortening the cycle:
- Respond to new leads within an hour—you’re 7× more likely to qualify them ().
- Streamline scheduling (use automated calendar links).
- Multi-thread your deals (engage multiple contacts).
- Always secure a clear next step before ending a call.
And remember: If your average cycle is 90 days but a deal’s been open for 180, it’s probably at risk. Use your CRM to flag these for review.
The Power of Persistence: Follow-Ups and Their Impact on Closing
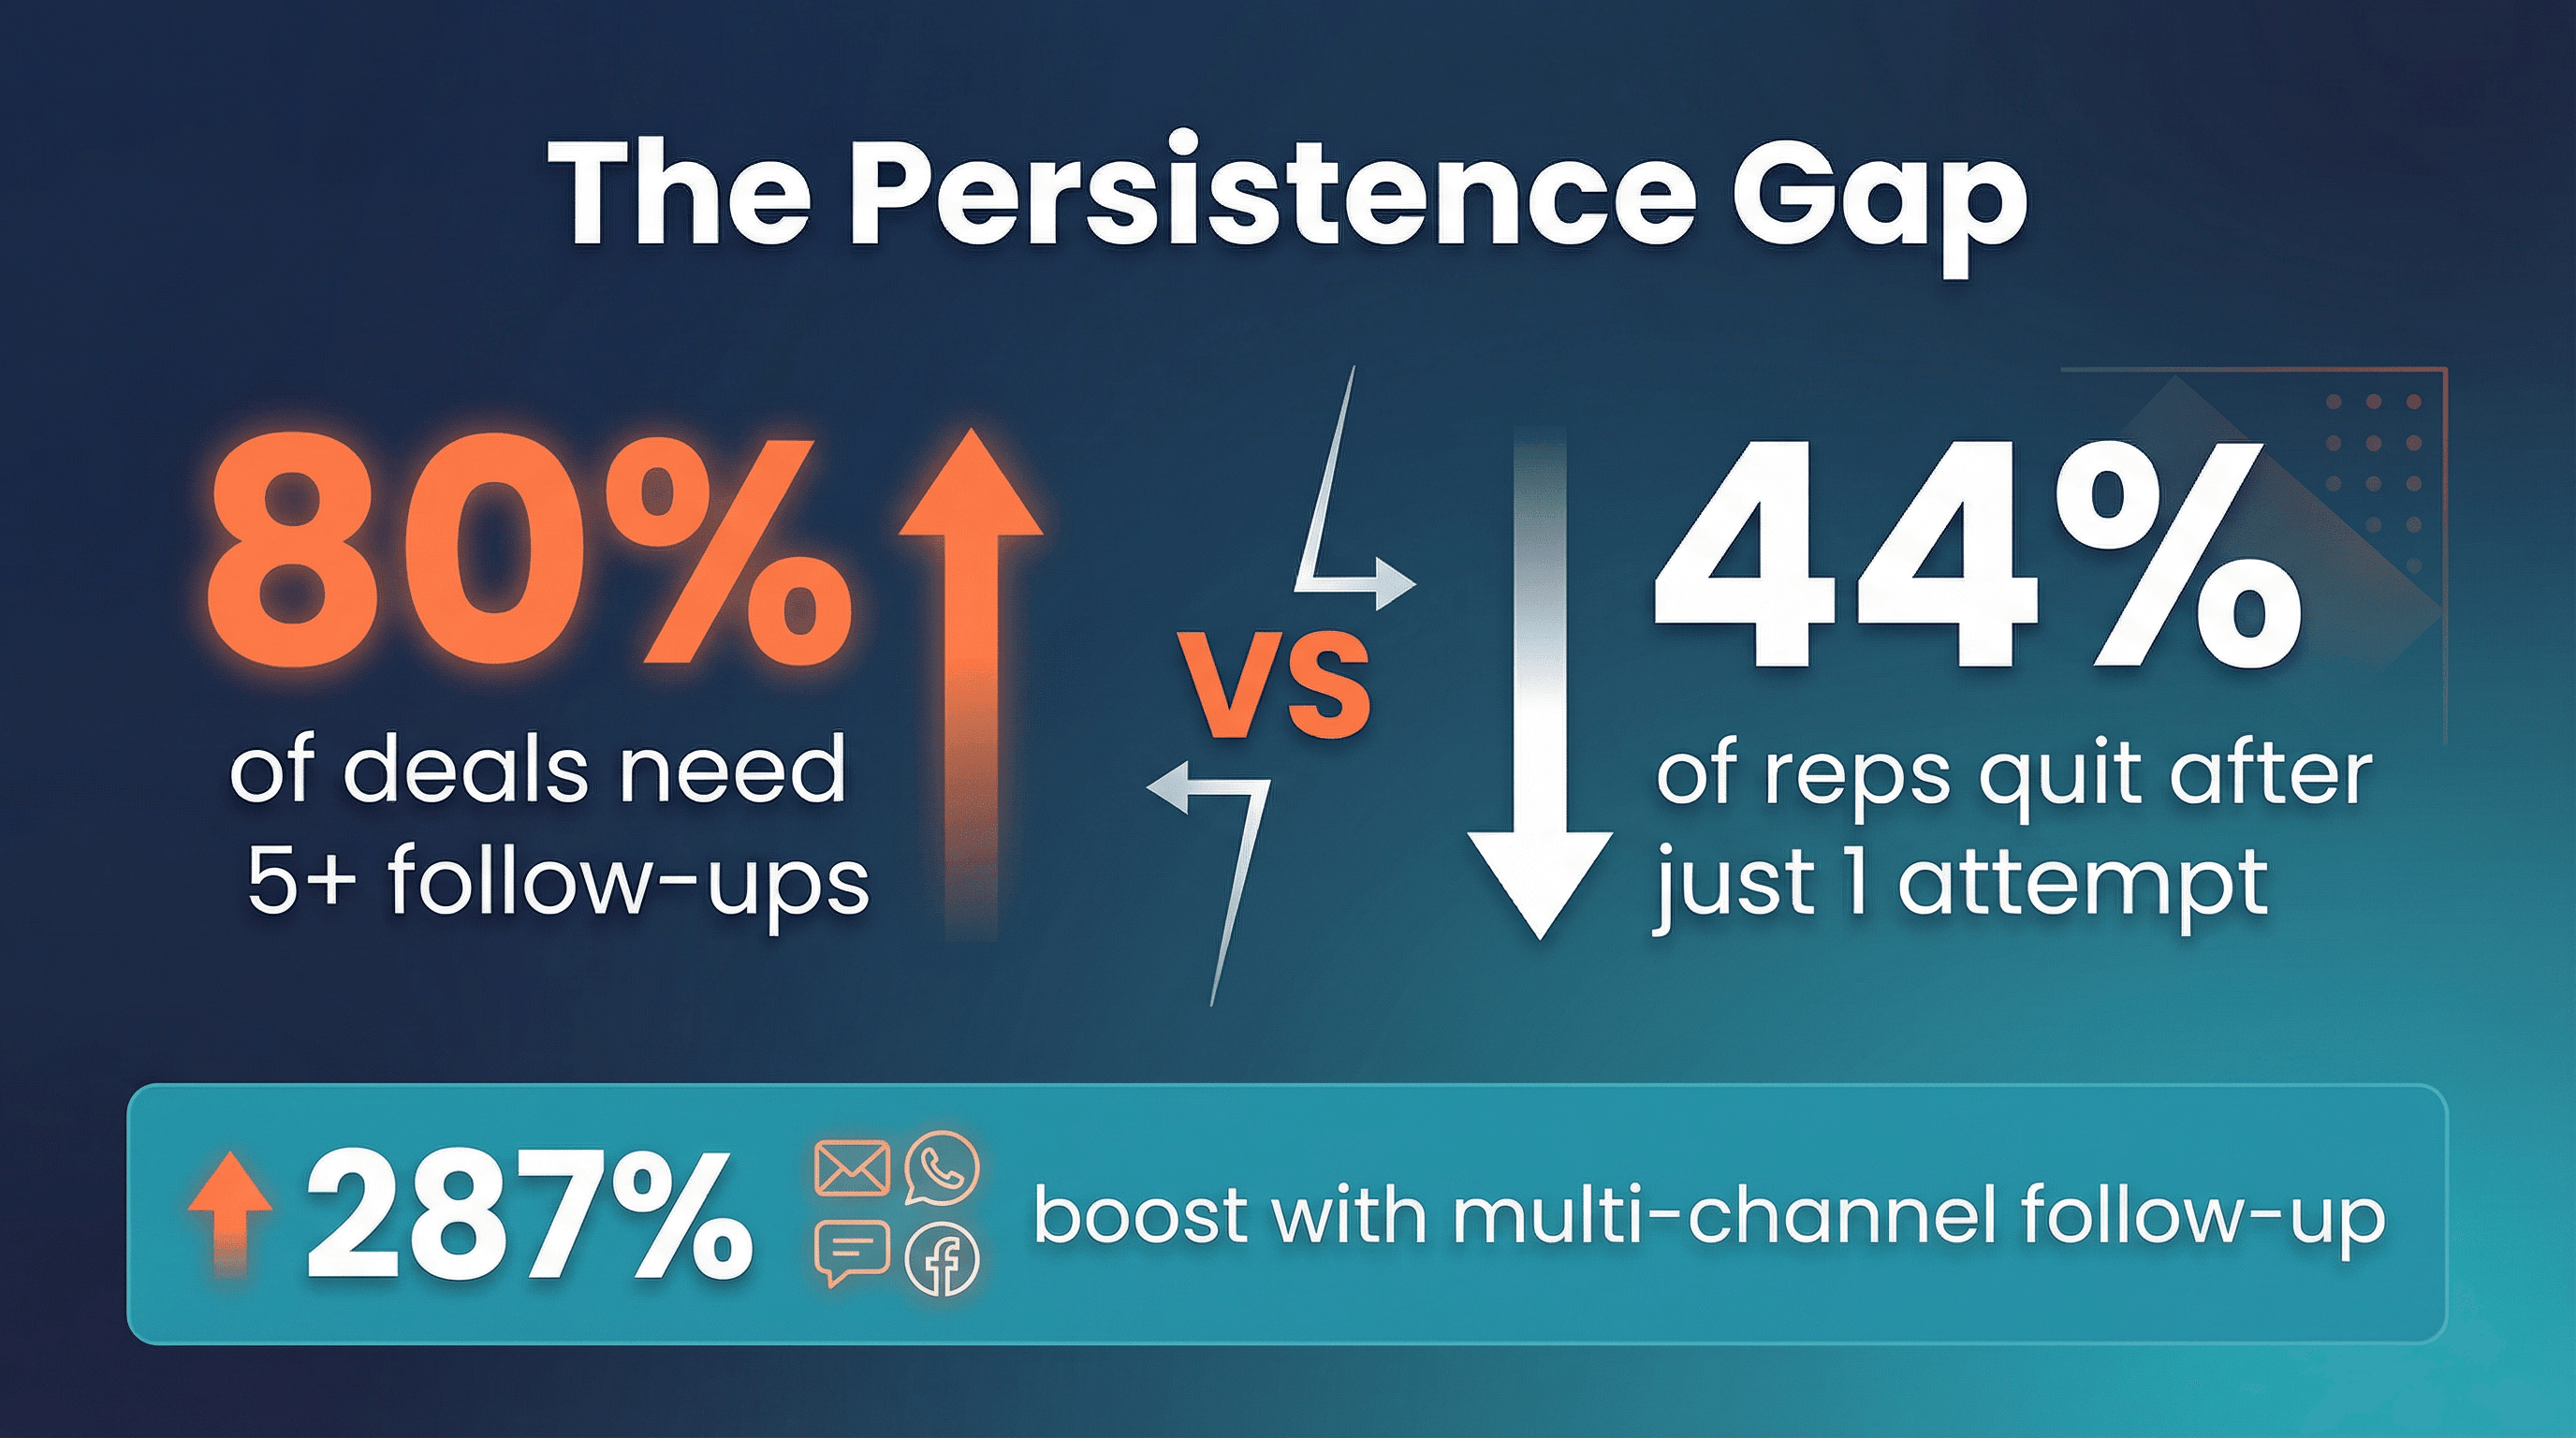 Here’s where the numbers get wild. 80% of sales require at least five follow-ups to close (), but 44% of reps quit after just one attempt (), and 92% give up after four (). That means the persistent minority are winning the majority of deals.
- Only 2% of deals are sealed on the first contact ().
- By the 5th to 12th contact, 80% of deals will have closed or fallen off ().
- 95% of converted leads were reached on the 6th call attempt, but only 10% of reps persist that long ().
Multi-channel follow-up is key: Combining email, phone, and LinkedIn can boost engagement by 287% compared to email alone (). And referencing a previous meeting in your follow-up email can increase response rates by 62% ().
Bottom line: Persistence isn’t just a virtue—it’s a competitive advantage. Make follow-up a process, not a personality trait.
Decision-Maker Dynamics: Navigating More Complex Sales
Gone are the days of the single decision-maker. The average B2B sale now involves five or more stakeholders (), and for enterprise deals, that number can hit 10–17 ().
- Multi-threaded deals (engaging multiple buyer contacts) are 2× more likely to close ().
- Only 27% of buying groups can easily reach consensus—meaning 73% struggle with internal misalignment ().
Strategies:
- Map the buying committee early.
- Multi-thread your outreach (don’t rely on a single champion).
- Tailor your value prop to each stakeholder’s priorities.
If you’re not sure who all the players are, ask! “Who else should be involved in this decision?” is one of my favorite questions.
Digital Transformation: How Technology and AI Influence Closing Rates
 Tech isn’t just a nice-to-have—it’s a must-have for closing deals in 2026.
- 81% of sales teams are using or investing in AI-powered tools ().
- Sales reps leveraging AI are 3.7× more likely to hit quota ().
- 87% of companies use a CRM to track sales ().
- Sales teams use an average of 10 different tools to close deals ().
AI tools can help with everything from lead scoring to drafting personalized emails to forecasting. For example, at , our AI web scraper helps sales teams quickly gather and structure lead data from any website, saving hours of manual research (and a few headaches). If you’re curious, you can check out Thunderbit or grab our for your own workflow.
The key is to balance adoption with training—tools should make your life easier, not more complicated.
Inside vs. Outside Sales: Closing Performance Compared
The pandemic blurred the lines between inside and outside sales, but there are still some notable differences:
- Outside sales reps average a 40% closing rate (), while inside sales reps typically close in the 30% range.
- 65% of outside sales reps meet or exceed quota, about 10% higher than inside reps ().
- Inside sales calls cost ~$50 each; outside sales calls cost $215–$400 ().
- 38% of sellers have closed $500k+ deals remotely—no in-person meeting required ().
- 70–80% of B2B buyers now prefer remote or digital-first interactions ().
Hybrid models are on the rise. The best teams use inside sales for volume and efficiency, and deploy outside reps for high-value, complex deals.
The Role of Lead Quality and Qualification in Closing Success
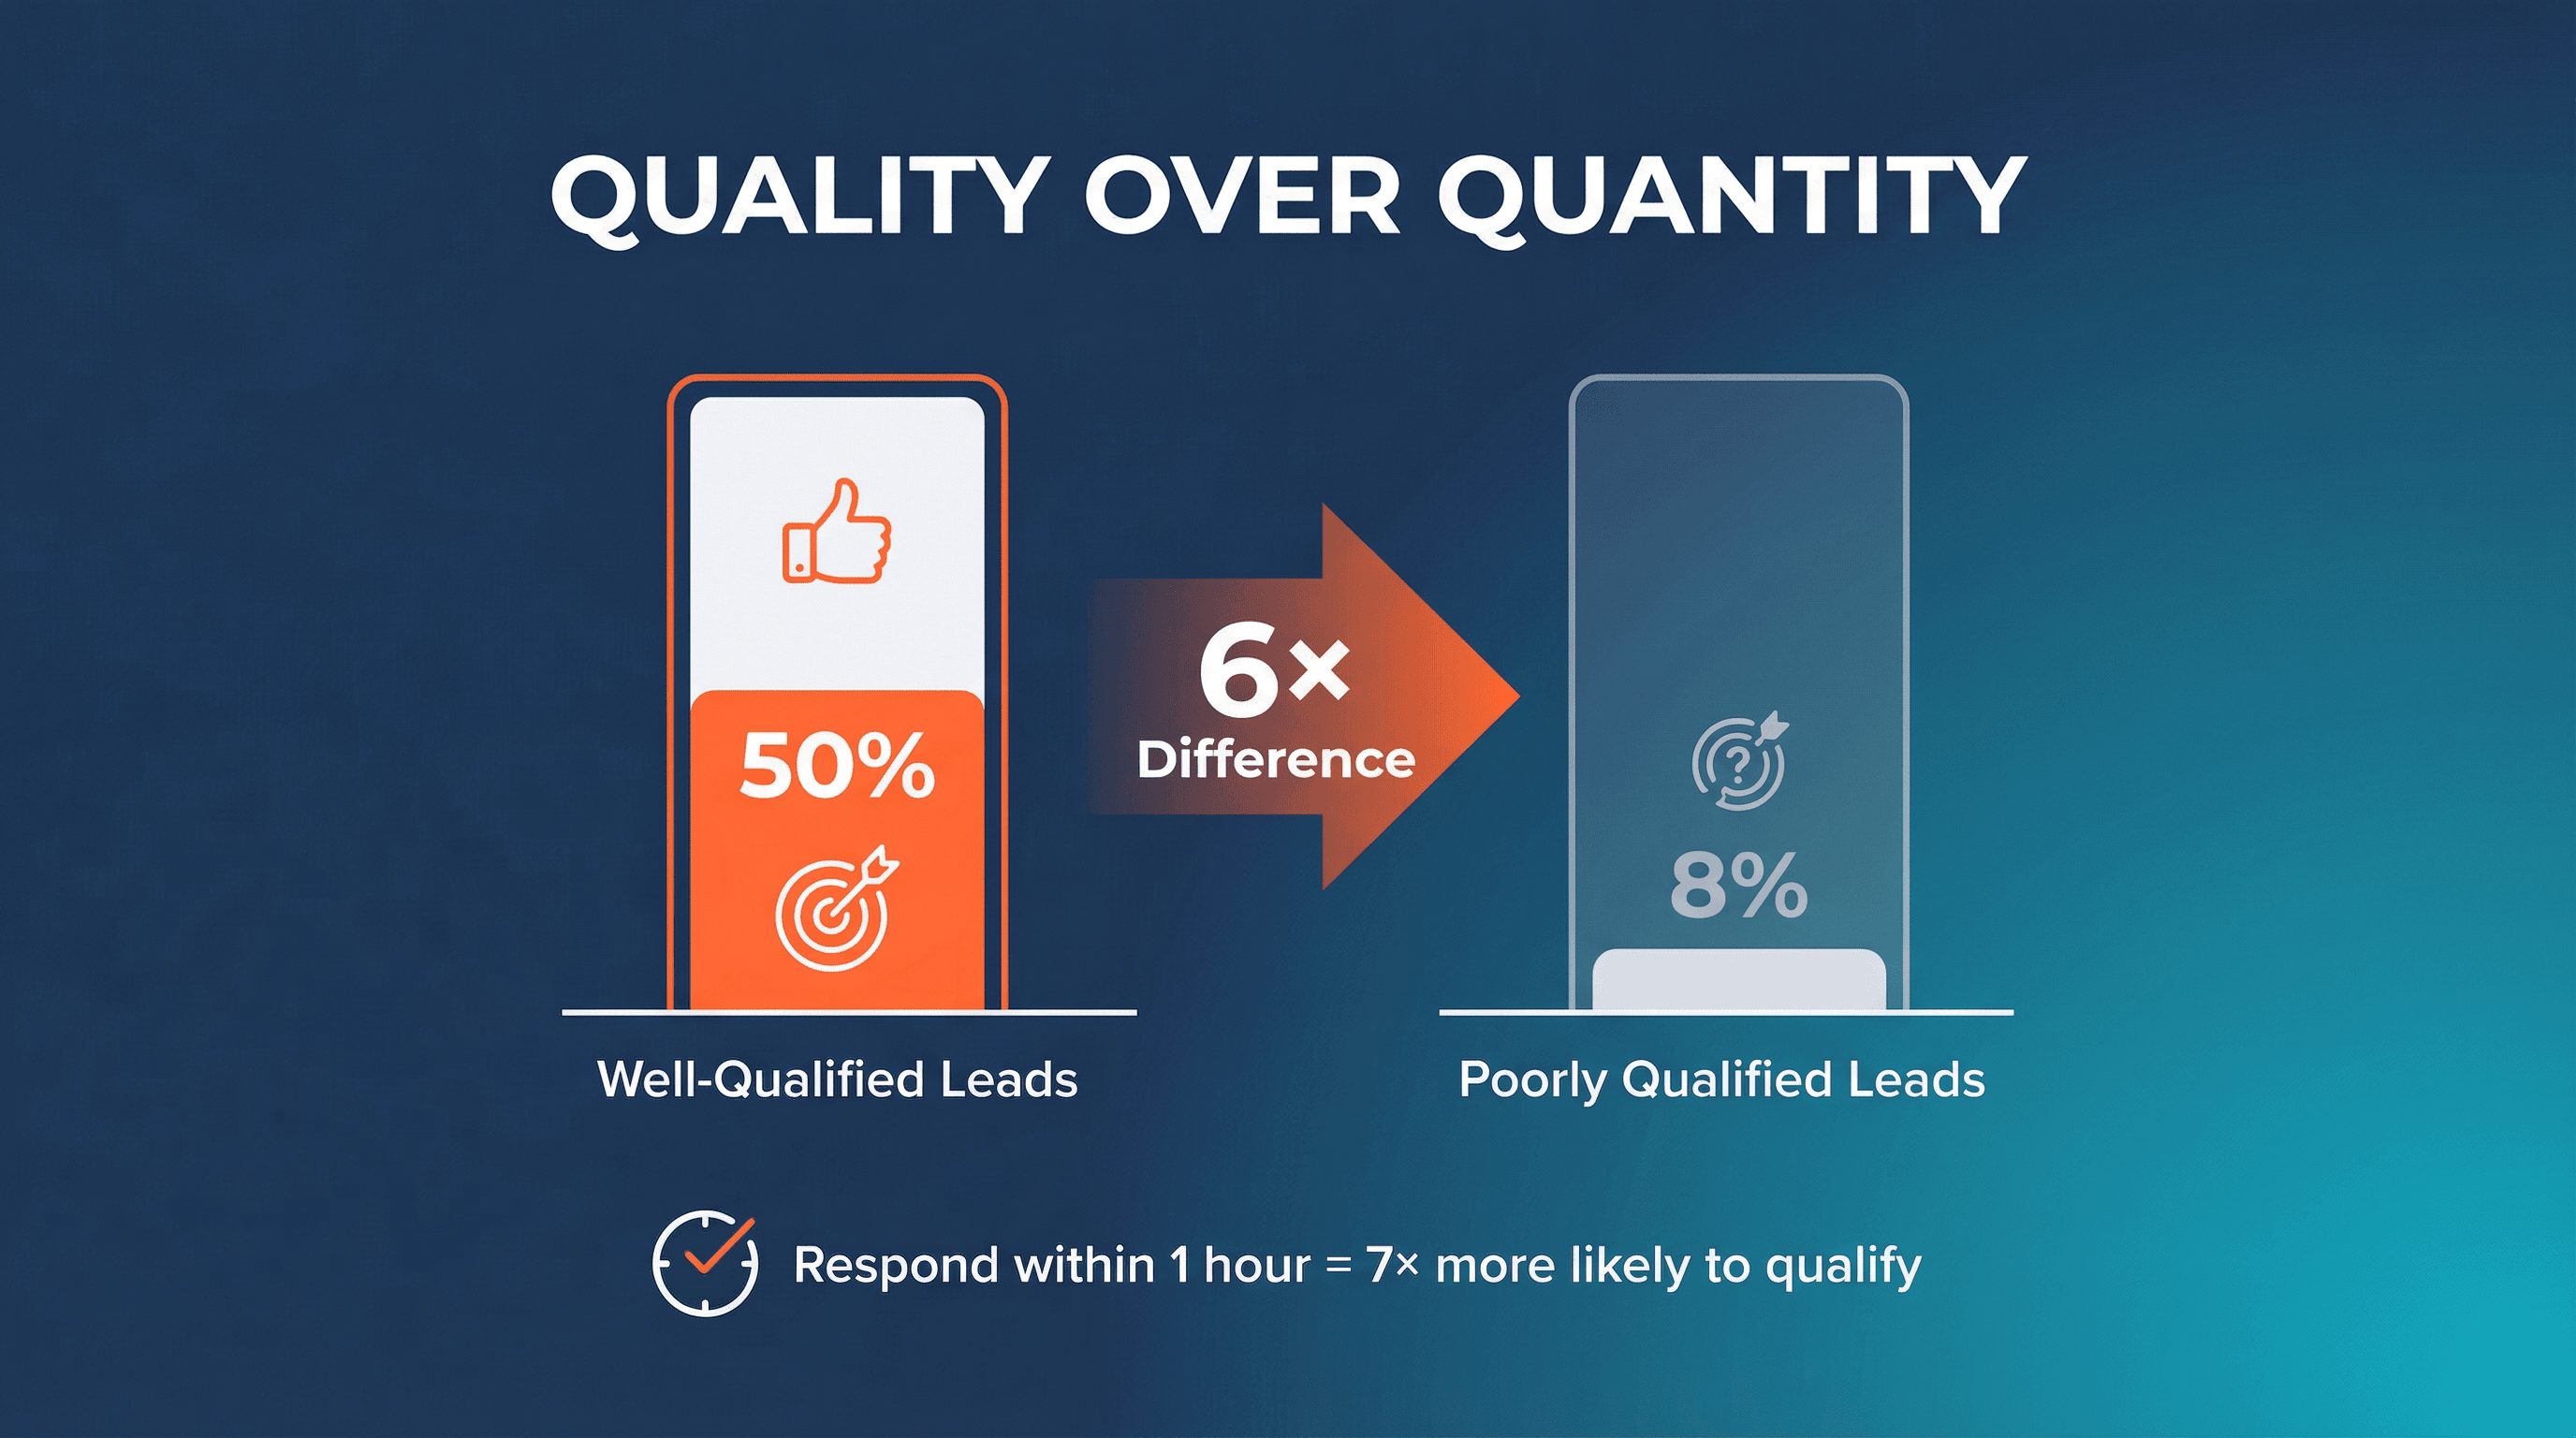 Here’s a stat that should be taped to every sales rep’s monitor: Well-qualified opportunities close at 50%, while poorly qualified ones close at just 8% (). That’s a 6× difference.
- Responding to a lead within an hour makes you 7× more likely to qualify them ().
- Companies with strong sales and marketing alignment see 38% higher win rates ().
- 63% of prospects who request info today won’t buy for at least 3 months ().
My take: Spend more time qualifying and nurturing, and less time chasing “maybe” leads. Use frameworks like BANT or MEDDPICC, and don’t be afraid to disqualify early.
Referral and Social Selling: Boosting Close Rates Through Trust
 Trust is the ultimate sales accelerant—and nothing builds trust like a referral.
- Referrals are 4× more likely to convert than non-referral leads ().
- 71% of B2B orgs report higher conversion rates from referral leads ().
- 69% of companies with referral programs say those deals close faster ().
- 91% of B2B buying decisions are influenced by word-of-mouth and peer recommendations ().
- LinkedIn drives 80% of B2B social media leads ().
If you don’t have a formal referral program, you’re leaving money on the table. And if you’re not active on LinkedIn, you’re basically invisible to a huge chunk of your market.
Why do deals stall or die? The stats point to a few usual suspects:
- 40–60% of qualified deals end in “no decision” ().
- 87% of sales conversations show signs of buyer indecision ().
- 28% of sales pros say a long process is the #1 reason deals fall through ().
- 81% of reps say inflexible payment terms have blocked deals ().
Solutions:
- Make the decision easy (offer pilots, opt-out clauses).
- Streamline your process (audit for bottlenecks).
- Be flexible with pricing and payment terms.
- Use urgency and social proof to keep deals moving.
- Track and analyze your win/loss data to spot patterns.
Remember, every lost deal is a learning opportunity—if you’re willing to dig into the data.
Key Takeaways: What the 2026 Sales Closing Data Means for You
Let’s boil down the big lessons:
- You need a robust pipeline. With close rates around 20%, aim for 3–4× pipeline coverage ().
- Sales cycles are longer—plan accordingly. Keep deals warm and moving with regular, value-driven touches ().
- Persistence is everything. Don’t be in the 44% who quit after one follow-up ().
- Engage the whole buying committee. Multi-threaded deals close at much higher rates ().
- Leverage tech and data. AI and CRM tools are proven quota multipliers ().
- Focus on quality leads. Qualification is the ultimate close-rate booster ().
- Cultivate referrals and social proof. Trust closes deals faster than any pitch ().
- Tackle closing challenges head-on. Use data to anticipate and address objections.
Selling in 2026 is tough, but it’s also full of opportunity for those who let the data lead. Every percentage point improvement in your close rate or cycle time adds up to big wins over the year.
Citing and Sharing Sales Closing Statistics: How to Use This Data
Want to make these stats work for you? Here’s how I recommend using them:
- Sales meetings & trainings: Share key stats (with sources) to drive home best practices—like “80% of deals require 5+ follow-ups” ().
- Sales pitches: Use industry benchmarks to build credibility or urgency with prospects.
- Marketing content: Pepper your blog posts, webinars, or LinkedIn articles with fresh stats (and always cite your sources).
- Visual aids: Turn top stats into infographics or charts for easy sharing.
- Sales playbooks: Bake these numbers into onboarding and playbooks so new reps know what “good” looks like.
- Public speaking: Quoting a recent stat adds instant authority to your talks.
- Encourage sharing: Compile a “Top 10 Sales Stats” list for your team to share on social (with links back to the full article).
- Back up internal requests: Use data to justify investments in new tools or process changes.
And always, always cite your sources. It’s good karma—and it makes you look like the data-driven pro you are.
Sources and Further Reading
This article draws from some of the best research and reporting in the sales world. For deeper dives, check out:
- )
And if you want more sales insights, check out the for the latest on sales automation, AI, and productivity.
Want to make your sales research even faster? Thunderbit’s AI web scraper can help you pull contact info, company data, and more from any website in just a few clicks. Try our and see how much time you can save on your next prospecting sprint.
Shuai Guan
Co-founder & CEO,
P.S. If you found these stats useful, share this post with your team or link to it in your next sales deck. Let’s make 2026 the year of data-driven closing!