
Picture this: It’s 7:58 a.m., you’re sipping your coffee, and your phone buzzes. Another “viral” moment is unfolding on Twitter—wait, sorry, X. Is it a political firestorm, a celebrity meme, or just another day in the world’s digital town square? Whatever you call it, this platform has a knack for making headlines, shaping culture, and, let’s be honest, occasionally making us question our life choices (and our screen time).
But how big is X in 2025, really? Is it still the go-to for breaking news, or has the rebrand sent users running for the hills? Whether you’re a marketer, a researcher, or just someone who loves a good stat, I’ve pulled together the most up-to-date, eyebrow-raising, and sometimes head-scratching numbers about Twitter/X. Let’s dig into the data and see what’s really happening behind the blue—err, black—curtain.
Twitter (X) Statistics at a Glance: The Top 10 Numbers
Short on time? Here are the 10 most impactful Twitter/X stats for 2025—bookmark these for your next strategy meeting or trivia night:
| Statistic | 2025 Value |
|---|---|
| Monthly Active Users | ~561 million worldwide |
| Daily Active Users | 132 million (mobile, est.) |
| User Demographics | 64% male, 70% under 35 |
| Top Markets | US: ~104M, Japan: ~71M |
| Tweet Volume | 500 million/day |
| Engagement Rate | 0.03% median per tweet |
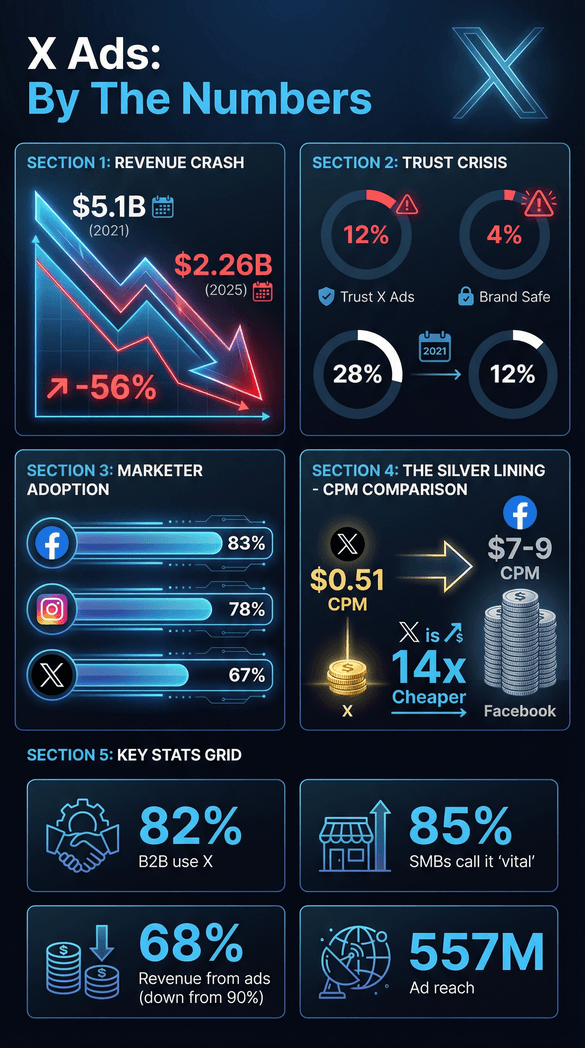
| Advertising Reach | ~557 million users |
| Ad Revenue | $2.26B projected |
| Brand Perception | 12% of marketers trust X ads |
| Rebrand Sentiment | 55% still call it “Twitter” |
Twitter (X) User Statistics: Who’s on the Platform?
Global User Base and Growth
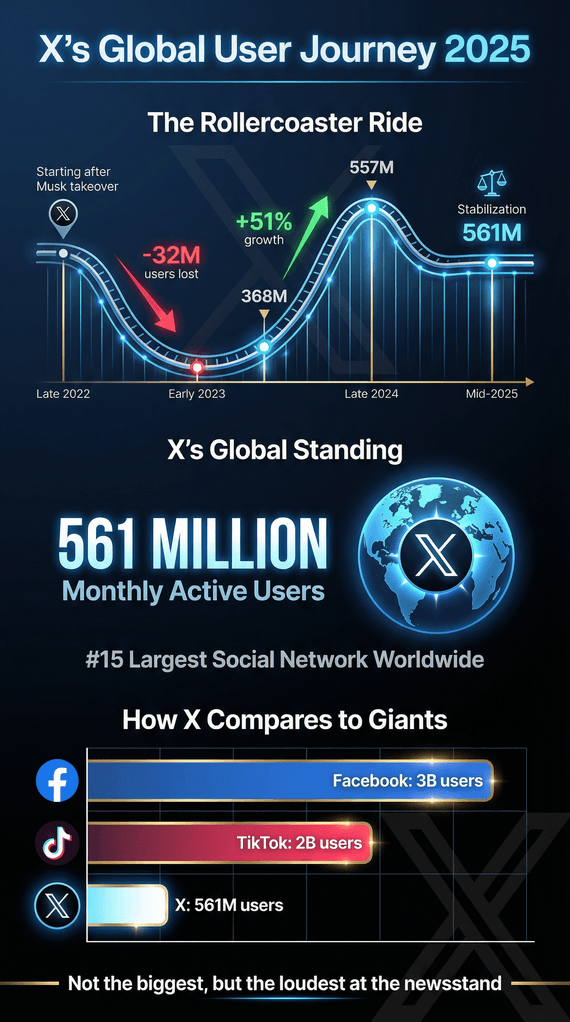
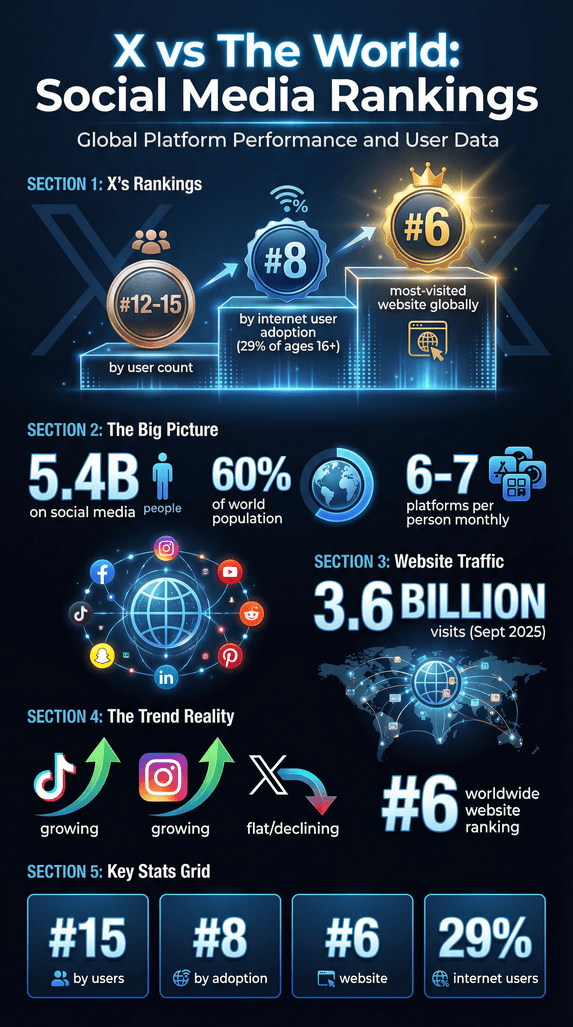
Let’s start with the big picture: X’s global user count is a moving target, but the consensus for 2025 is . That puts X around the in the world—behind giants like Facebook, YouTube, and TikTok, but still a major player.
Growth has been, well, a bit of a rollercoaster. After Elon Musk’s takeover in late 2022, X actually in the first few months. But then, thanks to reactivated and new accounts, the platform in late 2024—a wild 51% increase. As of mid-2025, though, the number has dipped slightly from its 2024 peak, showing that the platform’s user base is anything but static.
For comparison, Facebook is still sitting pretty at , and TikTok is at . So, X may not be the biggest, but it’s still the loudest at the newsstand.
X’s user base is highly concentrated. The , making up about 19–20% of the global total. , and together, these two countries account for roughly a third of all X users.
Other notable countries:
- Indonesia: ~25 million
- India: ~24 million (which is just 2% of its internet users—talk about untapped potential)
- UK: ~23 million
- Brazil: ~17 million
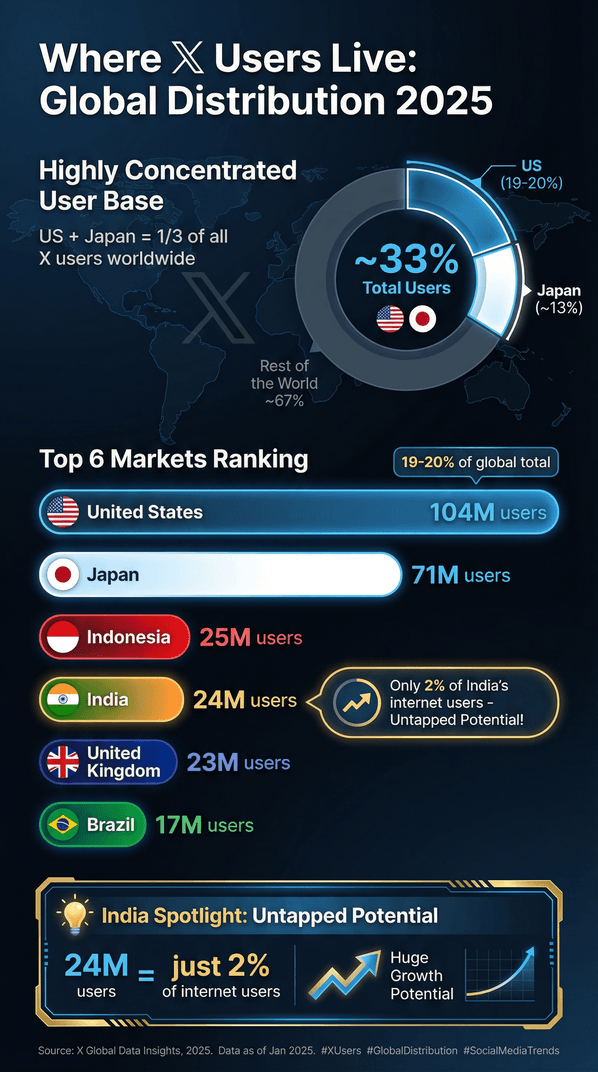
In some places, X is more culturally influential than the numbers suggest. For example, in Japan, X is a primary social network, sometimes even more so than Facebook. Meanwhile, in India, X’s penetration is relatively low, and in China, it’s mostly banned (except for the VPN-savvy crowd).
Demographics: Age, Gender, and More
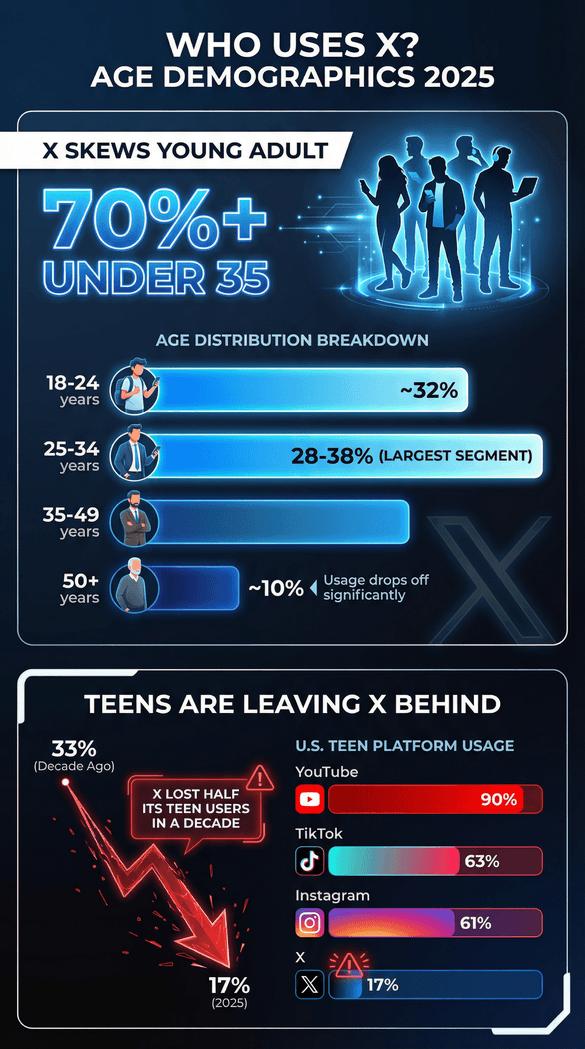
Who’s actually using X? The platform : over 70% of users are under 35. The largest chunk is 25–34-year-olds, making up about 28–38% of the user base, followed by the 18–24 group at ~32%. Usage drops off fast after age 35, and only about 10% of users are 50 or older.
But here’s the twist: . Only 17% of U.S. teens say they use X, down from 33% a decade ago. Meanwhile, platforms like YouTube (90% of teens), TikTok (63%), and Instagram (61%) are dominating the youth market.
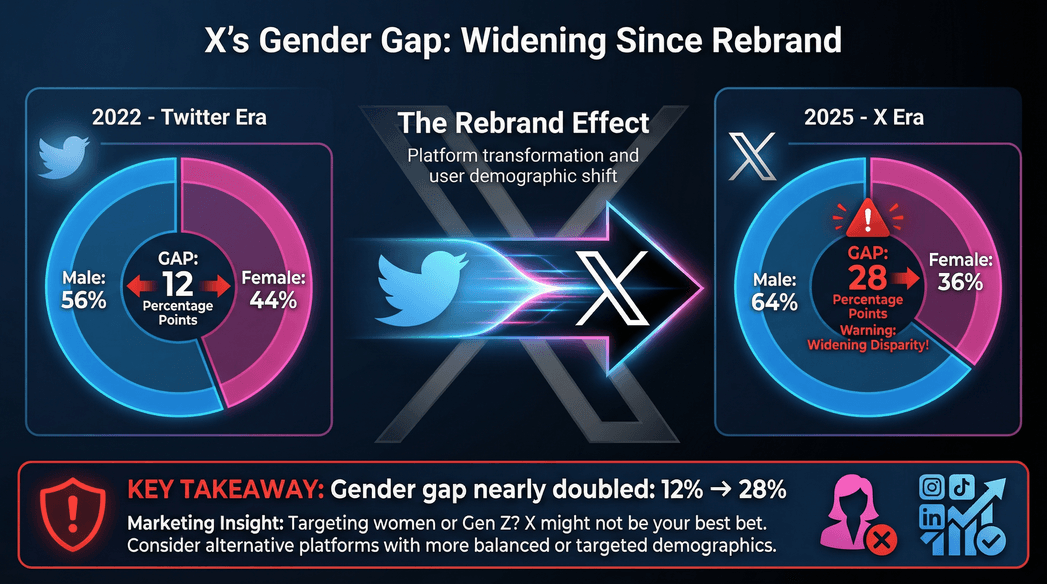
Gender-wise, X is now —a gap that’s widened since the rebrand. In 2022, it was closer to 56% male/44% female. So, if you’re targeting women or Gen Z, X might not be your best bet.
Twitter (X) Usage Statistics: How People Engage
Posting and Engagement Patterns
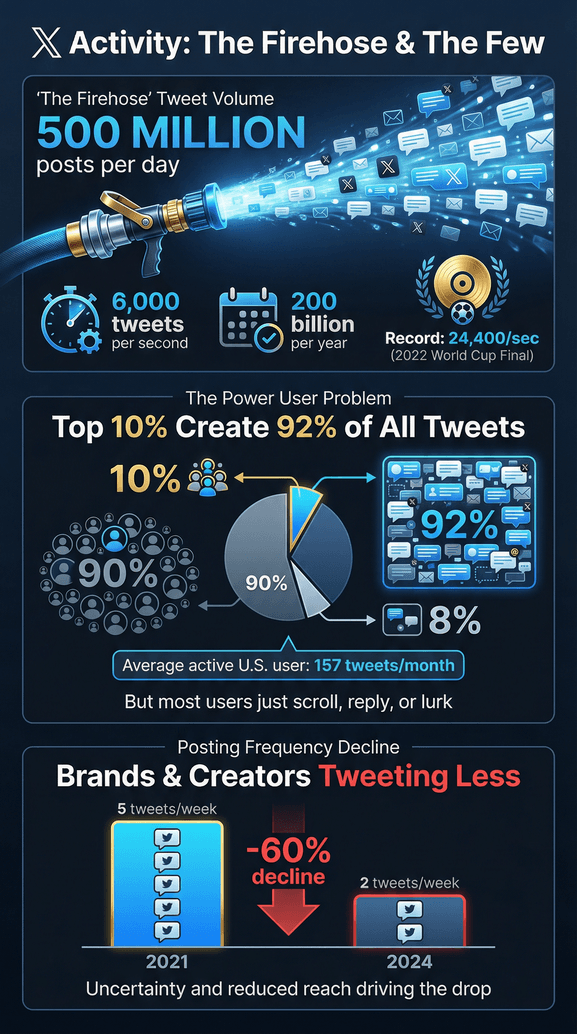
Let’s talk activity. X is still a firehose: —that’s about 6,000 per second, or 200 billion per year. The all-time record? during the 2022 World Cup final.
But here’s the kicker: . The average active user in the U.S. tweets about 157 times per month, but most users rarely tweet at all—they’re just there to scroll, reply, or lurk.
Posting frequency is down, too. The median number of tweets per week for brands and creators dropped from about 5 in 2021 to just 2 in 2024. Even as Instagram and TikTok ramp up, X users are tweeting less often, possibly due to uncertainty or reduced reach.
Twitter (X) as a News Source
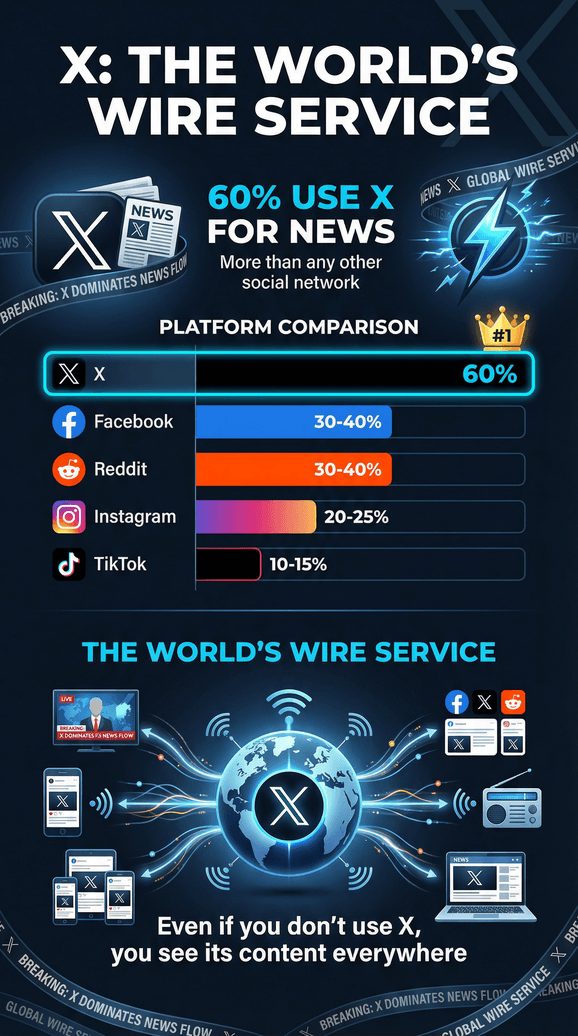
If you want news, X is still the place. —that’s more than any other social network. For context, only 30–40% of Facebook or Reddit users cite news as a primary use, and it’s even lower for Instagram or TikTok.
So, X is still the world’s “wire service”—even if you don’t use it, you probably see its content everywhere else.
Fun Facts: Emojis, Trends, and Viral Content
Let’s lighten it up for a second. Emoji use on X has : from just 3.2% of tweets in 2013 to 26.7% in 2023. Hashtags? Users post an estimated .
The most-liked tweet ever? Chadwick Boseman’s family announcing his passing, with . And yes, memes, pop culture moments, and sports events still drive massive viral spikes.
Twitter (X) Engagement Benchmarks: What Marketers Need to Know
Engagement Rate Trends
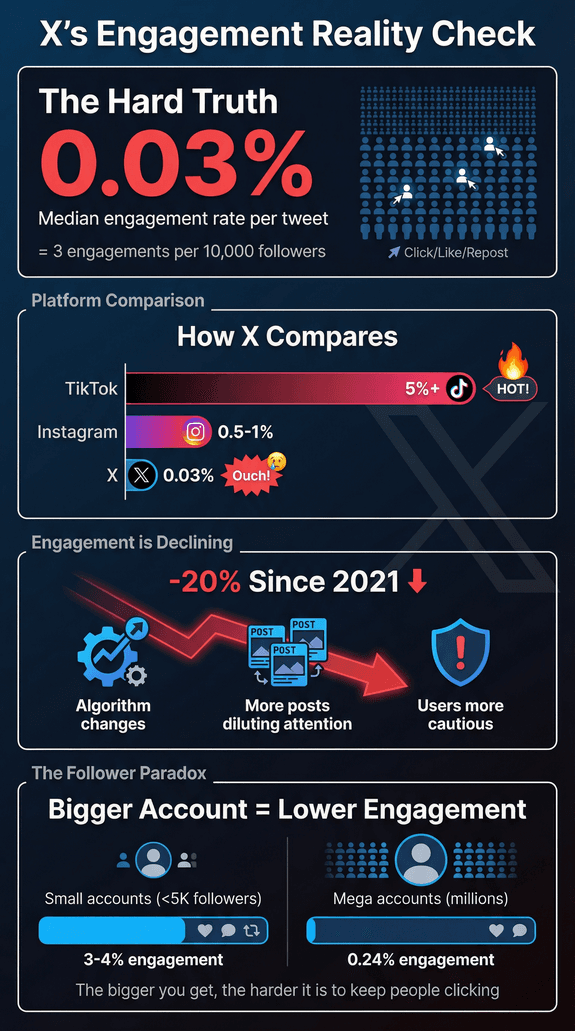
Here’s where things get real for brands: . That’s about 3 engagements per 10,000 followers. For comparison, Instagram sits at 0.5–1%, and TikTok is over 5%. Ouch.
And it’s getting lower: . Factors include algorithm changes, more posts (diluting attention), and users being more cautious about what they interact with.
Top Accounts and Influencers
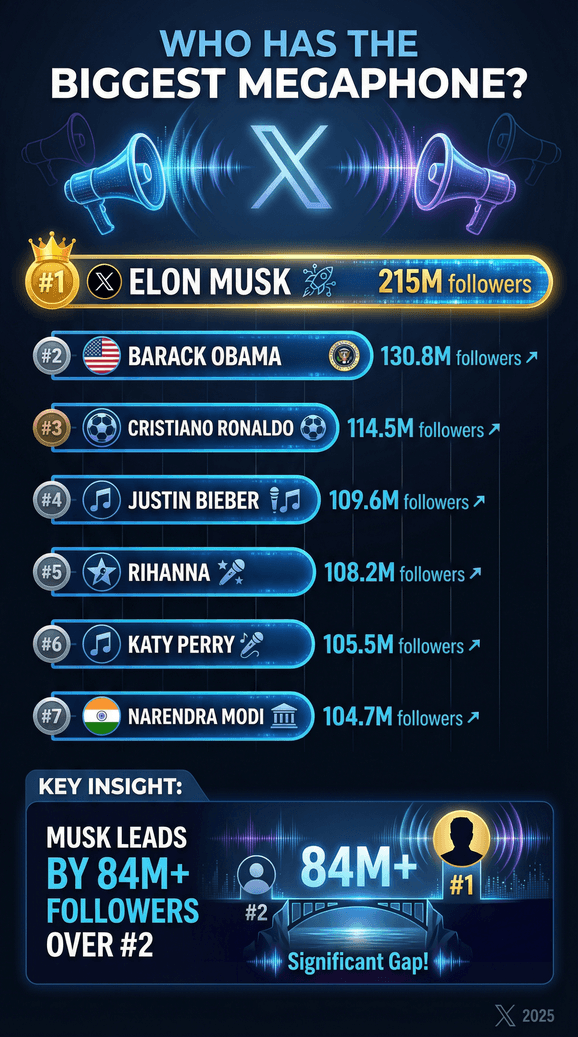
Who’s got the biggest megaphone? . Next up: Barack Obama (~130.8M), Cristiano Ronaldo (~114.5M), Justin Bieber (~109.6M), Rihanna (~108.2M), Katy Perry (~105.5M), and Narendra Modi (~104.7M).
But here’s the twist: Many of these top accounts have seen stagnation or even slow growth since the rebrand. Some celebrities barely tweet anymore, and influencer marketing on X is now just 10% of all influencer campaigns—brands are shifting to Instagram, YouTube, and TikTok for bigger impact.
Tweets with images or videos do get more engagement, but unless you go viral, the numbers are modest.
Twitter (X) Advertising and Marketing Statistics
Advertising Revenue and Trends
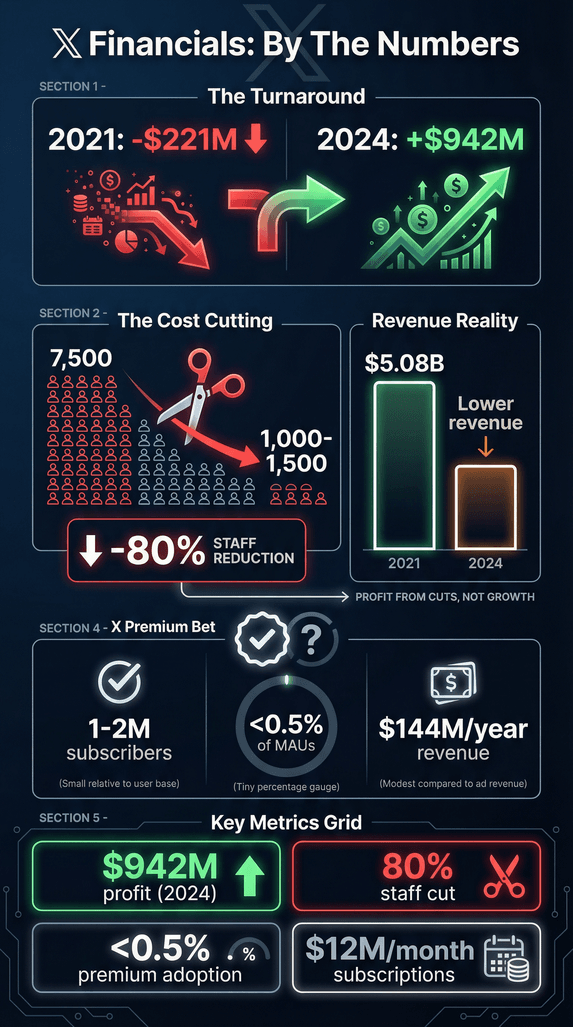
Let’s talk money. X’s ad revenue , then dropped to $4.14B in 2022. After Musk’s takeover, it , with a slight rebound to $2.26B projected for 2025. That’s less than half of what it was just a few years ago.
Advertising now makes up about , down from 90% historically, as the company tries to diversify with subscriptions and data licensing.
Marketer Adoption and Platform Importance
Despite the drama, , and 67% of marketers worldwide include it in their mix. But it ranks below Facebook (83%) and Instagram (78%).
For those who do use X, .
Trust and ROI for Advertisers
Here’s where things get dicey: , and just 4% consider it brand-safe. That’s a massive drop from 28% trust in 2021.
But there’s a silver lining for bargain hunters: —that’s way lower than Facebook’s $7–9. If you’re willing to brave the wild west, X offers cheap reach.
Twitter (X) Financial and Business Performance
Revenue and Profitability
In 2021, Twitter’s total revenue was , with a net loss of $221 million. Fast forward to Musk’s era: thanks to drastic cost-cutting (think: layoffs, no more free lunches), X reportedly turned a —nearly double 2023’s profit, but on much lower revenue.
Employee count? Down from 7,500 to around . That’s leaner than a startup’s fridge at the end of the month.
Subscription and Premium Services
Musk’s big bet on subscriptions? So far, —less than 0.5% of monthly active users. That’s about $12 million/month, or $144 million a year. Not nothing, but not the golden goose, either.
Other paid features (verification for organizations, ad-free subscriptions, ticketed Spaces) are still in early days or have seen limited traction.
Twitter (X) and Social Media Statistics: How X Compares
Social Media Platform Rankings
By user count, X is . It trails Facebook, YouTube, Instagram, WhatsApp, WeChat, TikTok, Telegram, Snapchat, Pinterest, and even China’s Weibo. But among internet-savvy users, X fares a bit better: , making it the 8th most-used platform by that metric.
Social Media Usage Trends
Social media adoption keeps rising—. The average person uses 6–7 different platforms monthly. But X’s share of attention is shrinking: TikTok and Instagram are growing, while X’s activity is flat or declining.
Still, , with 3.6 billion visits in September 2025.
Twitter (X) Content Moderation and Safety Statistics
User Reports and Enforcement Actions
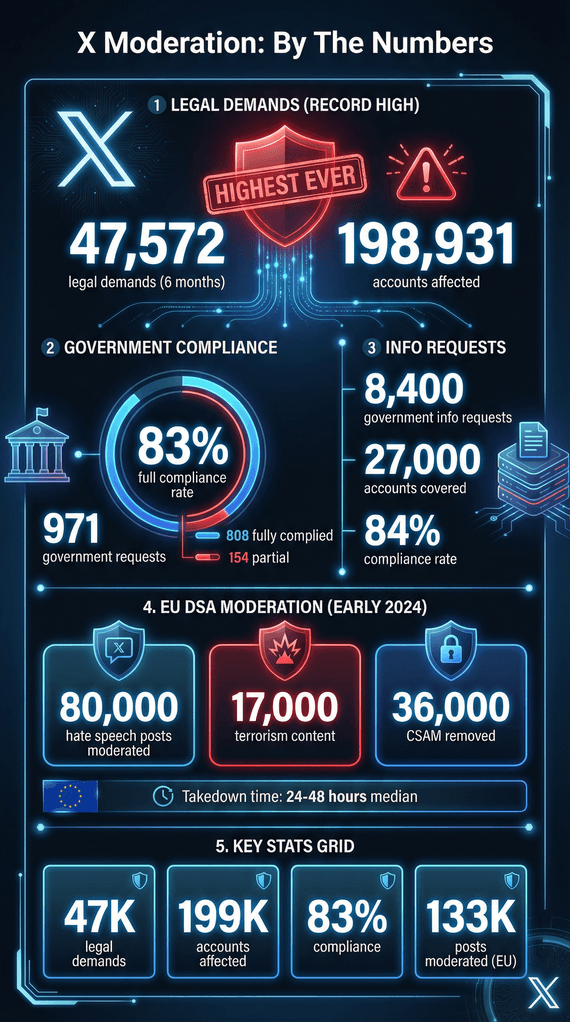
Content moderation has been a hot topic under Musk. In a recent 6-month span, X received —the highest ever.
From October 2022 to early 2023, X got , fully complying with 808 and partially with 154 (an 83% full compliance rate).
Data Requests and Legal Compliance
In the second half of 2022, Twitter received , complying at least partially 84% of the time.
Under the EU’s Digital Services Act, X reported in early 2024, with median takedown times of 24–48 hours.
Public Opinion and Brand Perception of Twitter (X)
Reactions to the X Rebrand
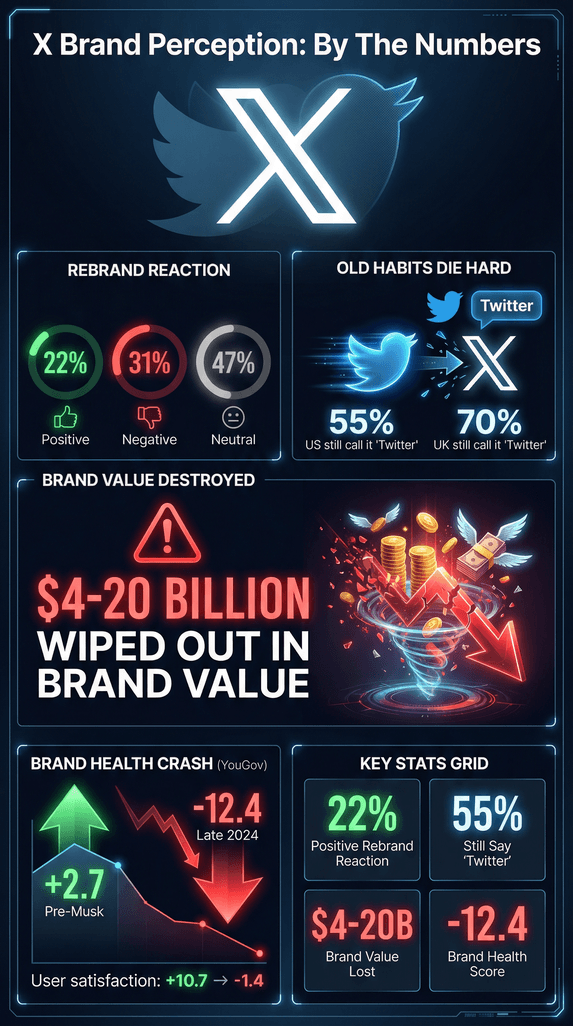
How do people feel about “X”? In a 2023 U.S. survey, only , while 31% reacted negatively. And the old habits die hard: .
Branding experts estimate the rebrand .
User Retention and Satisfaction
Despite the drama, the core user base is sticking around. A 2023 Statista survey found , but usage data shows X largely retained its core users through 2024.
Brand health scores have dropped, though: Twitter went from mildly positive (+2.7) pre-Musk to deeply negative (−12.4) by late 2024, and satisfaction among current users dropped from +10.7 to −1.4 ().
Key Takeaways: What the Twitter (X) Statistics Mean for You
- X is still a major player, but not a growth story. With , X’s user base is volatile and plateauing, especially among teens and women.
- Engagement is low and concentrated. , and the median engagement rate is just .
- Still the go-to for news and real-time PR. , and X is critical for crisis management, announcements, and trendjacking.
- Advertising is a bargain—but risky. , but .
- Customer service and community building are still strong. X remains invaluable for direct customer support and niche communities.
- Musk’s “X” transformation is a wild card. The platform is evolving fast—stay agile, and keep an eye on new features (payments, long-form content, video).
- Public sentiment is more negative, but usage is sticky. Many users grumble about the rebrand, but most haven’t left—yet.
Sources and Further Reading
Want to go deeper? Here are the best resources for exploring Twitter/X and social media statistics:
For more insights on social media, automation, and data scraping, check out the .
Curious about scraping Twitter/X data for your next research project or lead generation campaign? Thunderbit’s makes it simple to extract profiles, tweets, and more—no code required. Want to see it in action? Head over to or explore our guide to .