
Picture this: you’re shopping for a new pair of headphones, scrolling through endless product listings on Amazon, Walmart, or Shopee. What makes you stop, click, and buy? Is it the price, the glowing reviews, the crisp images, or just the fact that the product actually shows up on the first page? In the world of e-commerce, this virtual shelf—what we call the “digital shelf”—is where brands win or lose, often before you even realize it.
I’ve spent years helping brands and teams navigate the wild world of online retail, and let me tell you: the digital shelf is not just a fancy way to say “product listing.” It’s a living, breathing scoreboard. And if you’re not tracking your digital shelf performance, you’re basically playing in the major leagues without knowing the score. Let’s dig into what digital shelf performance really means, why it’s become the new must-have metric for modern brands, and how you can actually measure (and improve) it—without needing a PhD in spreadsheets.
Digital Shelf Performance: The New Scorecard for Online Brands
Let’s start with the basics. Digital shelf performance is the holistic, dynamic measure of how your products perform across online channels. It’s not just about being listed—it’s about being found, being chosen, and being bought. Think of it as your product’s “report card” for the digital world, covering everything from whether you’re in stock to how your product content stacks up against competitors.
To put this in perspective, global e-commerce sales are projected to hit $6.3 trillion in 2024, with 16.1% of all retail sales now happening online (Mars United). That’s not just a trend—it’s a tidal wave. And with 2.71 billion people shopping online this year (Keywords Everywhere), the competition for digital shelf space is more intense than ever.
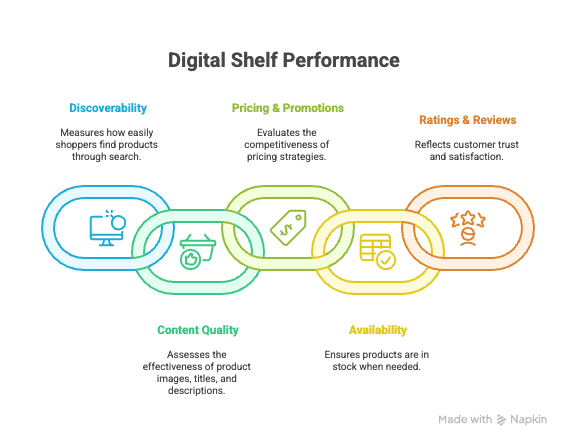
So, what does digital shelf performance actually measure? It’s not a static checklist. Instead, it’s a dynamic scoreboard that tracks:
- Discoverability: Are you showing up when shoppers search?
- Content Quality: Are your images, titles, and descriptions compelling and compliant?
- Pricing & Promotions: Are you competitive in real time?
- Availability: Are you in stock when it matters?
- Ratings & Reviews: Do customers trust you?
In other words, it’s not just about being on the shelf—it’s about winning on the shelf.
From Product Listings to Digital Shelf Analytics: What’s Changed?
Back in the day, managing your digital shelf was a bit like tending a garden with a pair of tweezers. You’d upload your product info, maybe check your listings every now and then, and hope for the best. But as e-commerce exploded, that approach started to look a little… quaint.
Traditional methods—manual checks, spreadsheets, and channel feedback—just can’t keep up anymore. The digital shelf is constantly shifting. Search algorithms update, new competitors pop up, prices change by the hour, and customer preferences evolve overnight. If you’re still relying on manual spot checks, you’re always a step behind.
Enter digital shelf analytics: a structured, ongoing process that uses automation and real-time data to track, measure, and improve your product’s online performance. It’s like upgrading from a paper map to GPS navigation. With digital shelf analytics, you’re not just reacting to problems after the fact—you’re spotting them as they happen, and sometimes even before.
The Five Core Metrics of Digital Shelf Performance
Let’s break down the five essential metrics that make up digital shelf performance. These aren’t just nice-to-have stats—they’re the backbone of your online strategy.
| Metric | What It Measures | Why It Matters |
|---|---|---|
| Availability | In-stock status and assortment coverage across sites | If you’re out of stock, you can’t be found or bought. Stockouts cost retailers $1.75 trillion a year. |
| Content Quality | Completeness and quality of product info (titles, images, descriptions, specs) | Rich, optimized content drives conversion. Enhanced content can boost conversion rates by ~15%. |
| Share of Search/Category | Visibility in search results and category listings (organic rank, share of top positions) | Top 3 search results get ~70% of clicks. If you’re not visible, you’re not selling. |
| Pricing & Promotions | Competitiveness of your price, presence of deals or discounts, buy box wins | Price is the make-or-break factor online. Amazon changes prices millions of times per day. You need to keep up. |
| Ratings & Reviews | Customer feedback scores, review count, and sentiment trends | 85–99% of shoppers read reviews before buying. Good ratings build trust and boost search ranking. |
Let’s dig into each one.
Availability: Are Your Products Always Ready to Buy?
Availability is the foundation of digital shelf performance. If your product is out of stock, it’s invisible—no search results, no sales, no new reviews. Globally, stockouts cost retailers a jaw-dropping $1.75 trillion each year. And here’s the kicker: 91% of consumers say they’re less likely to shop with a retailer again after a stockout (ToolsGroup).
High-frequency monitoring is essential. If you’re only checking stock once a week, you’re missing the window. Digital shelf analytics tools can alert you the moment a product goes out of stock, so you can act before it hurts your ranking and your revenue.
Content Quality: Does Your Product Information Convert?
On the digital shelf, your content is your pitch. High-quality images, detailed descriptions, and complete specs are what turn browsers into buyers. 90% of consumers say that quality images are the most important factor in an online purchase (Plytix), and adding enhanced content (like videos or comparison charts) can increase conversion rates by 15% or more.
Content quality isn’t just about looking good—it’s about building trust and making sure your product gets found. Retailer algorithms often reward listings with complete, compliant content. If your product info is outdated or inconsistent, you’re leaving money on the table.
Share of Search & Category: Are You Winning Visibility?
Visibility is everything. If your product isn’t showing up in the top search results or category listings, you’re basically invisible. The top 3 search results get about 70% of clicks (Plytix), and 70% of Amazon users never go past the first page.
Digital shelf analytics tracks your rankings for key keywords and categories, benchmarking you against competitors. If your share of search drops, it’s a red flag to optimize your content, adjust your pricing, or ramp up your marketing.
Pricing & Promotions: Staying Competitive in Real Time
Online pricing is a moving target. On Amazon alone, prices can change millions of times per day. If your price is even 5% higher than a competitor’s, you risk losing the sale—and maybe the coveted Buy Box.
Manual price checks just can’t keep up. Automated analytics let you track your price position, monitor competitor promos, and respond in real time. The goal? Stay competitive without racing to the bottom.
Ratings & Reviews: The Voice of the Customer
Ratings and reviews are the digital word-of-mouth. 85–99% of shoppers read reviews before buying (The Commerce Shop), and a high rating with lots of reviews can make or break your conversion rate.
But it’s not just about the stars. Sentiment analysis can surface trends—maybe customers love your new feature, or maybe there’s a recurring complaint you need to fix. Digital shelf analytics helps you spot these signals early, so you can act before a minor issue becomes a major headache.
Why Manual Digital Shelf Management Fails Modern Teams
Let’s be honest: managing your digital shelf with spreadsheets and manual checks is like trying to win a Formula 1 race on a tricycle. The digital shelf never sleeps—prices, rankings, and content can change by the hour. If you’re only checking in once a week, you’re always playing catch-up.
Here’s why manual management just doesn’t cut it anymore:
- Speed: The digital shelf is dynamic. By the time you notice a problem, it may have already cost you sales and ranking.
- Scale: Most brands have hundreds or thousands of SKUs across multiple platforms. Manual checks can only cover a tiny fraction.
- Complexity: Each retailer has its own rules, algorithms, and quirks. Tracking all of this by hand is a recipe for missed opportunities and late-night headaches.
- Human Error: Copy-pasting data is slow and error-prone. By the time you finish your report, the data is already outdated.
Modern teams need automation and structured analytics to keep up. Otherwise, you’re always reacting after the fact—when it’s already too late.
Digital Shelf Analytics in Action: Use Cases Across Teams
Digital shelf performance isn’t just an e-commerce ops thing. It’s a team sport, and everyone benefits:
- Marketing: Ensures brand consistency and content compliance across platforms. If your product description is outdated on Walmart but fresh on Amazon, marketing can spot and fix it.
- Sales: Uses analytics for channel strategy. If a retailer is consistently out of stock or mispricing your product, sales can bring hard data to the negotiation table.
- Product Development: Analyzes reviews and Q&A for product feedback. If everyone’s complaining about the same issue, that’s a signal for R&D.
- Customer Service: Monitors reviews for emerging issues and responds quickly to negative feedback.
- Supply Chain: Tracks inventory analytics to prevent stockouts and optimize restocks.
The real magic happens when these teams collaborate around a shared source of truth. Weekly “digital shelf war rooms” (yes, that’s a thing) bring everyone together to review the latest data, set priorities, and take action.
Thunderbit: Building Your Own Digital Shelf Analytics System
Scrape data from any website using AI Get Started Free
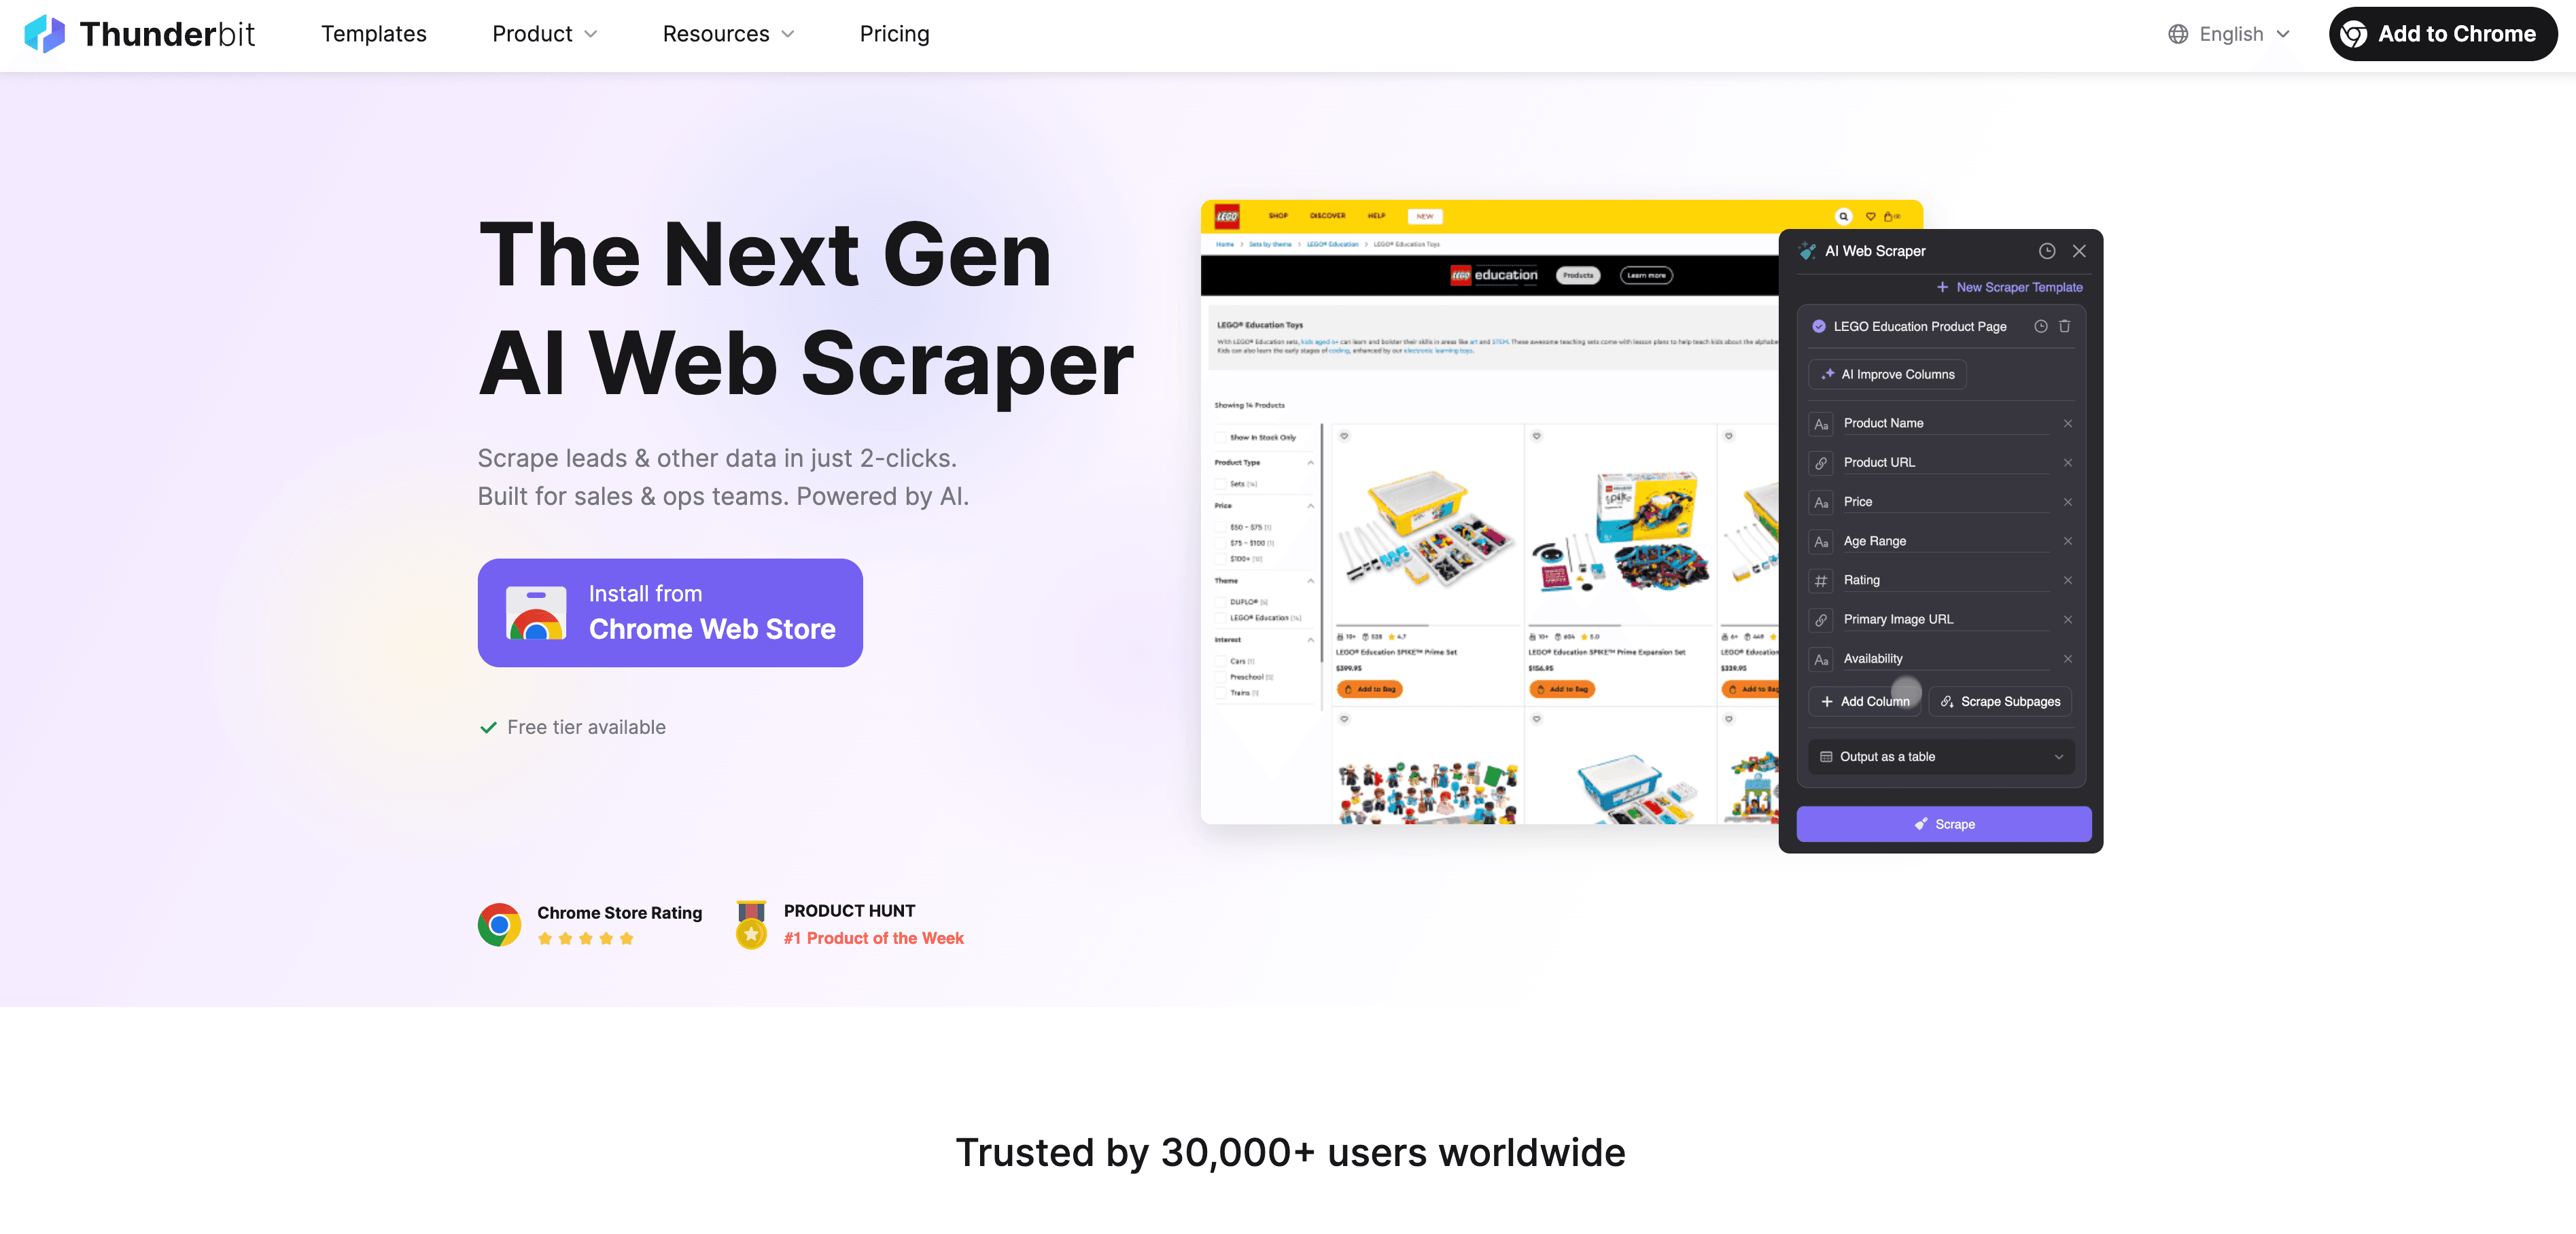
Now, here’s where things get really interesting. At Thunderbit, we set out to make digital shelf analytics accessible to everyone—not just big brands with deep pockets and IT armies. Our AI-powered web scraper Chrome extension lets non-technical users build their own digital shelf analytics system, fast.
Here’s how it works:
- AI-Suggested Fields: Just click “AI Suggest Fields” and Thunderbit reads the page, recommending which data to extract (title, price, rating, reviews, stock, and more).
- Instant Data Tables: Build SKU data tables in seconds, export to Excel, Google Sheets, Airtable, or Notion—no coding required.
- Subpage Scraping: Go beyond the surface. Thunderbit can visit each product’s detail page to pull deeper info (like variant details, long-form reviews, or compliance checks).
- Field AI Prompts: Customize extraction logic for each field. Want to flag if a product title is missing your brand name? Just add a prompt.
- Scheduled Scraper: Set up automated scrapes (daily, weekly, you name it) so your data is always fresh.
- Cloud or Browser Scraping: Choose the method that fits your needs—Thunderbit can scrape up to 50 pages at a time in the cloud for speed, or use your browser for sites that require login.
But what really sets Thunderbit apart is our extraction method.
Try Thunderbit for Digital Shelf Analytics
Thunderbit’s AI-Powered Extraction: How It Works
Most scrapers try to wrestle with messy HTML, hoping the site doesn’t change its layout overnight. Thunderbit takes a different approach: we first structure the page into Markdown format before feeding it to the AI for extraction.
Why does this matter? Markdown is clean, human-readable, and easy for AI to understand. By stripping away the noise and focusing on the content’s semantic structure, Thunderbit’s AI can:
- Understand context: It knows that “Price: $19.99” is, well, the price—even if the HTML changes.
- Adapt to changes: If a retailer updates their layout, Thunderbit’s AI can still find the right data by context, not by brittle selectors.
- Handle complexity: Dynamic content, long review sections, or even unstructured pages (like Facebook Marketplace) are no match for this method.
This approach is especially resilient for complex or frequently changing sites, and it works wonders for extracting structured data from places where traditional scrapers fail. It’s like giving the AI a clean script of the page, instead of a messy stage full of props.
Subpage Scraping: Going Beyond the Surface
Let’s be real: a lot of the juiciest data lives one click deeper. Product variants, detailed specs, customer Q&A, or even hidden promos often only show up on the product detail page.
With Thunderbit’s Subpage Scraping, you can:
- Scrape a category page for a list of products.
- Automatically visit each product’s detail page to extract extra fields (like full descriptions, variant options, or deep-dive reviews).
- Enrich your data table with all this info, no manual clicking required.
This is a game-changer for digital shelf analytics. You get the full picture—surface-level and deep-dive data—in one workflow. It’s perfect for competitive analysis, content audits, or tracking compliance across hundreds of SKUs.
Automating Digital Shelf Performance: From Reports to Triggers
Here’s the secret sauce: the real value of digital shelf analytics isn’t just in pretty dashboards—it’s in automation. The goal is to move from static reports to dynamic triggers that drive action.
Imagine this workflow:
- Scheduled Scraping: Thunderbit collects fresh data every morning.
- Central Dashboard: Data flows into Airtable or Google Sheets, updating your KPIs.
- Anomaly Detection: If a product goes out of stock, price jumps, or your share of search drops, the system flags it.
- Automated Alerts: You get an email, Slack message, or even a task in your project management tool—instantly.
- Closed-Loop Response: The right team takes action (restocks inventory, updates content, matches a competitor’s promo), and the cycle continues.
This isn’t just reporting—it’s a living, breathing feedback loop. You’re not just watching the game; you’re coaching in real time.
Getting Started: Steps to Launch Digital Shelf Analytics
Learn How to Scrape Data with AI Get Started Free
Ready to get your hands dirty? Here’s a simple checklist to launch your own digital shelf analytics program—even if you’re not a tech wizard:
- Define Your KPIs: What matters most—availability, content quality, search rank, price, reviews? Start with your biggest pain points.
- Pick Your Platforms: Focus on your top retailers or channels (Amazon, Walmart, Shopee, etc.) and your most important SKUs.
- Choose Your Tools: Set up Thunderbit for data extraction, and pick where you’ll store and analyze data (Excel, Google Sheets, Airtable).
- Baseline Audit: Do an initial scrape to see where you stand. Identify quick wins (missing images, out-of-stock items, etc.).
- Set Up Monitoring: Schedule regular scrapes—daily for stock and price, weekly for content and reviews.
- Define Alerts: Decide what triggers action (e.g., stock below 95%, rating drops below 4.0, price higher than competitors).
- Act and Iterate: Respond to alerts, document changes, and refine your process over time.
- Expand: Once you’ve nailed the basics, add more products, metrics, or platforms.
Pro tip: Start small and scale up. Even tracking your top 20% of SKUs can deliver huge insights.
Start Digital Shelf Analytics with Thunderbit
Conclusion: Why Digital Shelf Performance Is a Must-Have for Modern Brands
In today’s e-commerce landscape, digital shelf performance isn’t optional—it’s mission-critical. It’s how you make sure your products are seen, trusted, and bought—again and again.
Let’s recap:
- Holistic control: You’re not just listed; you’re winning on every metric that matters.
- Real-time agility: You spot and solve problems as they happen, not after the damage is done.
- Cross-team alignment: Marketing, sales, ops, and product all work from the same playbook.
- Better customer experience: Shoppers find what they need, trust what they see, and come back for more.
- Revenue growth: Every improvement on the digital shelf translates to more sales, higher rankings, and a stronger brand.
At Thunderbit, we believe every brand—big or small—should have the tools to master their digital shelf. That’s why we built Thunderbit to make digital shelf analytics easy, powerful, and accessible to everyone. If you’re ready to move from static reporting to dynamic, actionable management, download the Thunderbit Chrome Extension and start building your own digital shelf analytics system today.
And remember: in the digital world, the shelf is always open, the scoreboard is always running, and the winners are those who keep playing to win.
Curious to learn more? Check out our other deep dives on Thunderbit Blog, including What Is Data Scraping and How to Do It in 2025 and How to Scrape Amazon Products and Reviews in 2025 using AI.
Want to see Thunderbit in action? Head over to our YouTube Channel for tutorials, or try out our free data export features and see how easy digital shelf analytics can be.
Try AI Web Scraper for Digital Shelf Analytics Get Started Free
FAQs
1. What is digital shelf performance and why is it important?
Digital shelf performance refers to how well a product performs across online retail channels, including visibility in search, content quality, pricing, availability, and customer reviews. It's important because it directly affects both online and in-store sales by influencing consumer decisions at every stage of the buying journey.
2. What are the five core metrics of digital shelf performance?
The five core metrics are:
- Availability: Whether products are in stock across online retailers.
- Content Quality: The accuracy and richness of product titles, images, and descriptions.
- Share of Search/Category: Visibility in search results and category listings.
- Pricing & Promotions: Competitiveness of price and effectiveness of discounts.
- Ratings & Reviews: Volume and sentiment of customer feedback.
3. Why is manual digital shelf management insufficient today?
Manual processes can't keep up with the speed, scale, and complexity of modern e-commerce. Online platforms update content, algorithms, and prices constantly. Without automation, brands risk reacting too slowly, missing critical changes, and losing sales or visibility.
4. How does automation enhance digital shelf performance monitoring?
Automation enables continuous data collection, alerting, and even response actions. For instance, a system can send alerts when a product goes out of stock, prices shift, or reviews turn negative—allowing teams to act in real-time instead of relying on periodic reports.
5. How can teams start implementing digital shelf analytics?
Brands should start by defining key objectives and KPIs, selecting core platforms and products to monitor, and using tools like AI-powered scrapers (e.g., Thunderbit) to automate data collection. From there, setting thresholds, automating alerts, and assigning team responsibilities help build a sustainable monitoring workflow.
Learn More: