
If you’ve ever sat through a boardroom meeting where someone flashes a chart showing “$6 trillion in global ecommerce sales” and the room collectively nods like they’ve just glimpsed the future, you know how powerful numbers can be. I’ve been in those meetings myself—sometimes on the presenting side, sometimes on the skeptical side (and, let’s be honest, sometimes just thinking about lunch). The allure of ecommerce statistics is real: they shape budgets, drive hiring sprees, and inspire entire product pivots. But as someone who’s spent years in SaaS, automation, and AI—where data is both a compass and a mirage—I’ve learned that the most quoted numbers often hide more than they reveal.
So, let’s pull back the curtain. In this deep dive, I’ll walk you through the most headline-grabbing ecommerce statistics, but more importantly, we’ll explore the context, caveats, and cautionary tales that every marketer, founder, and analyst should know. Because in ecommerce, as in life, it’s not just about what the numbers say—it’s about what they don’t say.
Headline Ecommerce Statistics: The Numbers Everyone Quotes
Let’s start with the big, shiny stats that get everyone’s attention. These are the numbers you’ll see in industry reports, investor decks, and probably on LinkedIn posts with way too many rocket emojis.
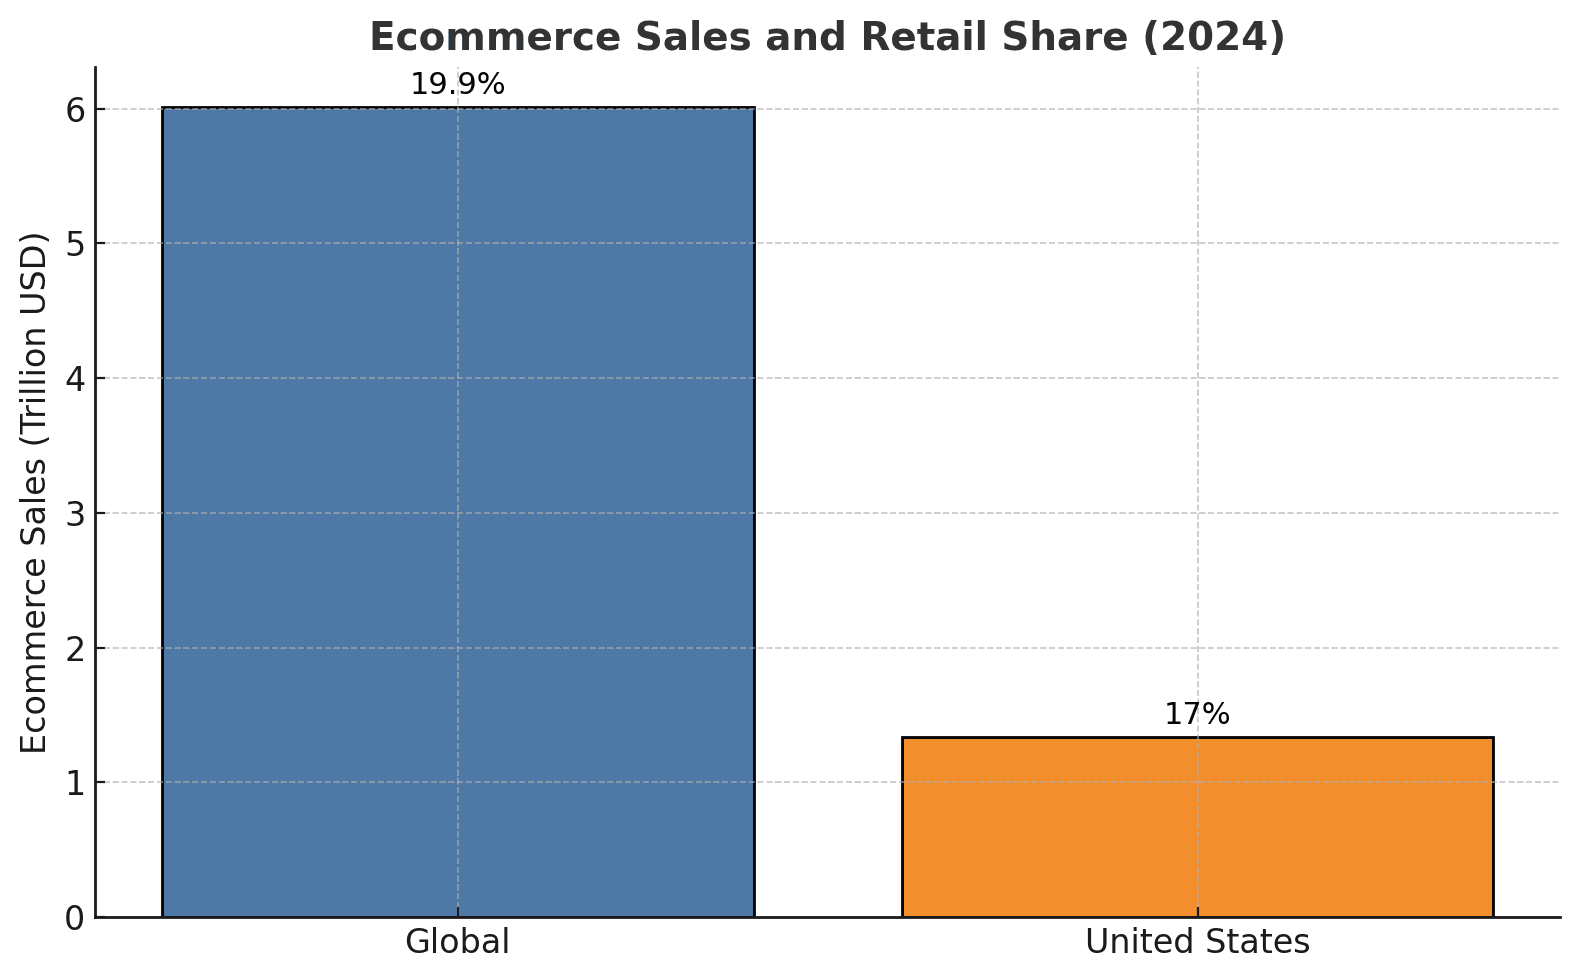
- Global ecommerce sales hit $6.01 trillion in 2024, accounting for about 19.9% of all retail worldwide ().
- In the U.S. alone, online retail sales reached $1.34 trillion, making up roughly 16–18% of all retail ().
- The number of global online shoppers is now estimated at 2.71 billion—that’s about one-third of the world’s population ().
- Mobile commerce is surging: 57% of worldwide ecommerce sales now come from mobile devices, projected to reach 63% by 2028 ().
These numbers are impressive, no doubt. They paint a picture of relentless growth and digital transformation. But before you start planning your next big expansion or mobile app launch, let’s talk about what’s lurking beneath the surface.
The Context Behind Ecommerce Statistics: What’s Missing?
Here’s the thing: context is everything. A 3% conversion rate means something very different for a U.S. grocery site than it does for a luxury jewelry boutique. And a 20% annual growth rate in an emerging market doesn’t carry the same weight as 8% growth in a mature, saturated market.
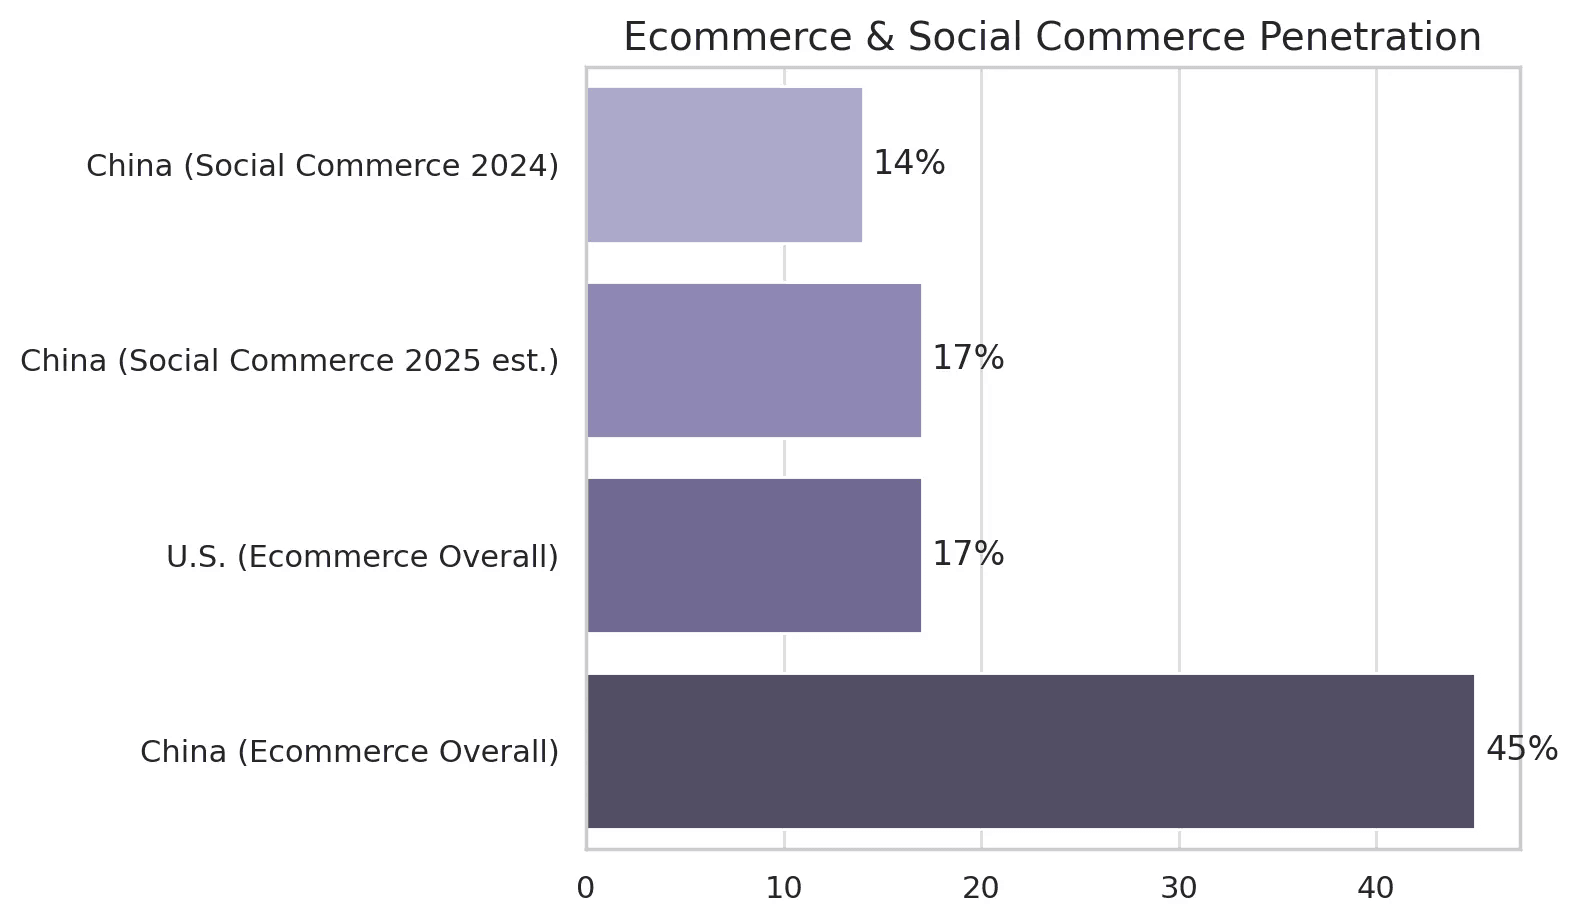
Take ecommerce penetration—the share of retail that happens online. In China, social commerce alone accounts for over 14% of retail sales (expected to hit 17% by 2025), while the U.S. lags behind at about 16–18% overall (). And if you zoom out, China’s overall ecommerce penetration is nearing 45% (), dwarfing most other countries.
Industry verticals matter just as much. Fashion and electronics are ecommerce veterans, while grocery and home improvement are still finding their digital footing. For example, Sephora’s “Digital First” approach—virtual try-ons, AI shade matching—drove a 75% increase in ecommerce sales (), but that’s because beauty shoppers are already highly engaged online.
So, when you see a stat like “20% of retail is online globally,” remember: that average hides massive differences by country, industry, and even consumer behavior.
Ecommerce Growth Rates: The Devil in the Details
Growth rates are the bread and butter of every market analysis. But let’s be honest—they can be sneaky. A 24% growth rate in the Philippines sounds explosive, but the absolute dollar increase is still dwarfed by a 10% jump in the U.S., which has a much larger ecommerce base ().
Let’s break it down:

- Emerging markets like India and Brazil are posting double-digit CAGRs (compound annual growth rates)—India’s forecast is 14.1% CAGR from 2023–2027 ().
- Mature markets like the U.S. and Western Europe are seeing single-digit growth, but the actual sales volume added each year is much higher.
And then there’s the classic pandemic whiplash: Shopify famously bet that the 2020 surge in online shopping was a “new normal,” expanded rapidly, and then had to lay off 10% of its staff when growth snapped back to pre-pandemic trends (). The lesson? Don’t confuse a short-term spike for a permanent shift.
Conversion Rates and Cart Abandonment: Beyond the Averages
Conversion rate is the stat everyone loves to quote. But what does a “good” conversion rate actually mean? Globally, ecommerce conversion rates average around 2–3% (), but the range by industry is huge:
| Industry Vertical | Avg. Conversion Rate |
|---|---|
| Food & Beverage | ~5.8% (Dynamic Yield) |
| Fashion & Apparel | ~2% |
| Luxury & Jewelry | ~1.2% (Dynamic Yield) |
| Global Average | ~3.4% (Toptal) |
So, if your boutique jewelry store is converting at 1.5%, you might actually be outperforming your peers, even if you’re below the “global average.”
Cart abandonment is another stat that gets tossed around—70% of online carts are abandoned (). But here’s the kicker: 43% of U.S. shoppers say they abandoned a cart simply because they were “just browsing” (). When you dig deeper, the real, actionable reasons are things like unexpected costs at checkout (39%), slow delivery (21%), or forced account creation (19%) ().
The takeaway? Segment your data. Compare apples to apples. And always ask: “Why are people dropping off?”
Mobile Commerce Statistics: The Real Story Behind the Surge
Mobile commerce is the darling of every trend report. 57% of ecommerce sales globally now come from mobile devices (), and mobile accounts for 60%+ of all web traffic ().
But here’s the plot twist: mobile conversion rates are much lower than desktop. In the U.S., desktop websites convert at about 3.9%, while smartphones convert at just 1.8% (). So, while mobile brings the eyeballs, desktop still brings the wallets.
Why? Small screens, fiddly forms, and sometimes just plain old user frustration. I’ve seen retailers pour money into mobile traffic, only to realize that most shoppers still prefer to complete purchases on a laptop—especially for higher-ticket items.
The lesson? Don’t just chase mobile traffic. Invest in mobile UX, streamline checkout, and make sure your site works as well on a phone as it does on a 27-inch monitor.
Social Commerce and Influencer Stats: Hype vs. Reality
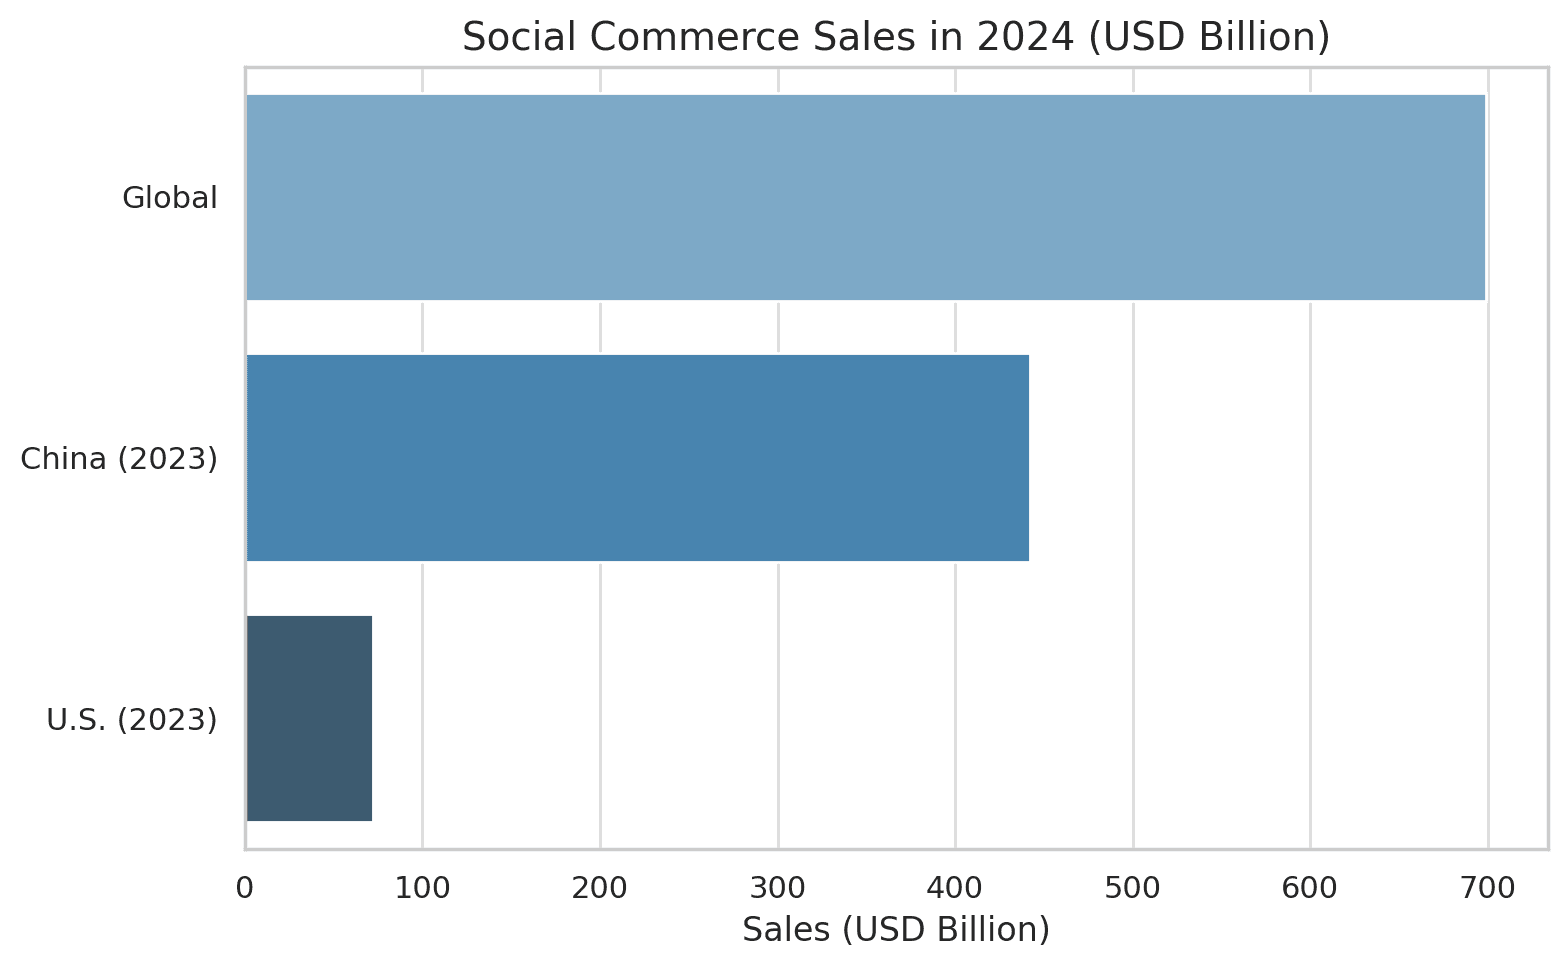
Social commerce is booming—$699 billion in global sales in 2024, up 22.6% from the year before (). But here’s the kicker: China accounts for the vast majority of that, with $442 billion in 2023 (), while the U.S. is at about $72 billion.
Influencer marketing is another area where the stats can get a little, well, inflated. Surveys claim businesses earn $5.78 for every $1 spent on influencers (), and nearly 50% of consumers say they’ve bought something because of an influencer (). But only 44% of marketers actually use sales as a success metric for influencer campaigns ().
Translation: lots of reach, not always lots of revenue. I’ve seen brands invest heavily in influencer campaigns that drove traffic but not sales. The real magic happens when you track the full funnel—from impressions to clicks to conversions, not just likes and shares.
The Hidden Costs and Risks Behind Ecommerce Success Metrics
Topline growth is great, but what about the costs lurking in the shadows? Here are a few stats that don’t get nearly enough airtime:
- Online return rates are nearly 30%, compared to under 9% for brick-and-mortar (). In apparel, it can be 30–40% or higher.
- Ecommerce fraud losses hit $41 billion in 2022, projected to exceed $48 billion in 2023 ().
- For every $100 lost to fraud, businesses actually lose about $207 once you factor in all the associated costs ().
- Customer acquisition costs (CAC) have risen ~60% since 2014 for D2C brands (), and 80% of brands say rising CAC is impacting their business ().
Returns, fraud, logistics, and CAC can quietly eat away at margins. I’ve seen ecommerce businesses celebrate record sales quarters, only to realize that high returns and escalating ad costs left them barely breaking even. As the saying goes: revenue is vanity, profit is sanity.
Automation and AI in Ecommerce: What the Stats Don’t Reveal
Everyone wants to say they’re “using AI.” And the adoption stats are eye-popping: over 80% of businesses say they’ve embraced AI in some form (), and 53% of large retailers use AI for in-store analytics ().
But here’s the catch: only 26% of companies have generated significant value from AI at scale (). The rest are still figuring out how to turn pilots into profits. The biggest hurdles? Not the tech itself, but people and process—change management, data quality, and integrating AI into actual workflows.
As the co-founder of , I see this every day. Our AI Web Scraper is designed to make data extraction as easy as clicking “AI Suggest Fields” and then “Scrape.” But even with the best tools, success depends on having clean data, clear goals, and a willingness to adapt processes. (And sometimes, a little patience when the AI decides to interpret “price” as “prize”—hey, it happens.)
So, when you see stats about AI adoption, ask: Are companies actually seeing ROI, or just checking a box?
Sustainability and Ethics: The Untold Side of Ecommerce Growth
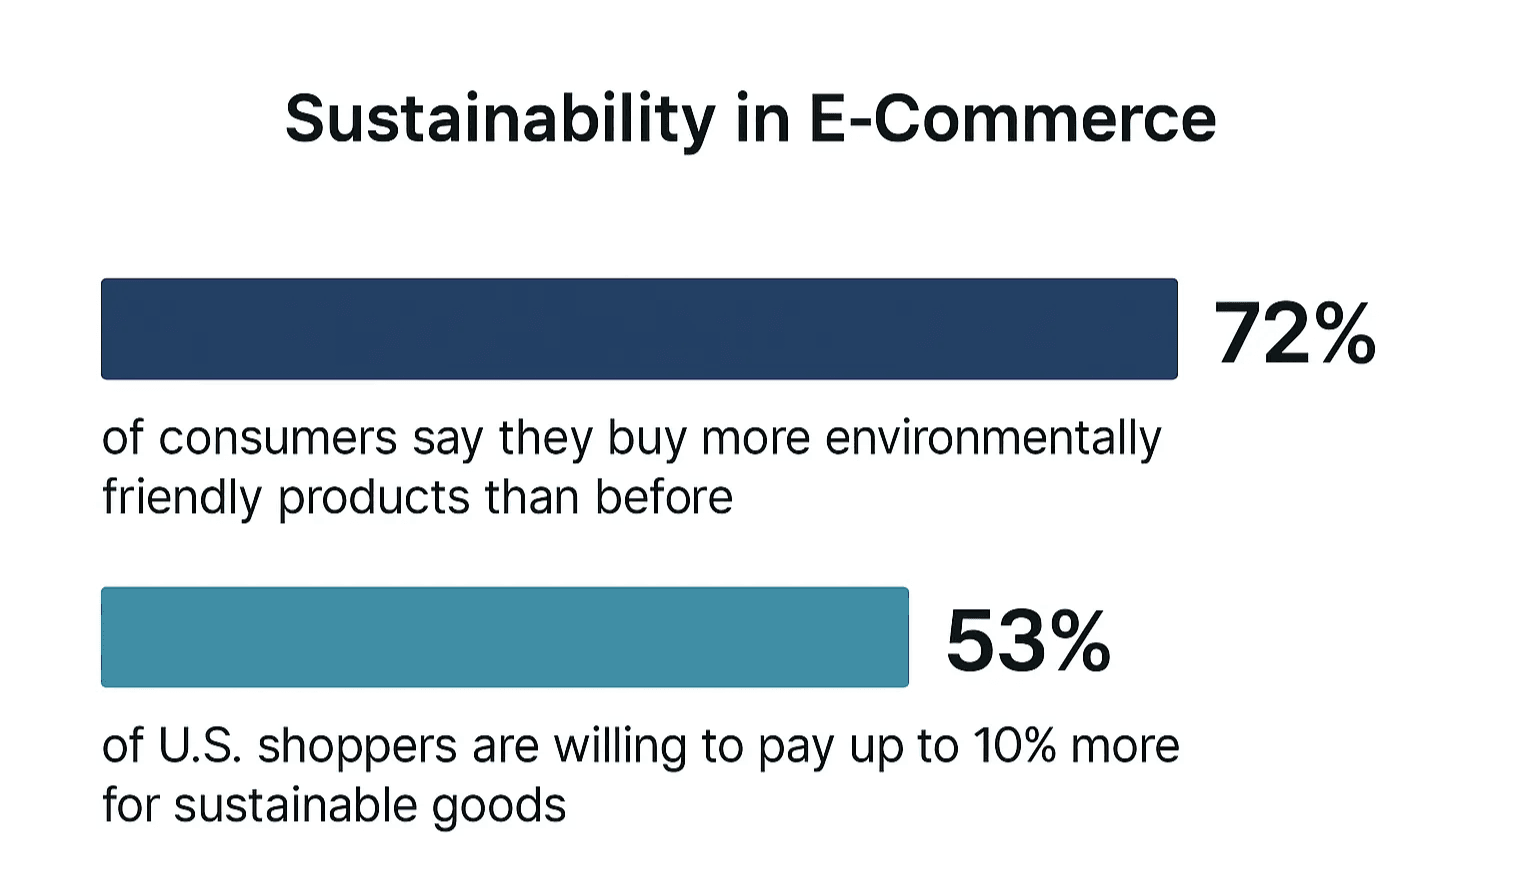
Sustainability is the new frontier in ecommerce. 72% of consumers say they buy more environmentally friendly products than before (), and 53% of U.S. shoppers are willing to pay up to 10% more for sustainable goods ().
But here’s the rub: only 27% are truly devoted to sustainability over price (), and just 5% of Americans “completely trust” sustainability claims (). Many want to buy green, but price, convenience, and trust are big barriers.
Brands love to tout their eco-credentials, but unless there’s transparent proof, consumers remain skeptical. And while hundreds of companies have signed climate pledges, only a minority are on track to meet their goals. The gap between intention and action is real.
Key Takeaways: Reading Between the Lines of Ecommerce Statistics
So, what’s the bottom line? Here’s what I’ve learned—sometimes the hard way—about reading ecommerce statistics:
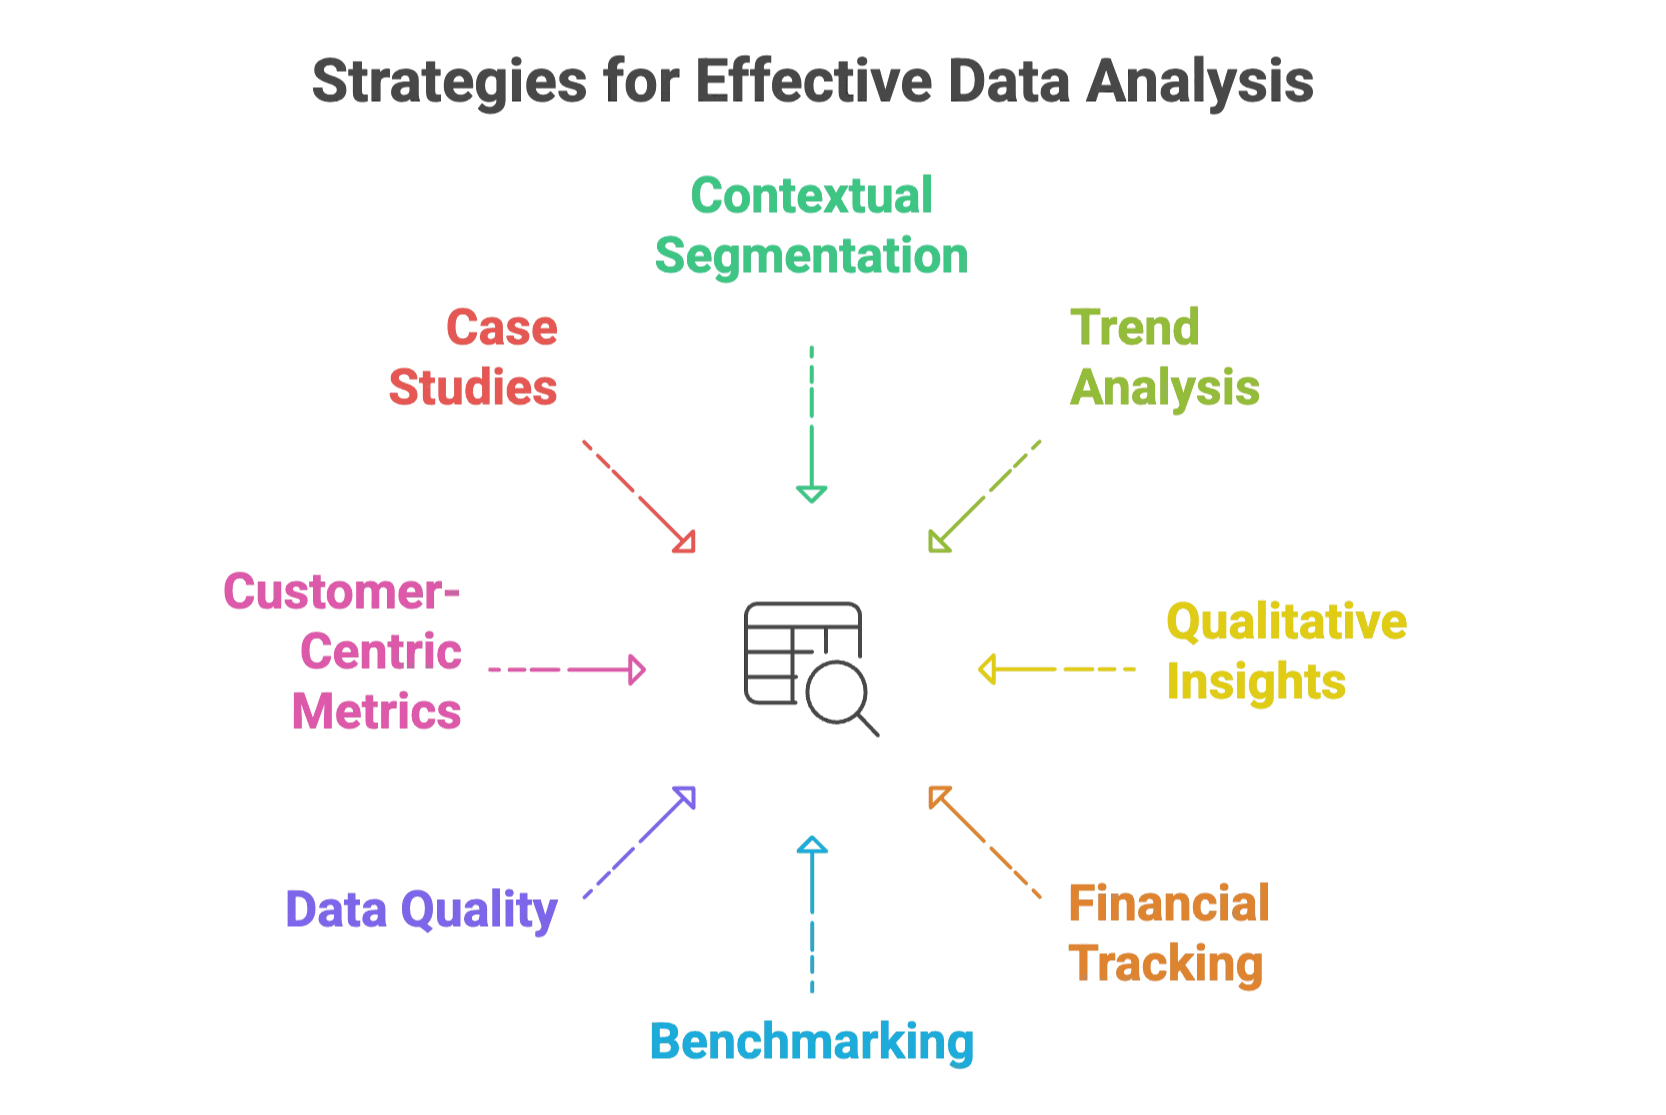
- Context is king. Always segment by region, industry, device, and customer type.
- Trends matter more than snapshots. Don’t extrapolate a one-off spike into a permanent trend.
- Qualitative insights complete the picture. Pair your numbers with customer feedback and real-world observations.
- Follow the money. Track the full funnel—from traffic to conversion to profit, not just vanity metrics.
- Benchmarks are a starting point, not the finish line. Your business is unique—compare against relevant peers, not just global averages.
- Data quality matters. Know exactly what each stat means and how it’s calculated.
- Customer-centric metrics reveal the truth. NPS, CSAT, and lifetime value can show what topline stats miss.
- Case studies and real-world stories are invaluable. Learn from both the wins and the mistakes of others.
And if you’re looking to make sense of your own ecommerce data, tools like can help you dig deeper—whether you’re scraping product listings, tracking competitor prices, or analyzing customer reviews. (Shameless plug: our makes it super simple.)
In the end, statistics are a powerful tool—but only when wielded with curiosity, skepticism, and a healthy dose of humility. The next time someone throws a trillion-dollar stat your way, smile, nod, and then ask: “But what’s the story behind that number?”
Recommended Reading