
Picture this: You’re standing on Main Street, USA, coffee in hand, watching a parade of delivery vans, food trucks, and folks ducking into local boutiques. It’s easy to think of small businesses as the mom-and-pop shops lining your block, but the reality is much bigger—small businesses are the invisible engine humming beneath nearly every community, city, and industry. In fact, 99.9% of all U.S. companies are small businesses, and they employ nearly half of America’s private workforce. That’s not just a fun fact to toss around at your next networking event—it’s the heartbeat of the economy ().
Whether you’re an entrepreneur plotting your next move, a policymaker shaping the future, or just someone who’s ever wondered what it takes to start a small business, understanding the latest small business statistics is more than trivia—it’s a roadmap to where the economy is headed. So, buckle up as we dive into 130 of the most important, surprising, and downright useful stats about small businesses today.
The Big Picture: Small Business Statistics at a Glance
Let’s kick things off with some headline numbers—these are the stats that tell the story at a glance, and they’re the ones I keep coming back to when talking with founders, investors, and, yes, even my dentist (who’s thinking about opening a second practice):
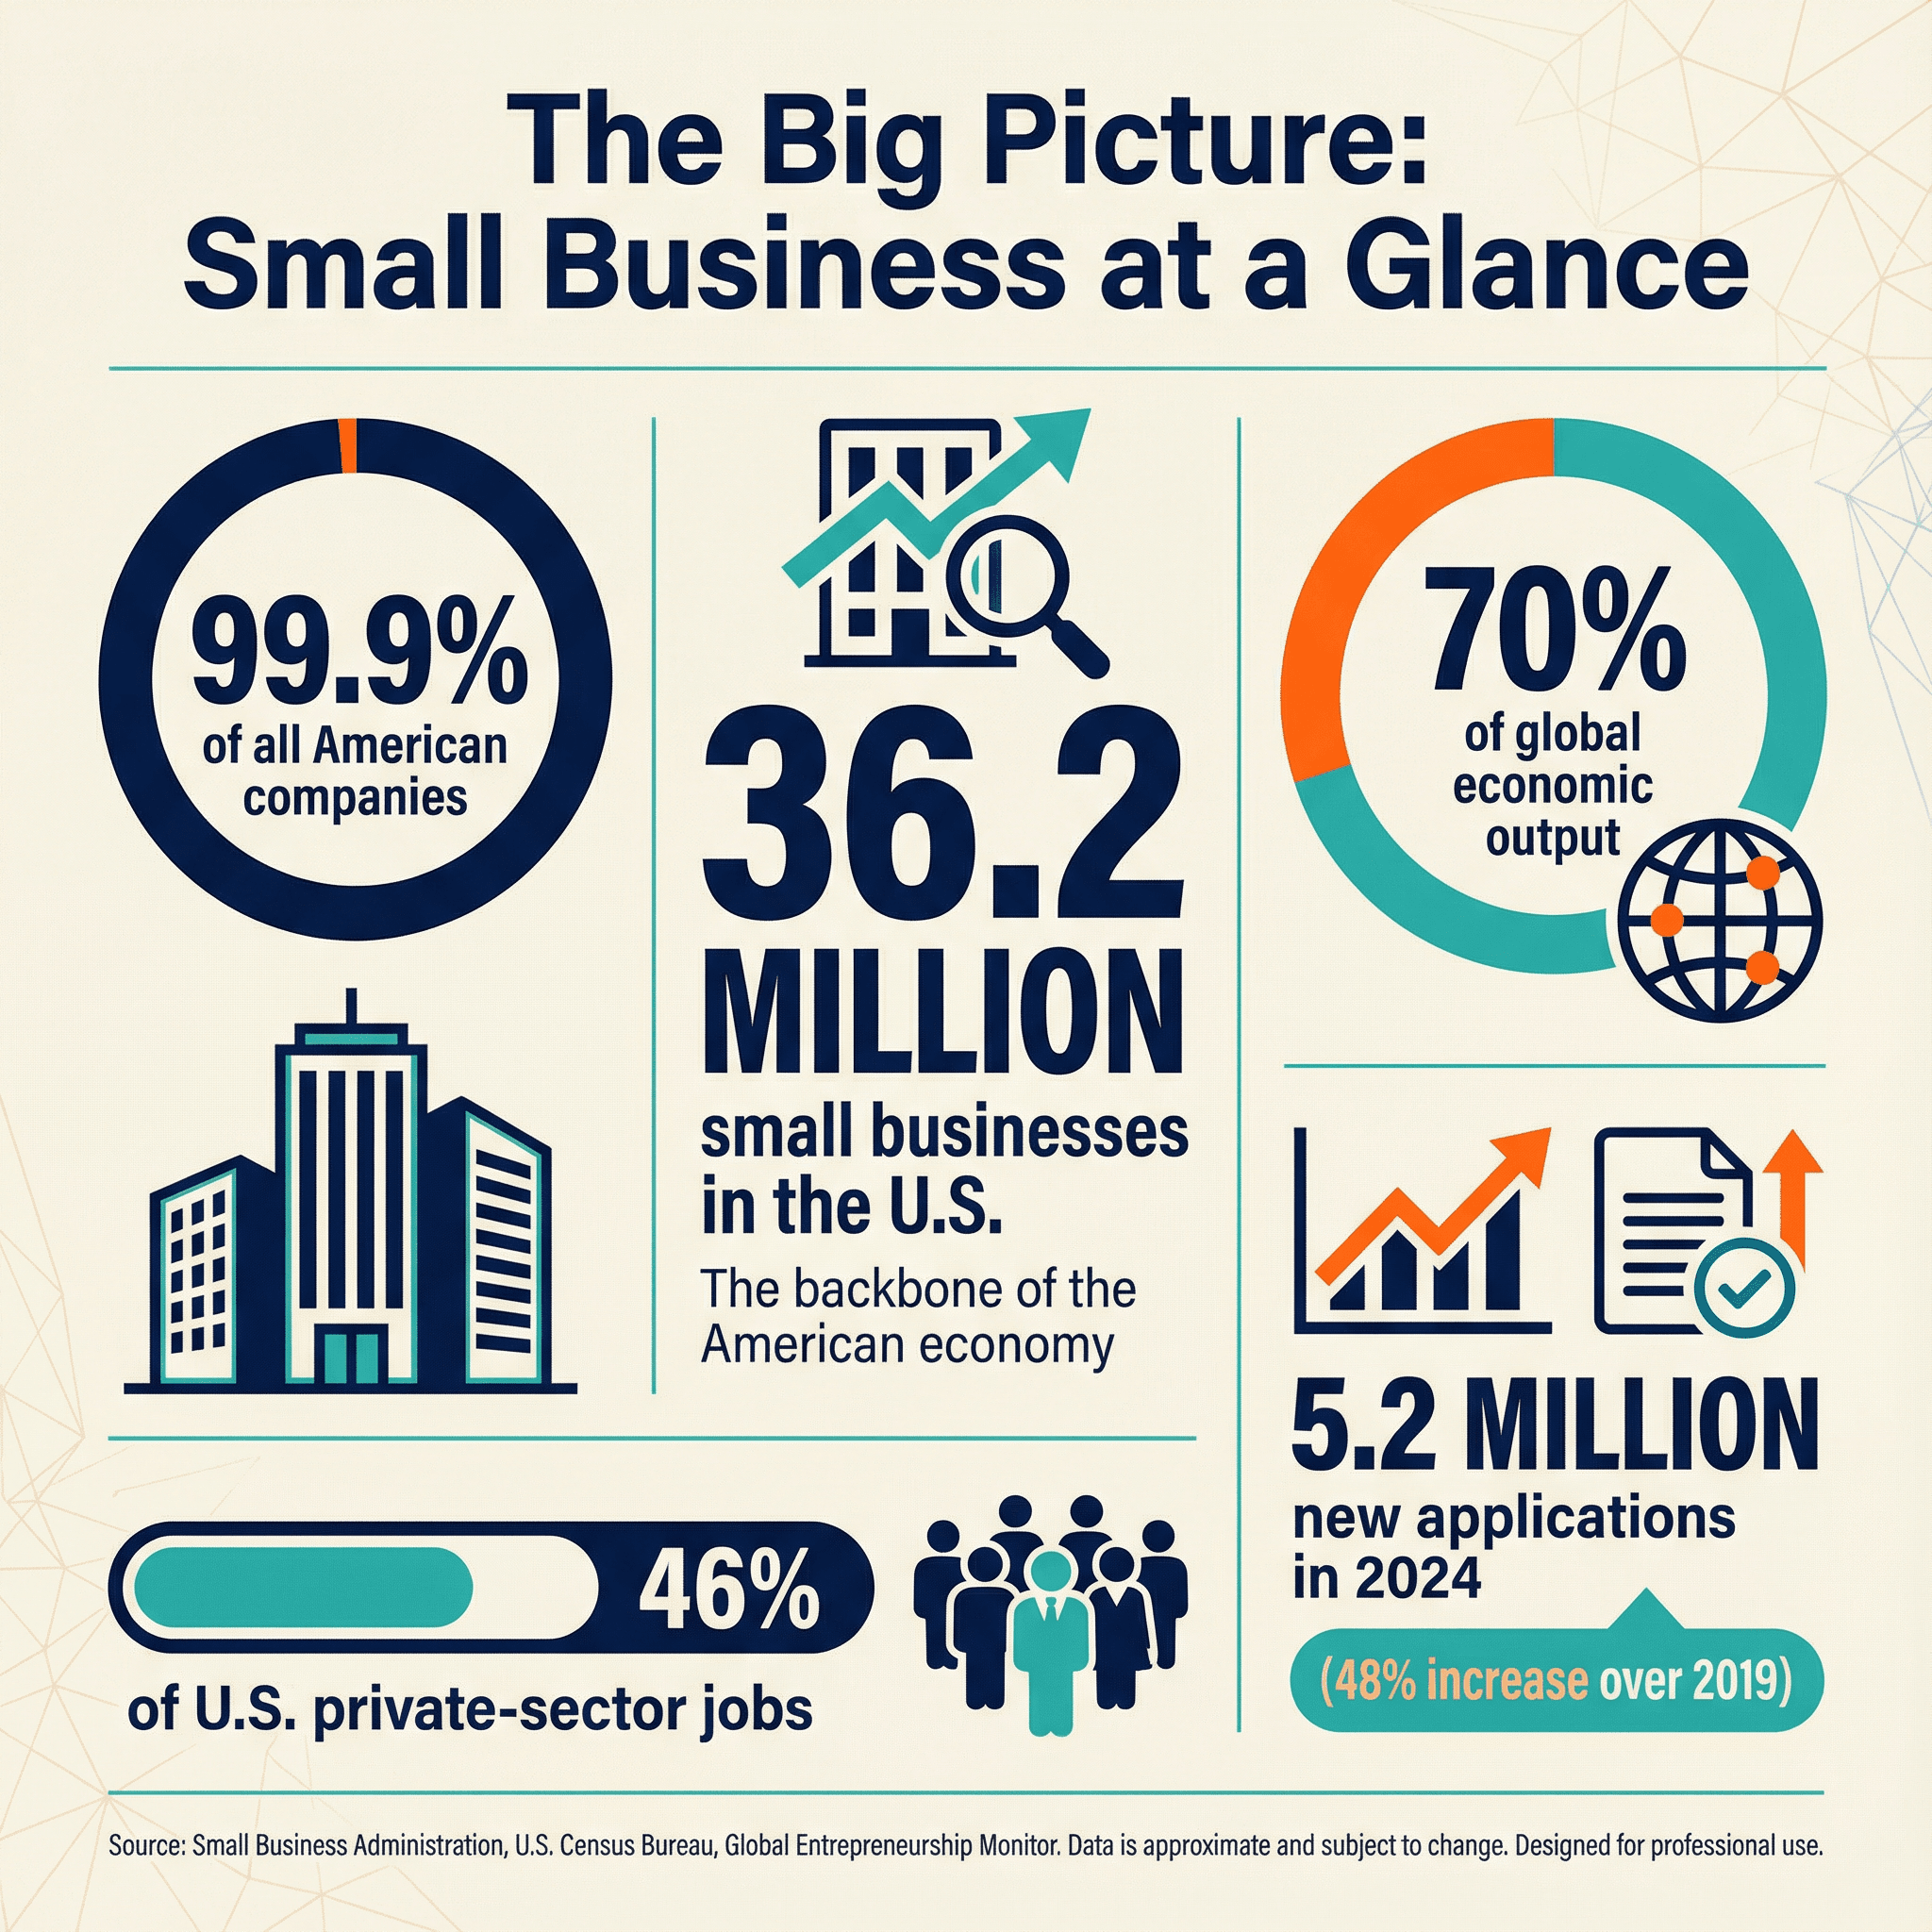
- 36.2 million: Number of small businesses in the U.S. as of 2025, making up 99.9% of all American companies (, ).
- 46%: Share of U.S. private-sector jobs supported by small businesses ().
- 90%: Proportion of all global businesses that are small- or medium-sized enterprises (SMEs).
- 70%: Share of global economic output and employment driven by small businesses ().
- 5.2 million: New U.S. small business applications filed in 2024—a 48% increase over 2019.
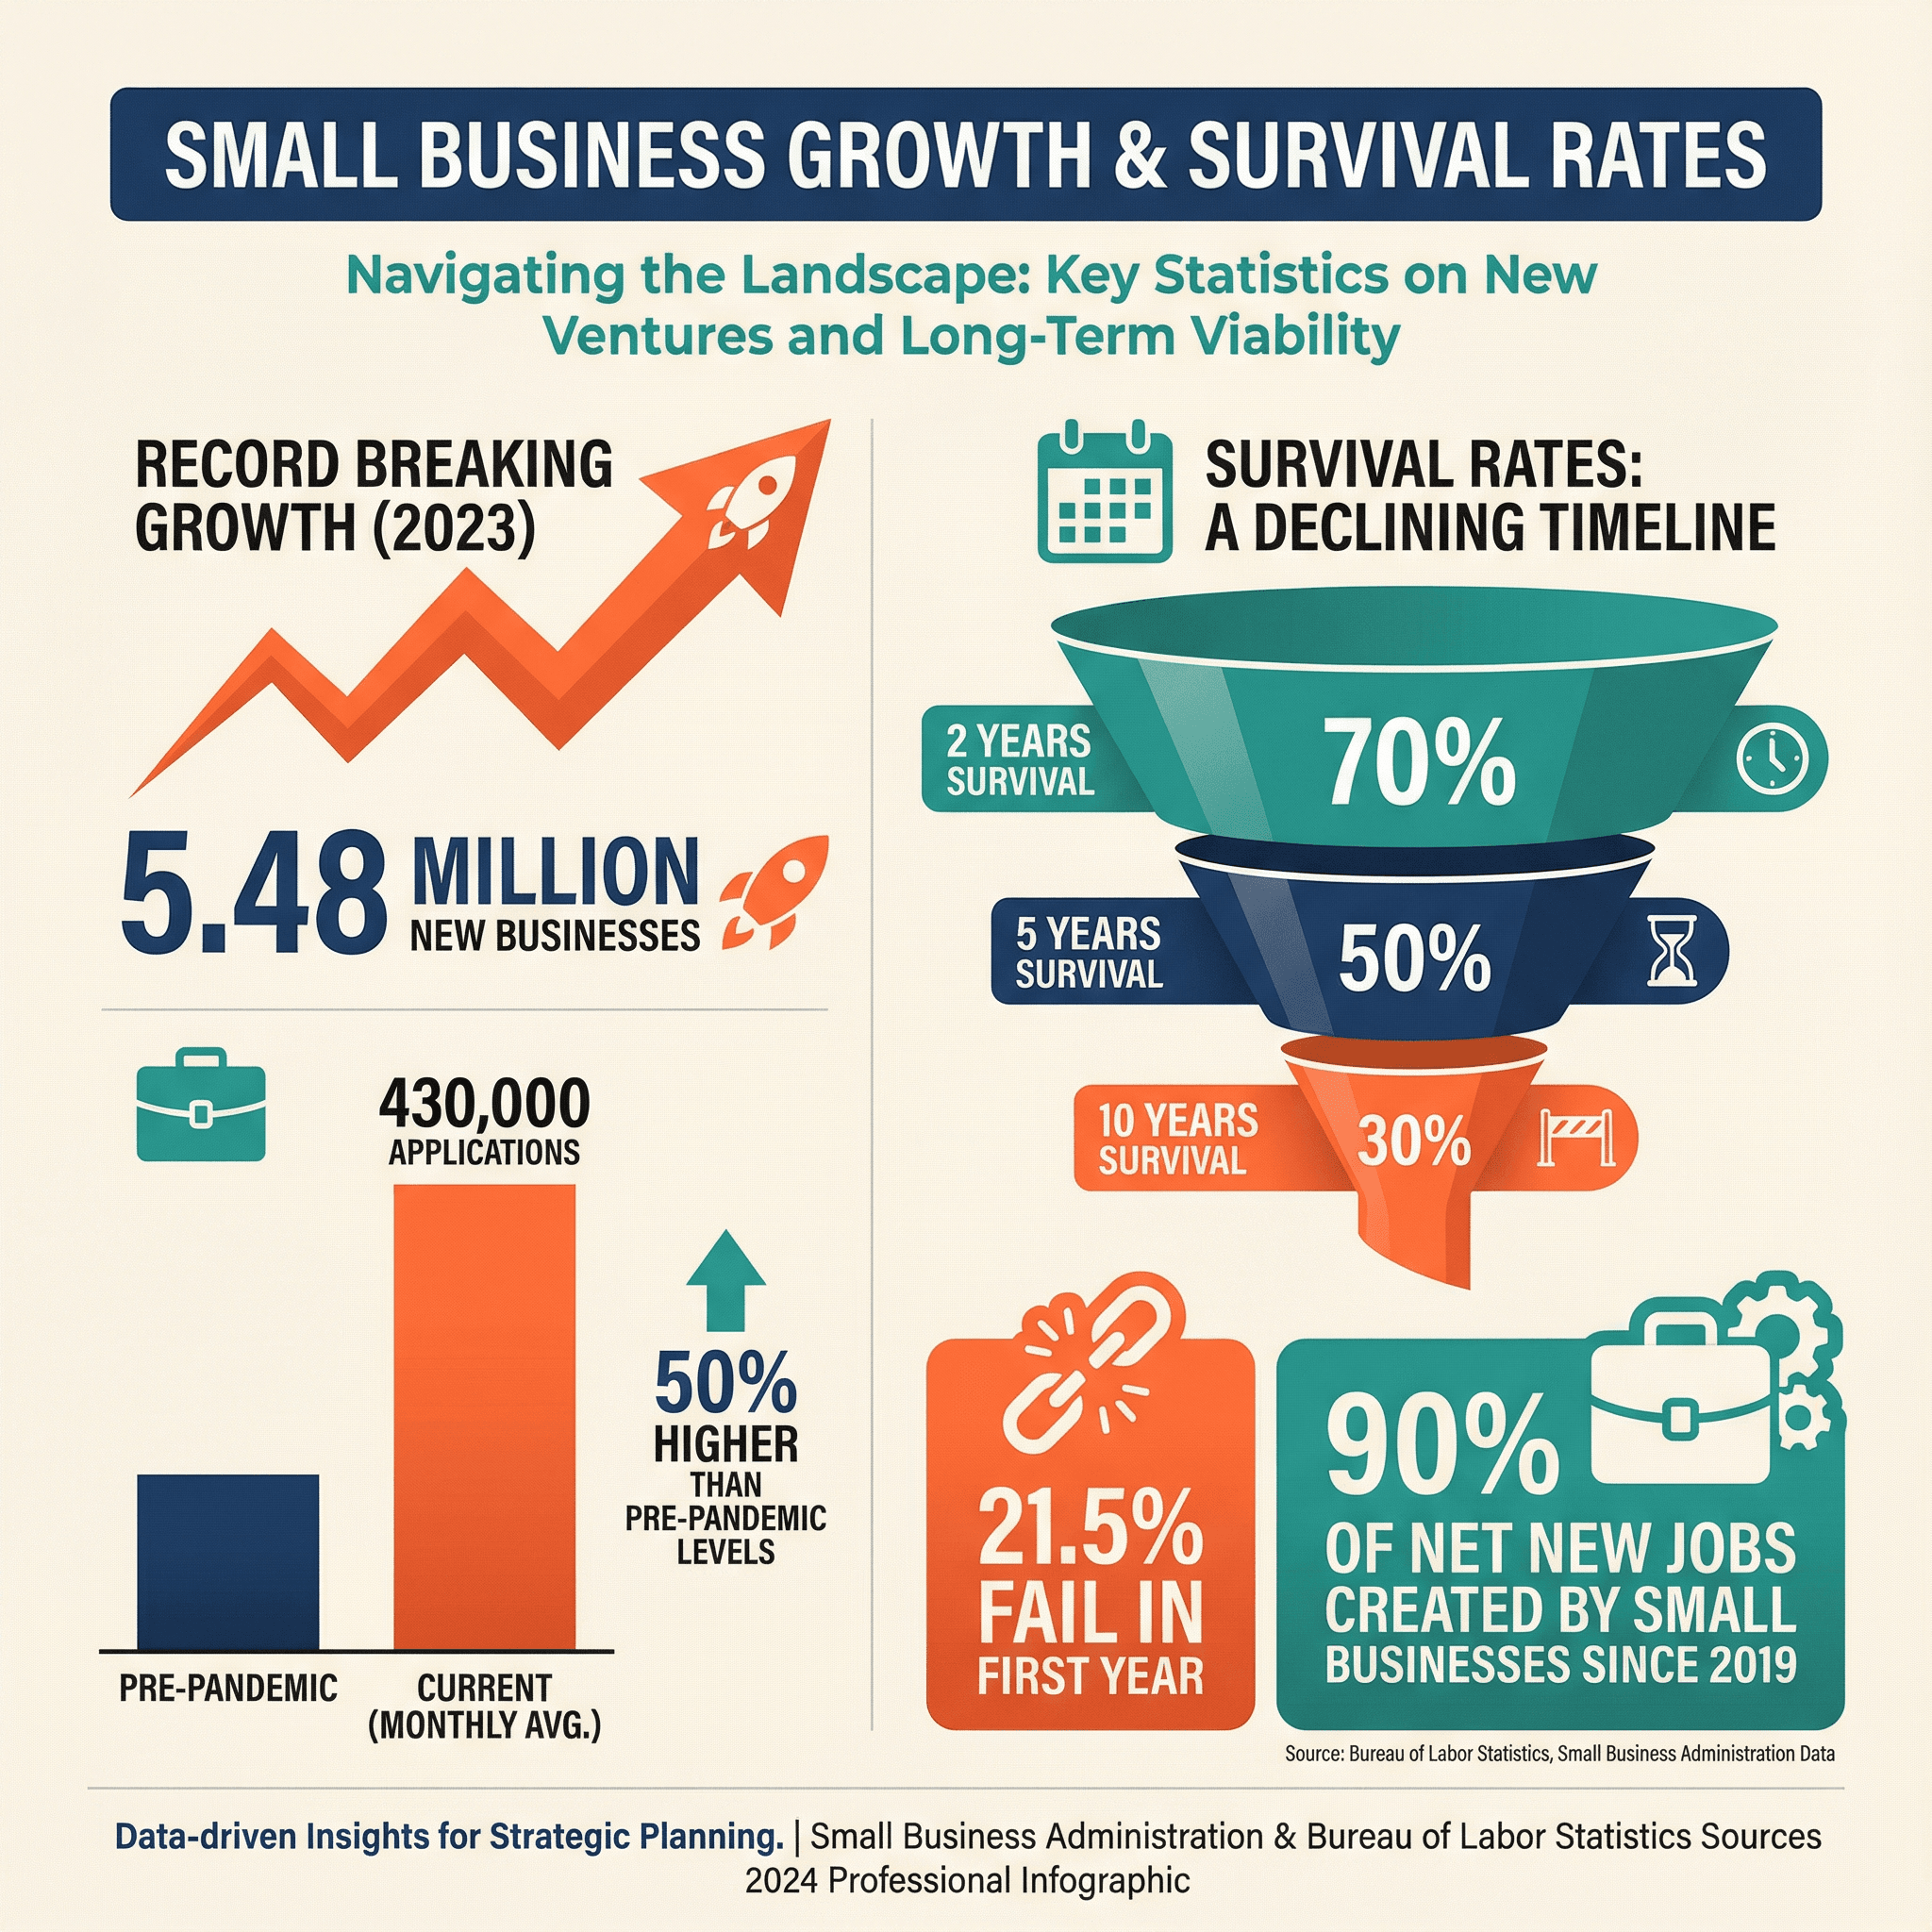
- 70% / 50% / 30%: U.S. small business survival rates—about 70% survive past 2 years, 50% past 5 years, 30% past 10 years.
- 39.4%: Share of U.S. small businesses majority-owned by women ().
- 33.6%: Share of U.S. small businesses majority-owned by racial/ethnic minorities.
- 5.5%: Share of U.S. small businesses owned by veterans.
- 73%: U.S. small businesses with their own website ().
- 75%: Small and medium businesses investing in AI tools ().
These numbers only scratch the surface, but they give you a sense of just how vast—and vital—the small business landscape really is.
Defining Small Businesses: What Counts and Why It Matters
So, what exactly is a “small business”? Turns out, it’s not just your local bakery or the neighborhood gym. In the U.S., the Small Business Administration (SBA) generally defines a small business as any firm with fewer than 500 employees—though the specifics can vary by industry (). For example, a manufacturing company with 400 employees is still considered “small,” while a high-revenue wholesaler might have a lower employee cap.
Why does this matter? Because these definitions determine who gets access to government loans, contracts, and support programs. If you’re starting a business, knowing where you fit can open doors—or close them. In the European Union, the bar is even lower: a “small” business is one with fewer than 50 employees and less than €10 million in turnover (). No matter where you are, understanding these thresholds is key for funding, compliance, and benchmarking your growth.
Small Business Growth Statistics: Trends and Surges
If you think entrepreneurship is slowing down, think again. The last few years have seen a historic boom in new business formation—and it’s not just a pandemic blip.
- 5.48 million new businesses were started in the U.S. in 2023, and 5.2 million in 2024—nearly 48% higher than in 2019.
- On average, 430,000 new business applications are filed each month in 2024, about 50% higher than pre-pandemic rates.
- About 140,000 applications per month in 2024 involved plans to hire employees, up 30% from 2019.
Startup Activity and New Business Applications
This surge isn’t limited to one sector. Retail leads the pack (about 15% of small firms), followed by food/restaurants (13%) and health/beauty services (10%). Tech, home services, and online retail are also seeing above-average growth, especially in regions with strong startup ecosystems.
Small businesses have powered the job market, too: since 2019, they’ve created roughly 90% of net new jobs, up from 64% in the previous cycle. That’s a lot of new payrolls, and a big reason why economists keep a close eye on small business trends.
Small Business Survival and Failure Rates
Starting a business is tough, and not every venture makes it. Here’s how the odds shake out:
- 70% survive beyond 2 years.
- 50% make it past 5 years.
- 30–35% are still operating after 10 years.
- 21.5% fail in the first year, and 65.1% by year ten ().
Industries like tech and certain services see higher early failure rates (up to 26% in year one). The usual suspects for failure? Inadequate financing, lack of product-market fit, high competition, and poor cash flow management.
Small Business Demographics: Who Owns and Leads
The face of small business ownership is changing fast, and it’s more diverse than ever.
Generational and Gender Ownership
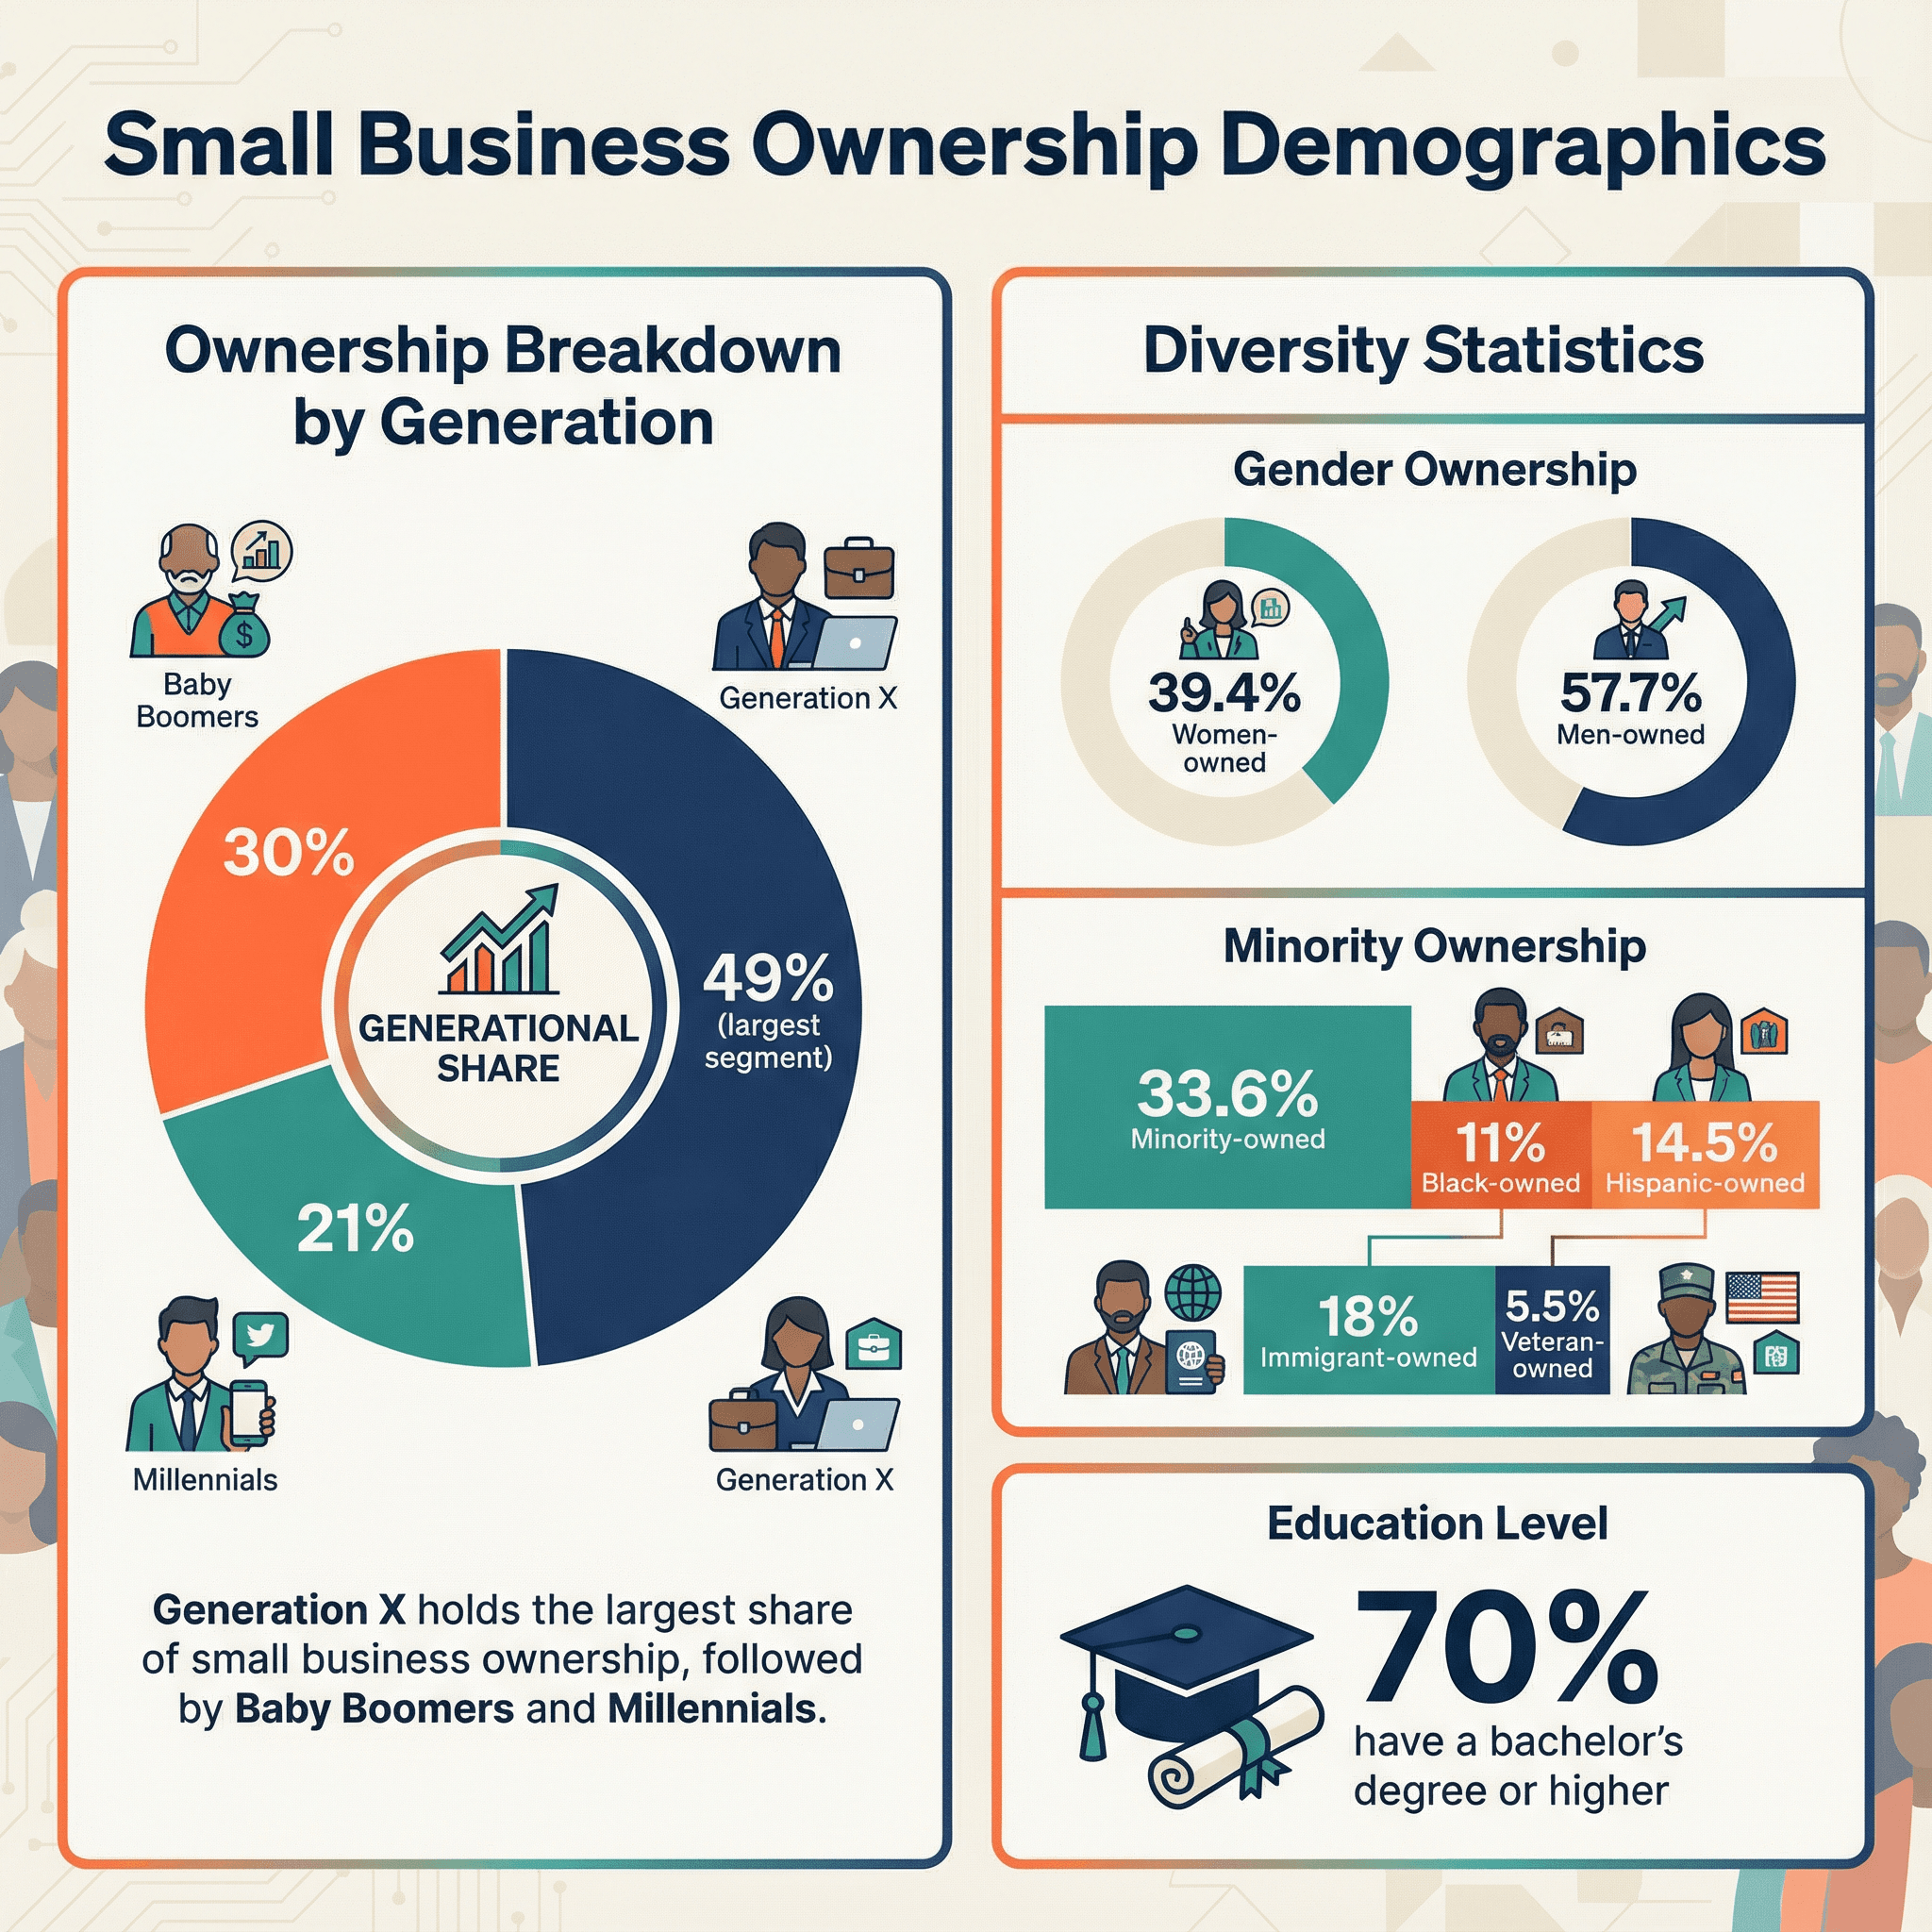
- 49% of U.S. small businesses are owned by Generation X entrepreneurs, outnumbering Baby Boomers (30%) and Millennials (21%).
- 39.4% of small businesses are majority-owned by women (), while men own 57.7%.
- About 70% of small business owners have at least a bachelor’s degree, and over 27% hold graduate degrees.
Women-owned businesses are growing rapidly, but they still face bigger funding gaps compared to their male counterparts.
Minority, Veteran, and Immigrant Entrepreneurs
- 33.6% of small businesses are majority-owned by racial/ethnic minorities.
- 11% are Black-owned (), and 14.5% are Hispanic-owned.
- 5.5% are veteran-owned (about 1.6 million firms).
- 18% of employer-business owners are immigrants (), with even higher shares in sectors like food services.
Minority, women, veteran, and immigrant entrepreneurs are driving innovation and job creation, but they often face unique challenges in accessing capital and networks. That’s why targeted support programs are more important than ever.
Small Business Employment Statistics: Jobs and Workforce Impact
Small businesses aren’t just job creators—they’re job sustainers.
Job Creation and Employee Distribution
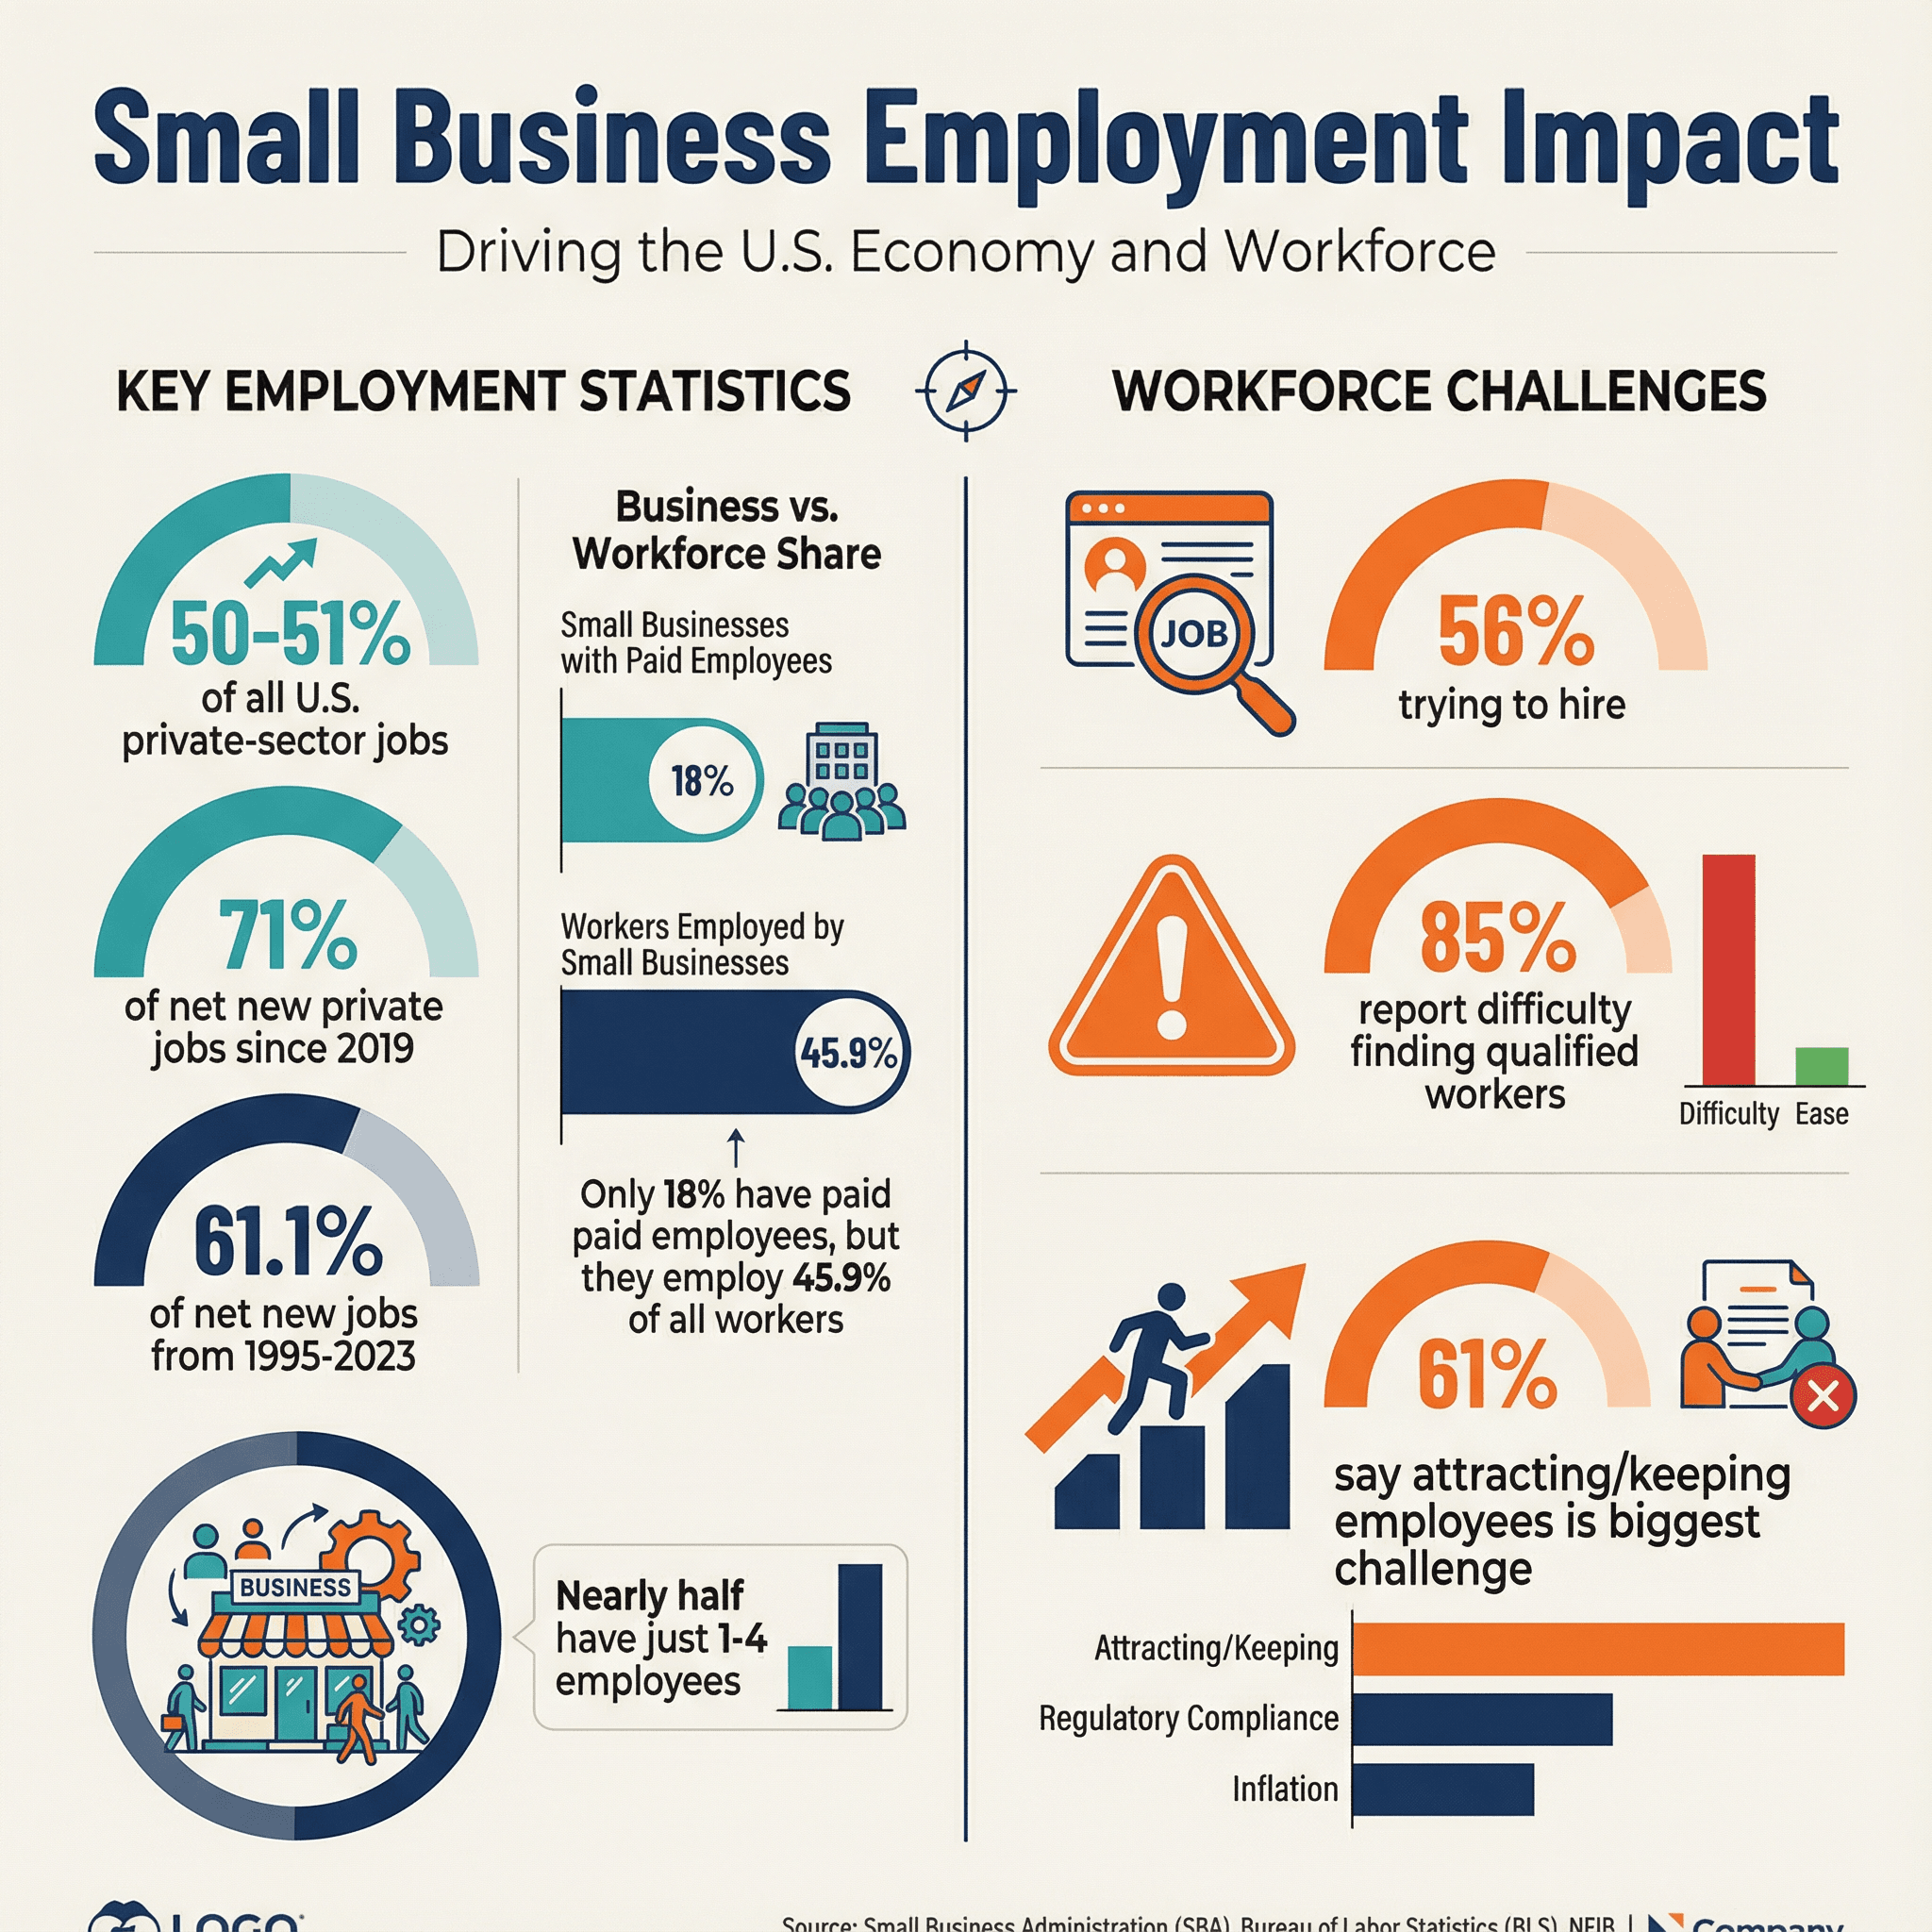
- Firms with fewer than 500 employees account for 50–51% of all U.S. private-sector jobs ().
- Since 2019, small firms have generated about 71% of net new private jobs.
- Historically, small businesses created 61.1% of all net new private-sector positions from 1995–2023 ().
Most small businesses are tiny: only 18% have any paid employees, but those firms employ 45.9% of all U.S. workers. Nearly half of small employer firms have just 1–4 employees.
Workforce Challenges and Opportunities
Hiring is a headache for many small businesses:
- 56% of small business owners were trying to hire in early 2025, but 85% reported difficulty finding qualified workers.
- 61% of growing small employer firms say attracting and keeping good employees is their biggest challenge ().
While about half of small employers offer health insurance and retirement plans, many struggle to match the benefits of larger companies. On the bright side, small business employees often report higher job satisfaction thanks to close-knit teams and flexible cultures.
Starting a Small Business: Motivations, Barriers, and Funding
Ever wonder why people take the plunge into entrepreneurship? Spoiler: It’s not just about the money.
Motivations for Starting a Small Business
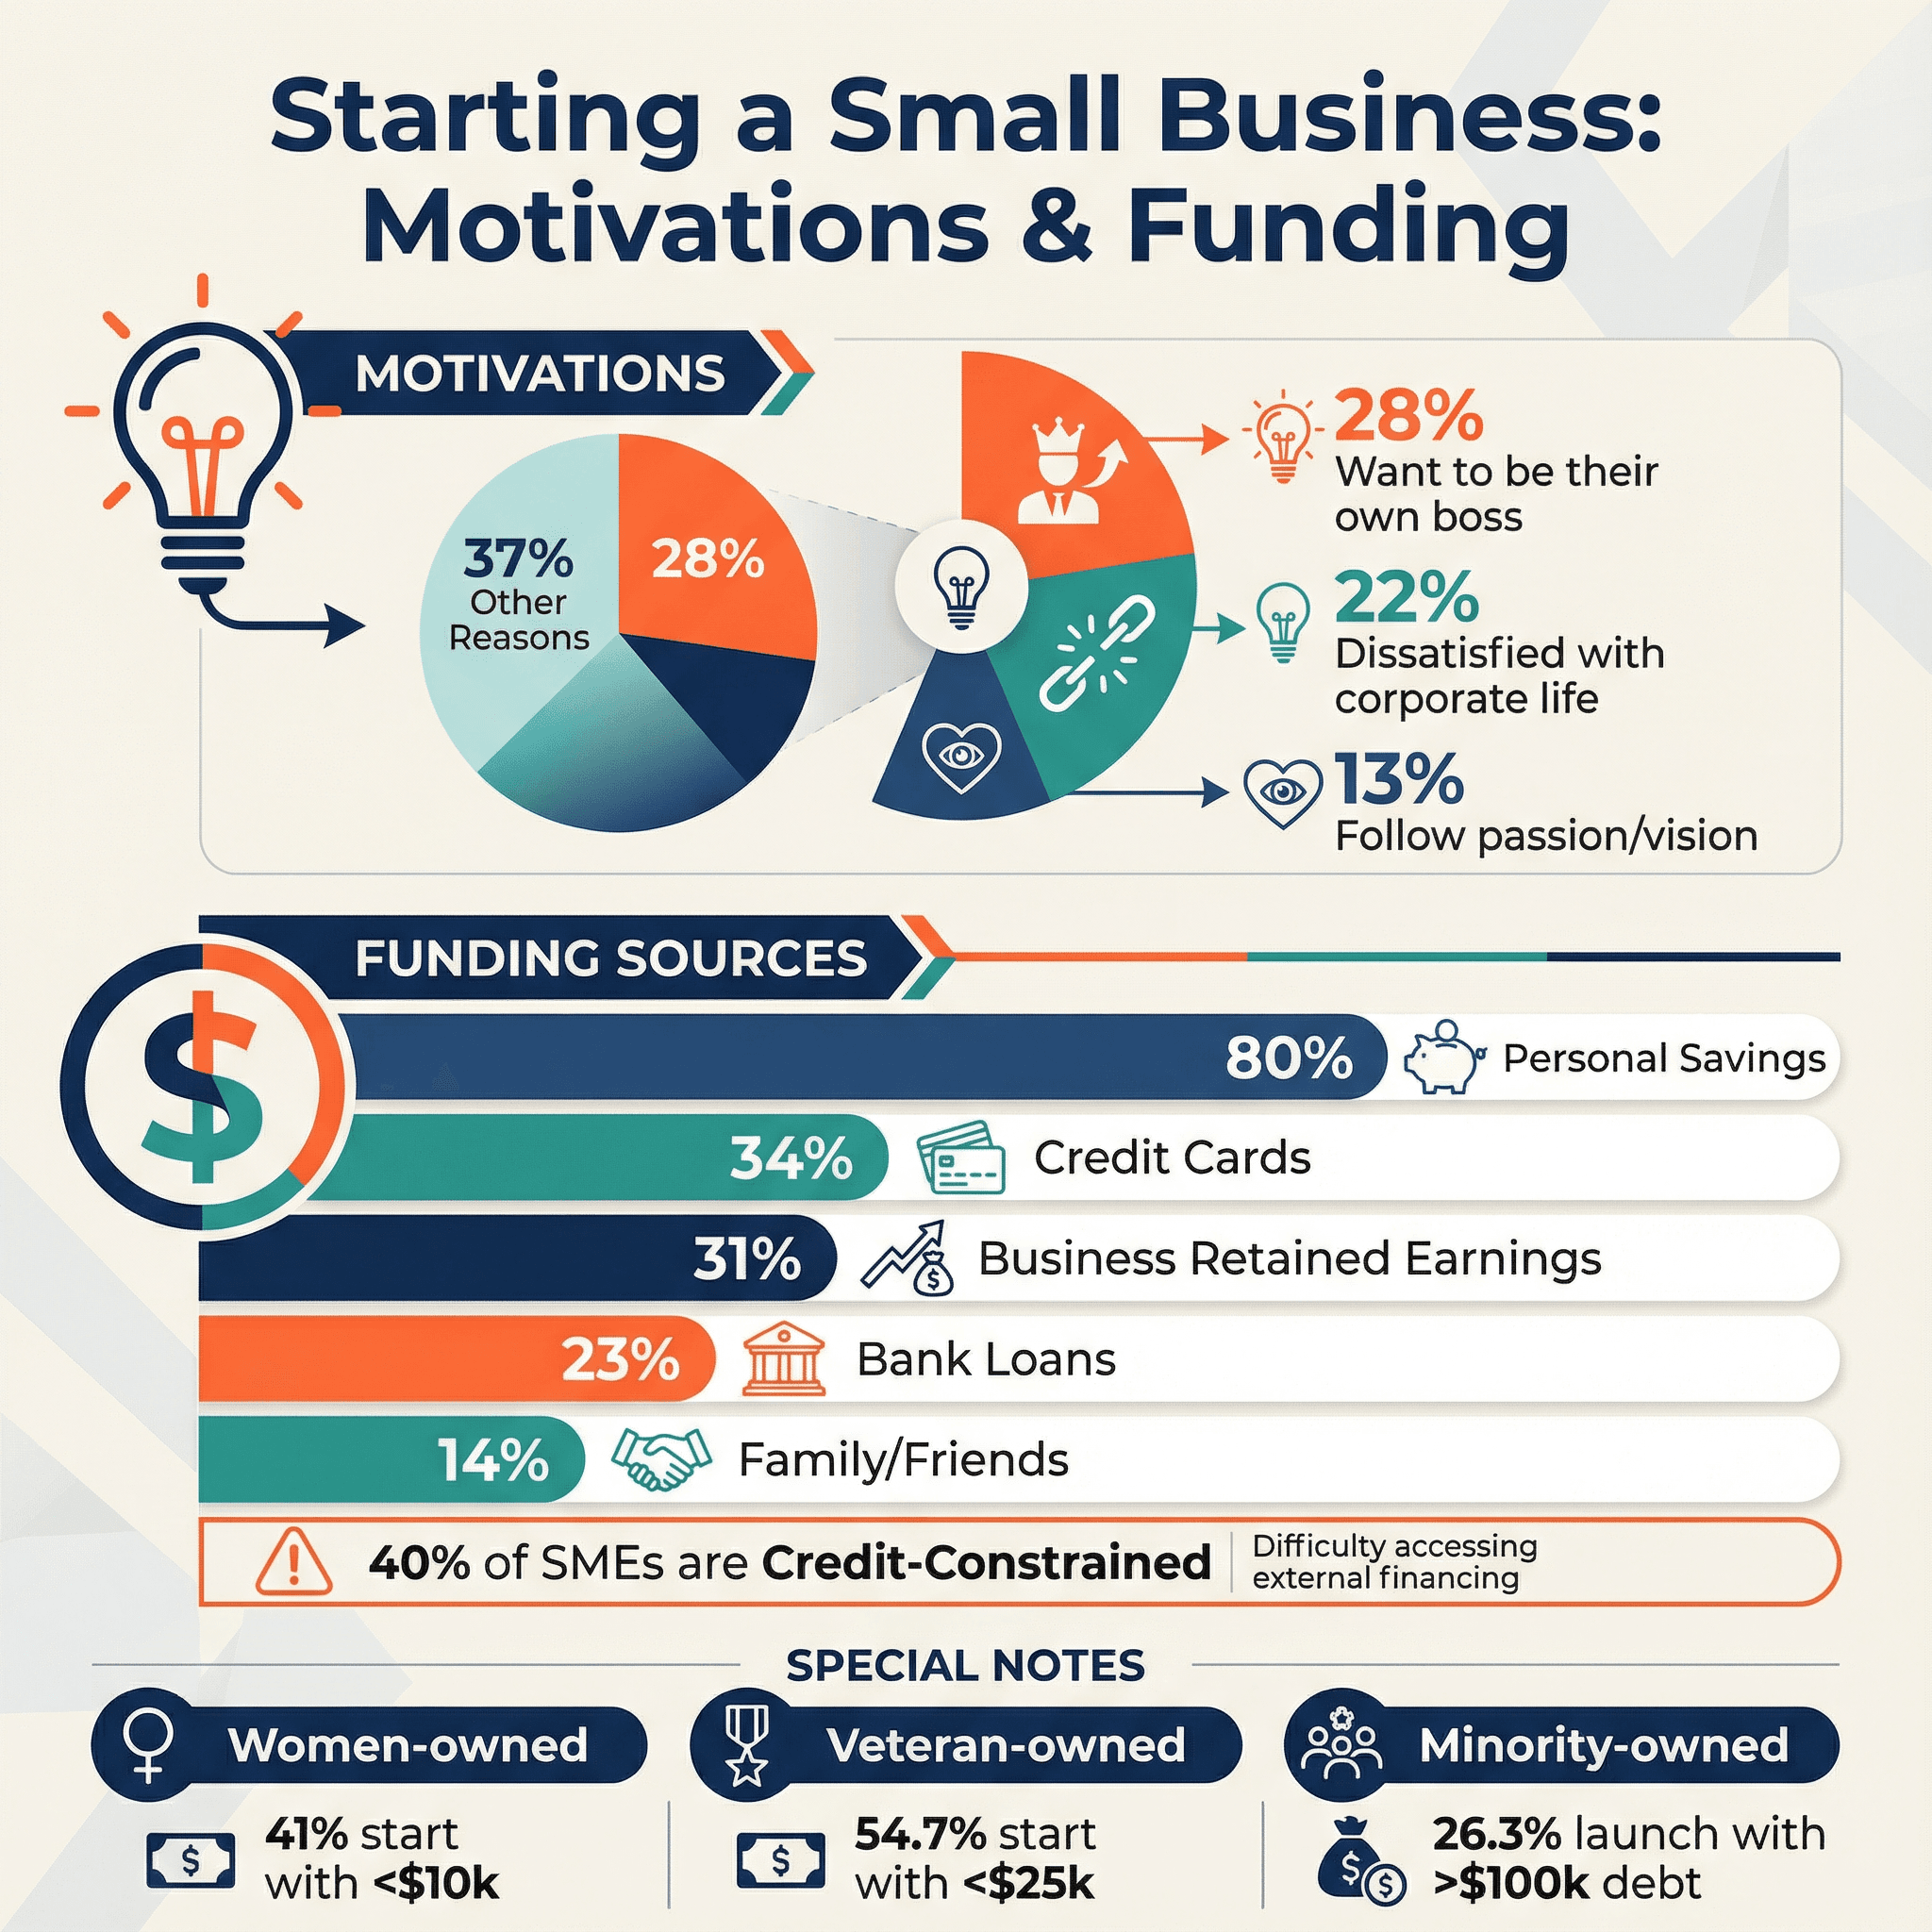
- 28% want to be their own boss.
- 22% are dissatisfied with corporate life.
- 13% start a business to follow a passion or vision.
Necessity-driven entrepreneurship (starting a business because there’s no other work) is less common in the U.S., but it spikes during economic downturns or in certain communities. Most founders are chasing independence, flexibility, or the thrill of building something new.
Funding and Capital Access
Most startups are bootstrapped:
- 80% of employer firms and 76% of nonemployer firms use personal savings ().
- 34% use credit cards.
- 31% use business retained earnings.
- 23% obtain a bank loan.
- 14% borrow from family or friends.
Access to capital varies:
- 26.3% of minority-owned firms launch with over $100,000 in debt, slightly above the average.
- 54.7% of veteran-owned firms start with less than $25,000.
- 41% of women-owned startups begin with less than $10,000 and are less likely to take on bank loans.
40% of formal SMEs report being credit-constrained, making funding the top barrier for many entrepreneurs. Other hurdles include regulation, taxes, and market uncertainty.
Small Businesses and Technology: Digital Adoption and AI Trends
If you think small businesses are stuck in the past, think again. The digital revolution is alive and well on Main Street.
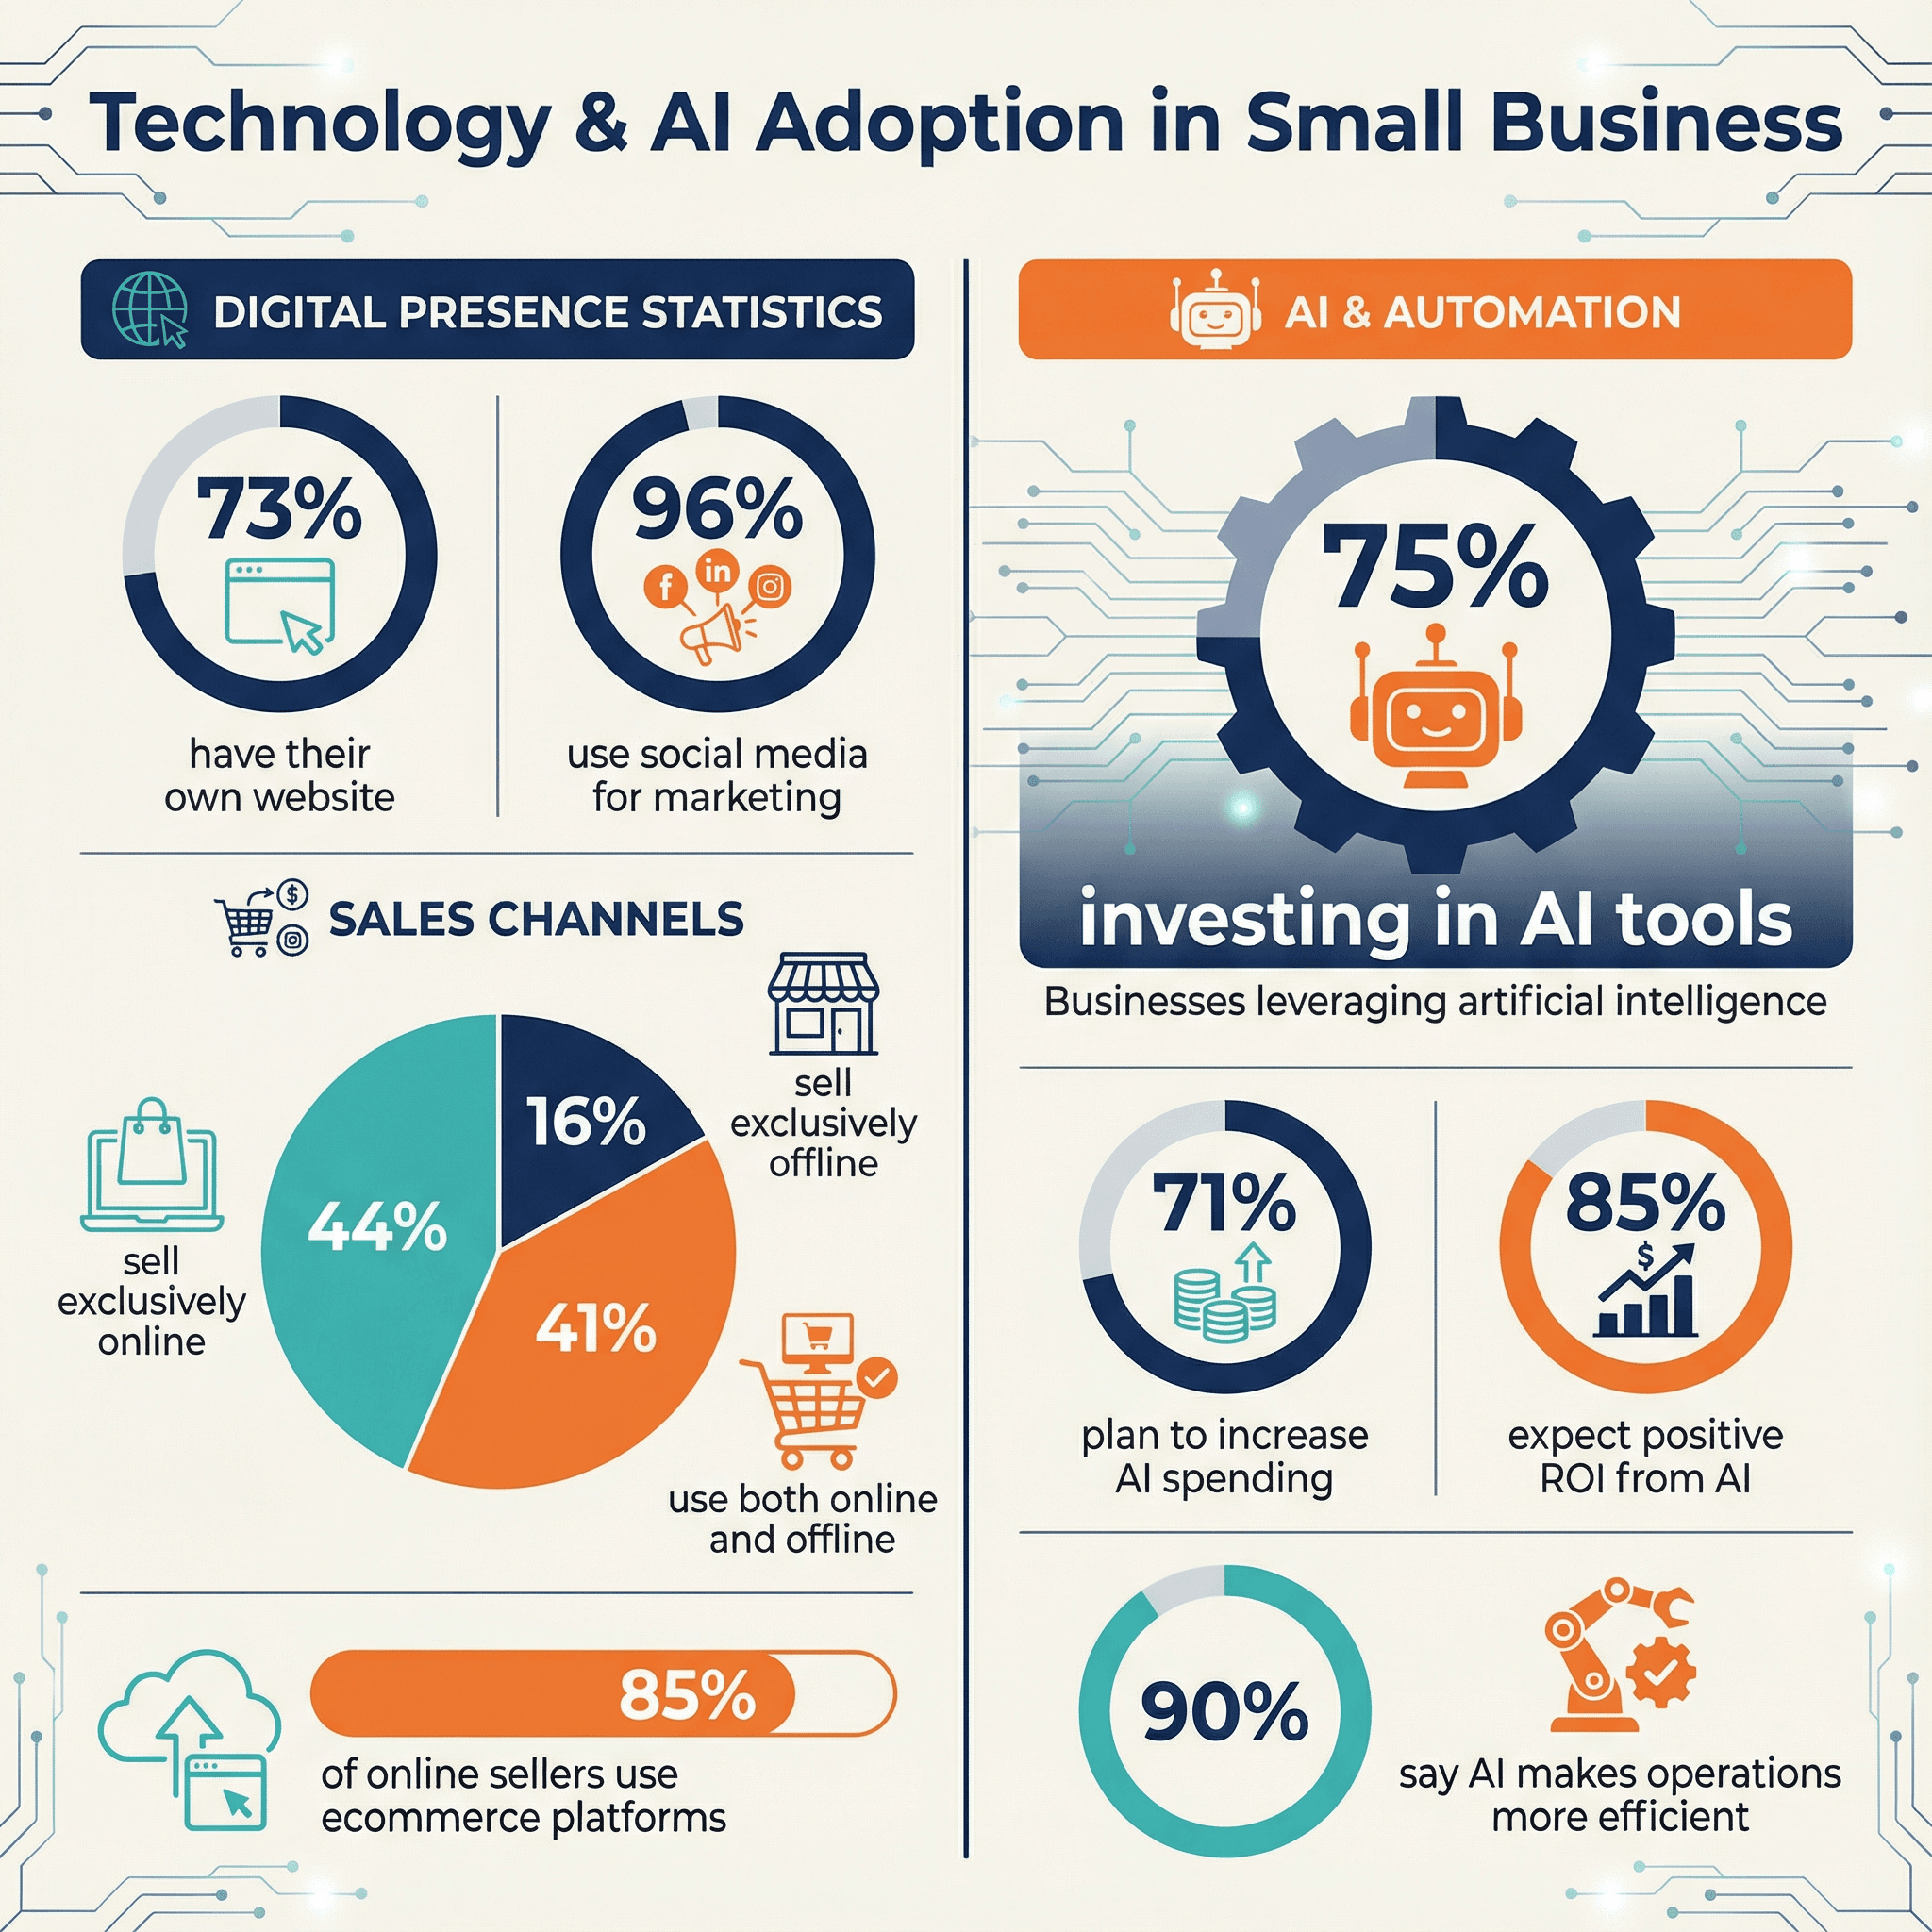
- 73% of U.S. small businesses have their own website ().
- 96% use social media for marketing ().
- 44% sell exclusively online, 16% exclusively offline, and 41% do both ().
- 85% of online sellers use at least one ecommerce platform ().
AI, Automation, and Digital Tools
The AI wave isn’t just for Silicon Valley:
- 75% of small and medium businesses are investing in AI tools ().
- 71% plan to increase AI spending in the next year.
- 85% of AI adopters expect a positive ROI.
- 90% say AI has made operations more efficient.
Popular use cases? Marketing (ad optimization, content creation), customer service chatbots, and automating repetitive tasks. But there are hurdles: cost, security, and digital skills. Only 48% of small businesses have provided cybersecurity training in the past year ().
Industry Breakdown: Where Small Businesses Thrive
Some industries are small business magnets:
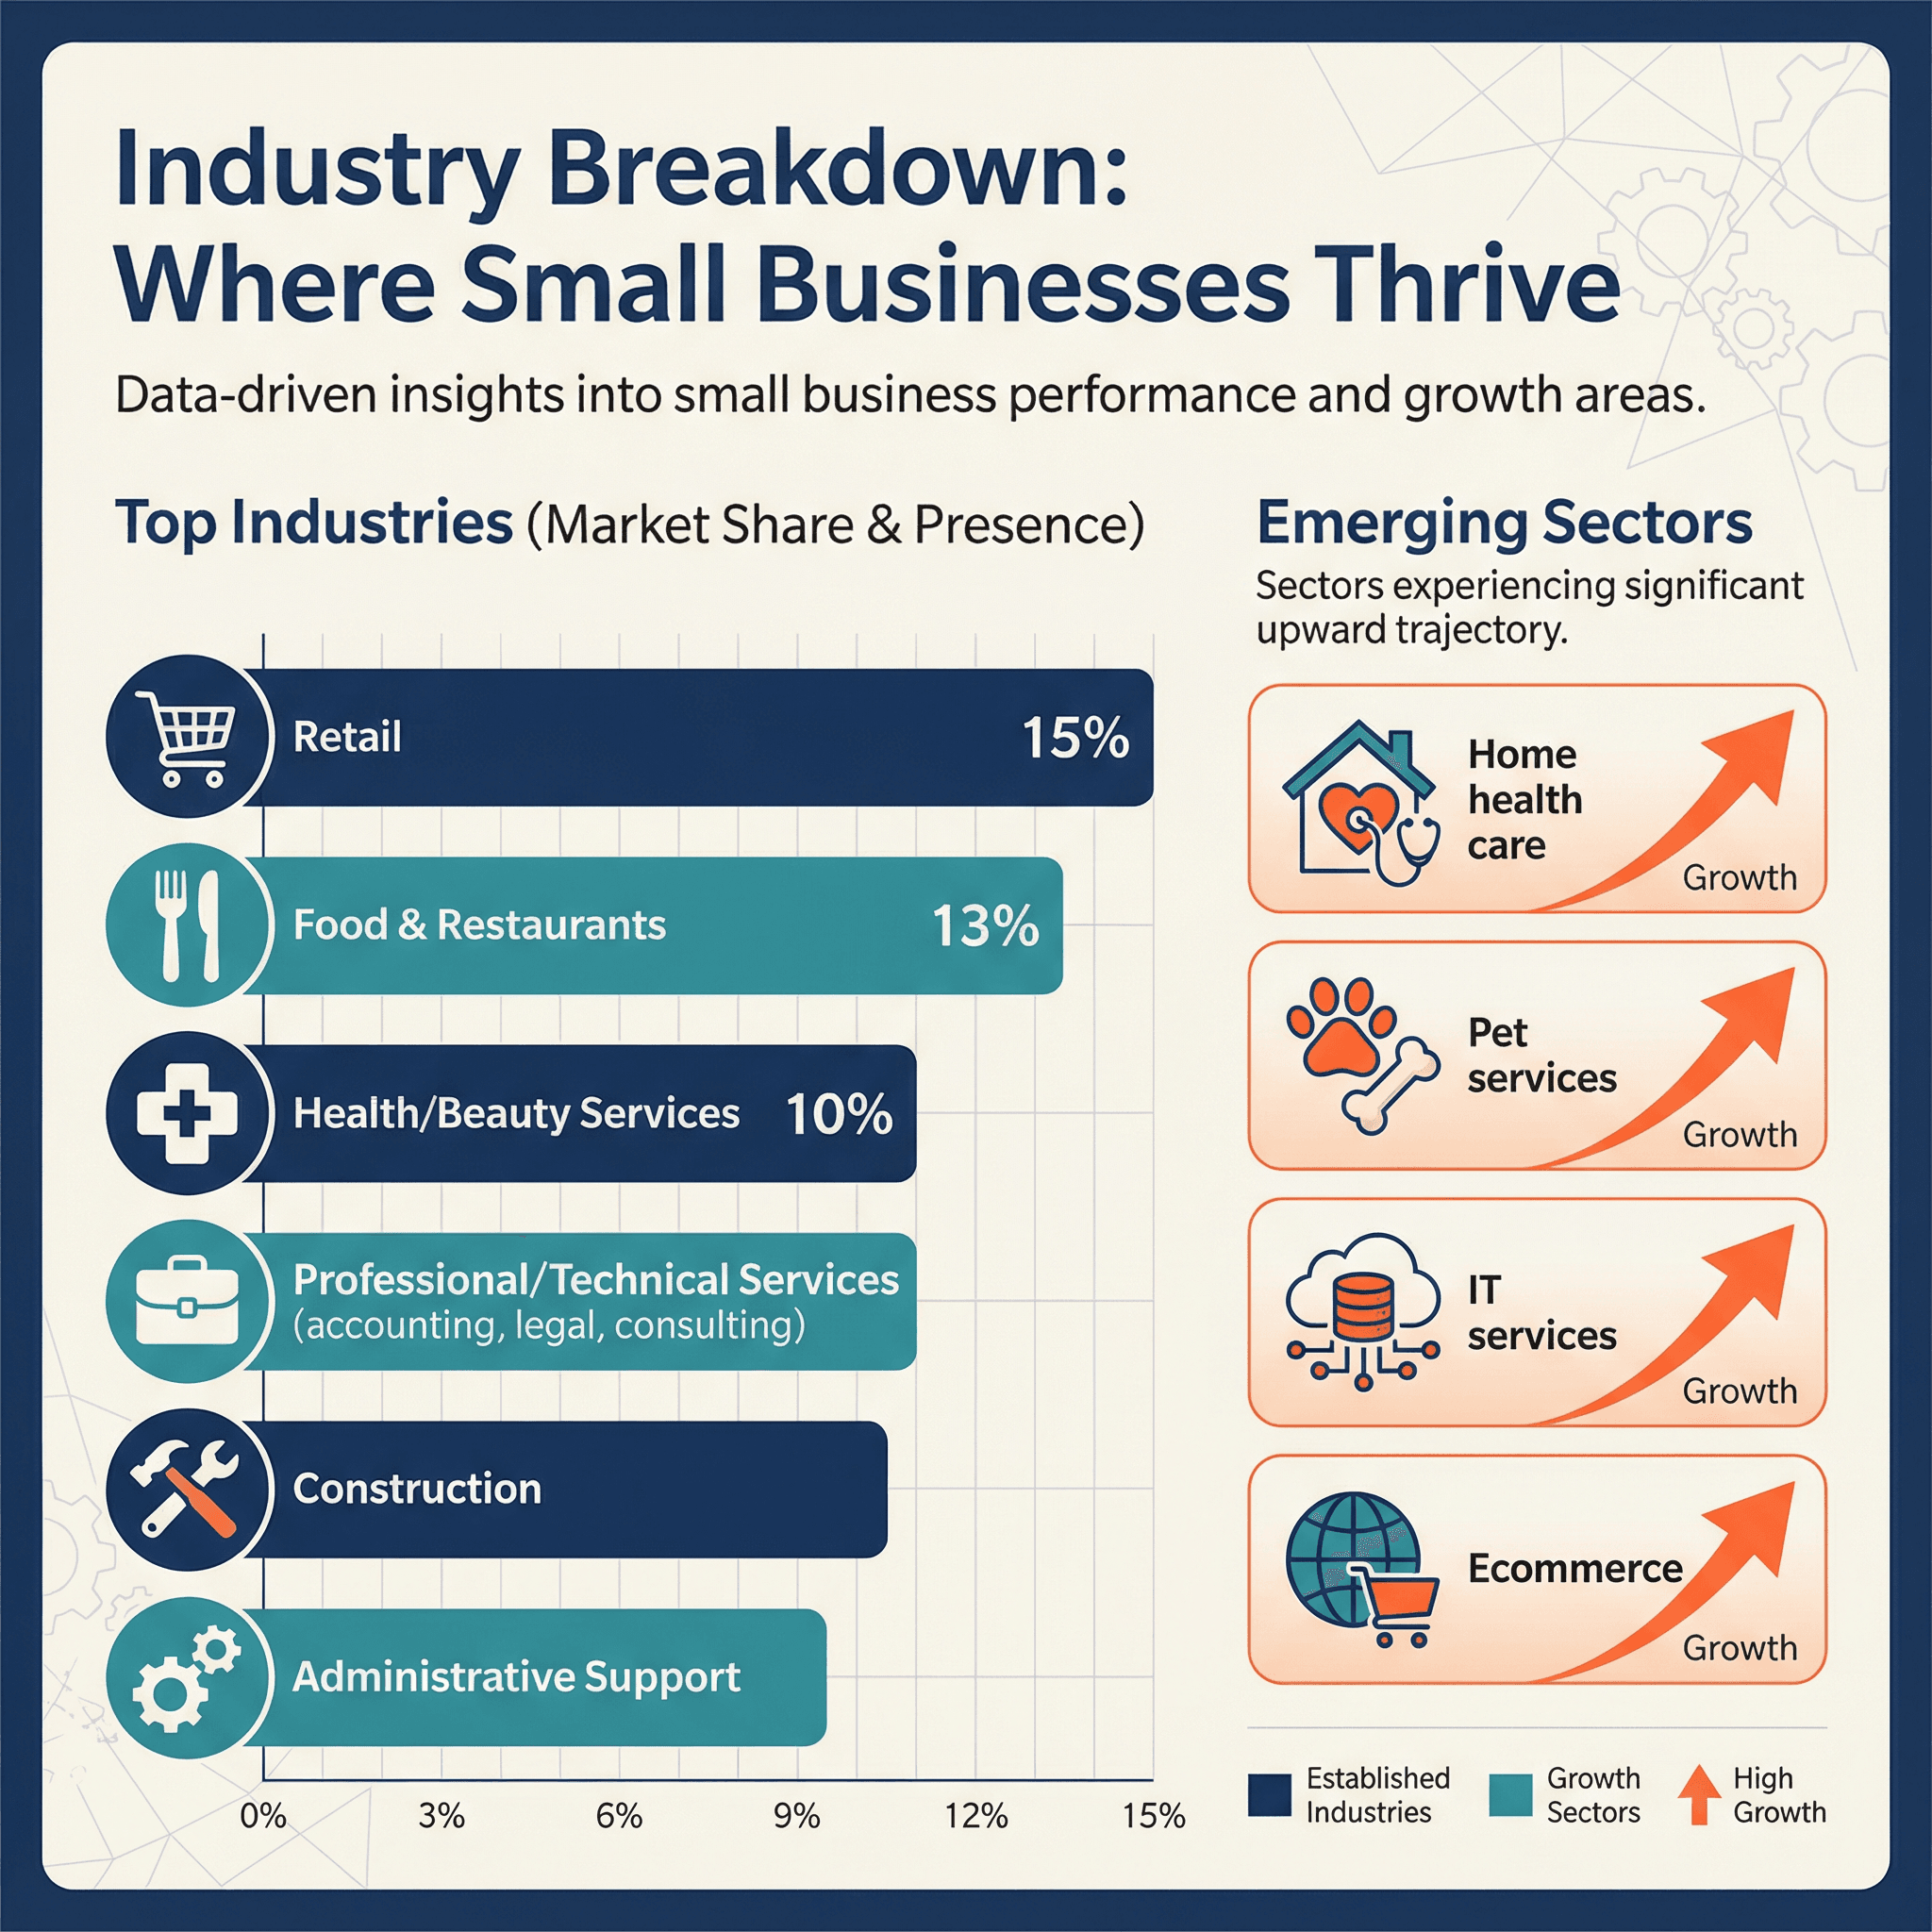
- Retail: 15% of small firms
- Food & Restaurants: 13%
- Health/Beauty Services: 10%
- Professional/Technical Services: Accounting, legal, consulting
- Construction and administrative support are also major categories
Recent years have seen surges in home health care, pet services, IT, and—no surprise—ecommerce. In developing countries, small businesses dominate agriculture and crafts, while in advanced economies, services and tech startups are leading the charge.
Small Business and Ecommerce: Online Presence and Sales Trends
The digital storefront is now just as important as the physical one:
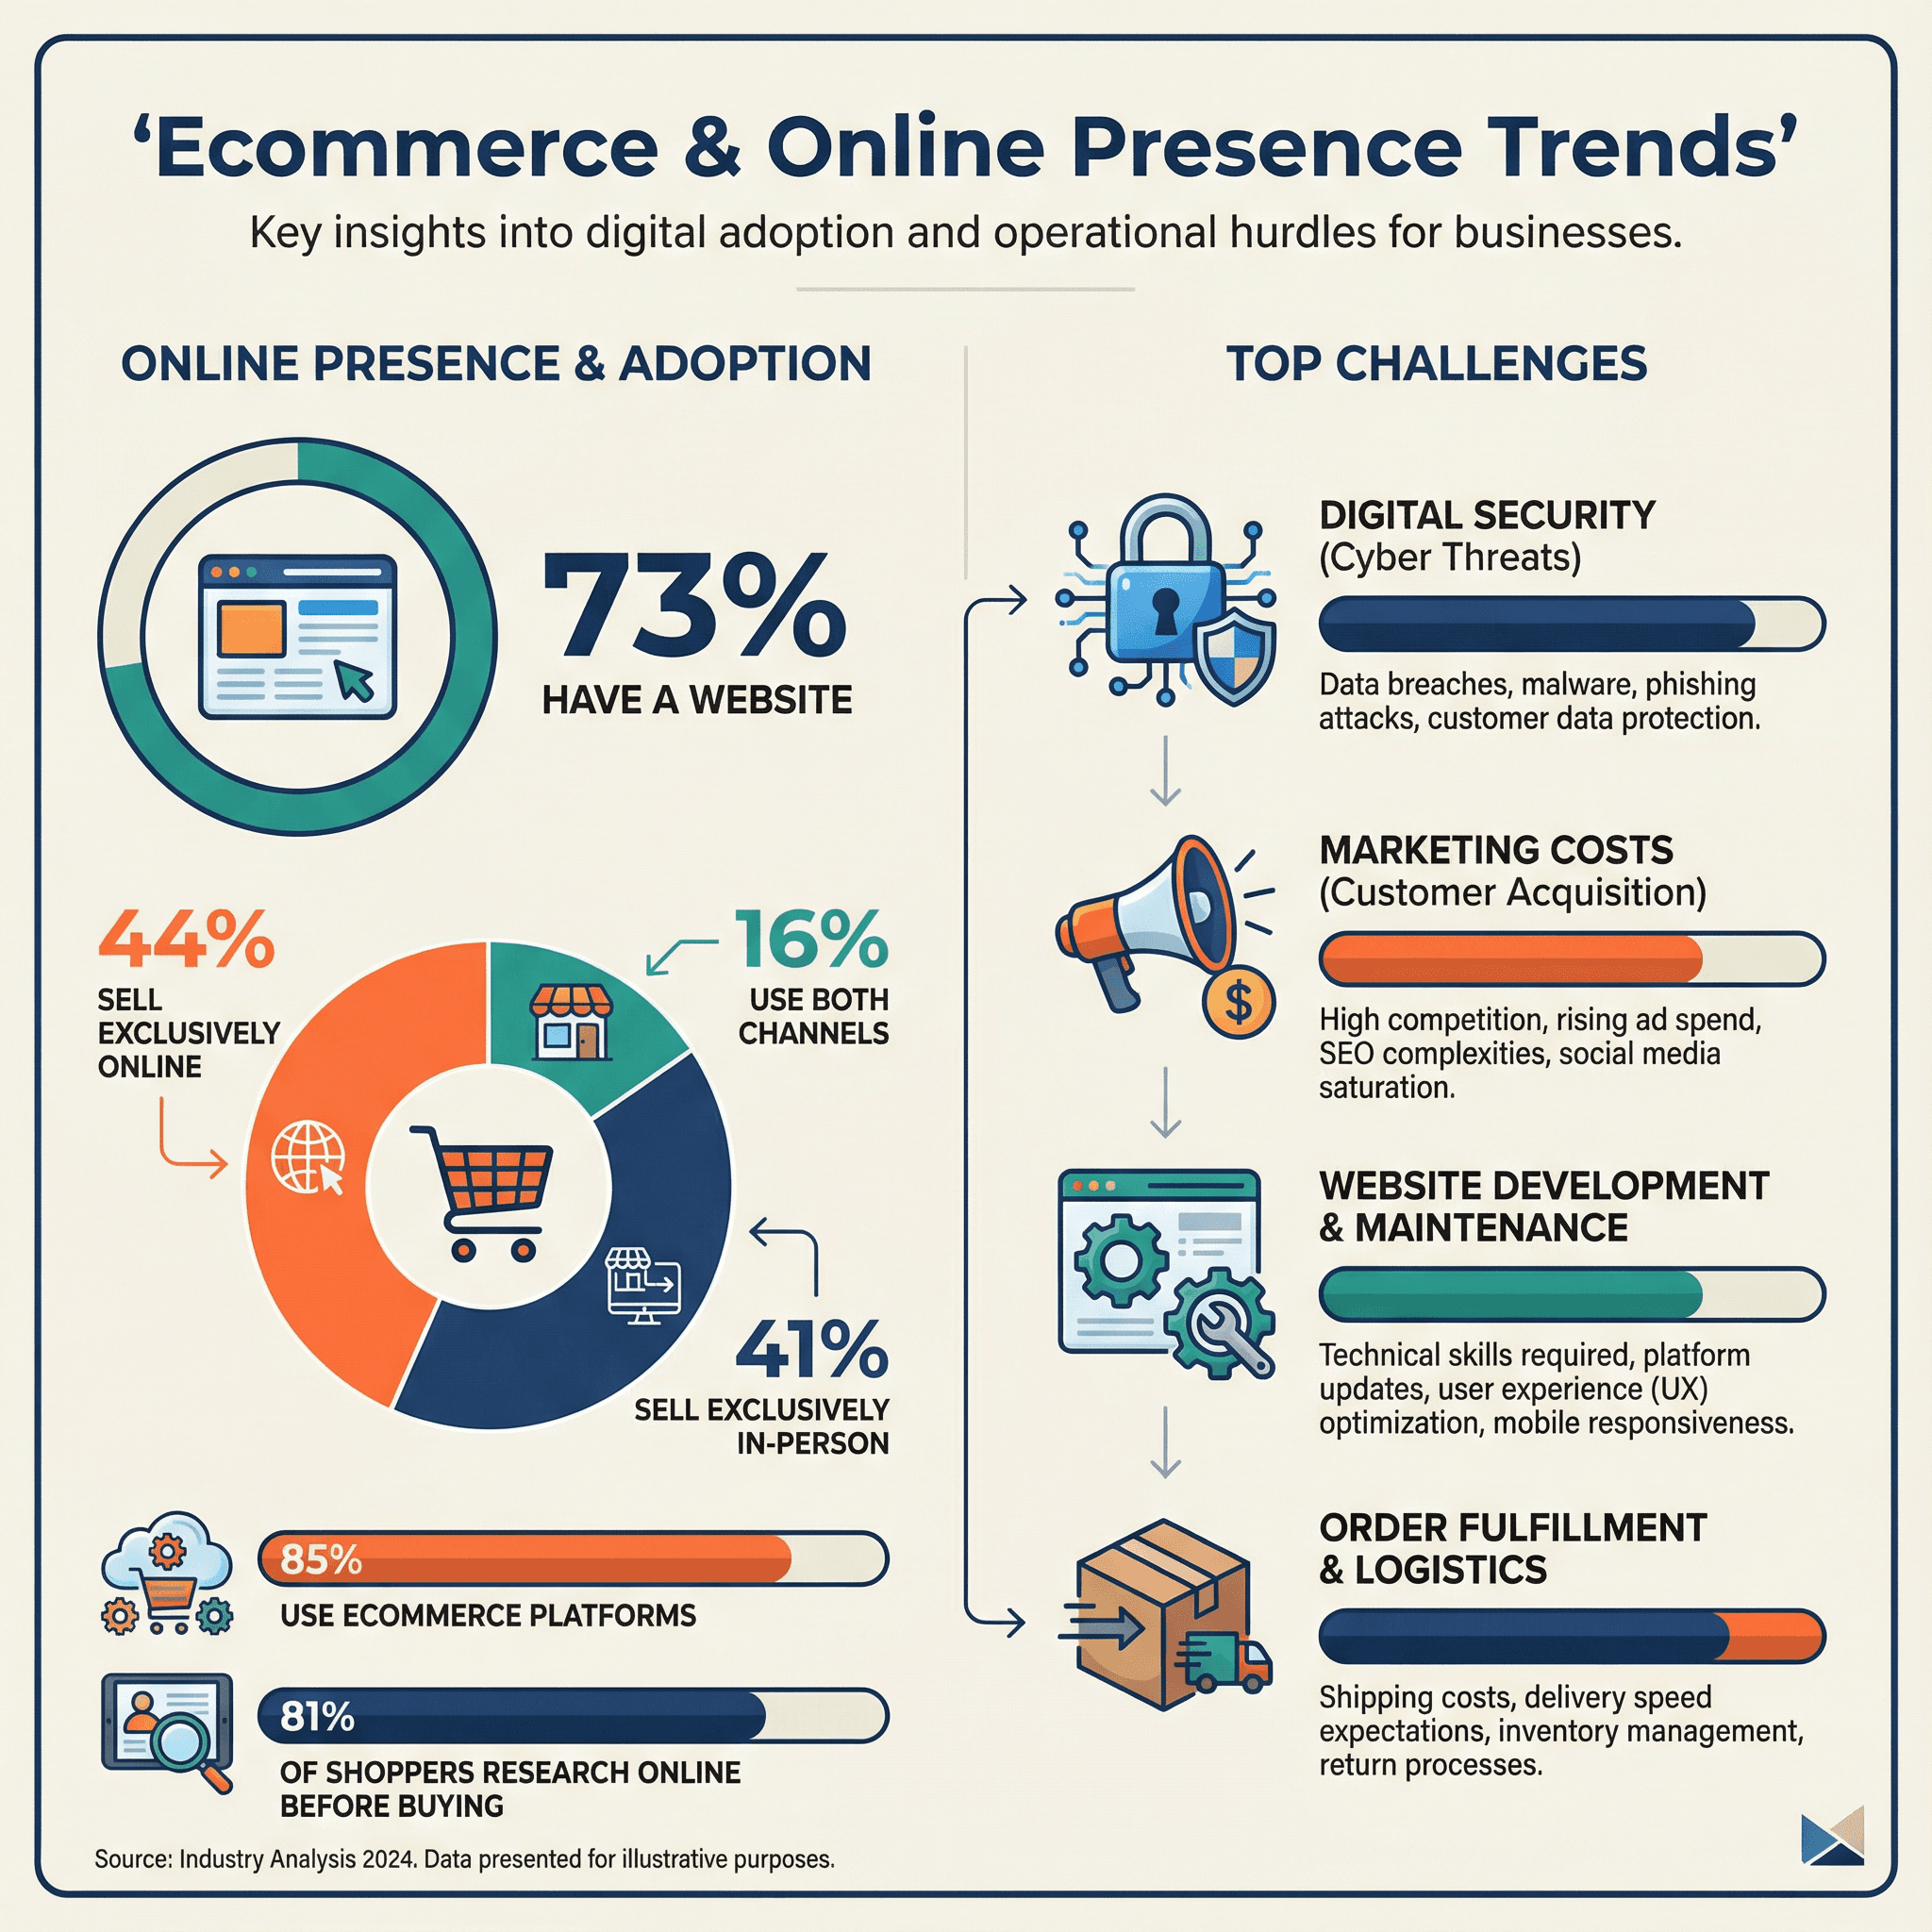
- 73% of small businesses have a website ().
- 44% sell exclusively online, 16% exclusively in-person, and 41% use both ().
- 85% of online sellers use an ecommerce platform (Shopify, Wix, Amazon, etc.) ().
Ecommerce Adoption and Challenges
Top challenges for online sellers:
- Digital security (cyber threats to websites and payments)
- Marketing costs (customer acquisition is competitive)
- Website development and maintenance
- Order fulfillment and logistics ()
With 81% of shoppers researching online before buying (), digital marketing is now table stakes. Social media is the go-to channel for most small businesses, thanks to its reach and cost-effectiveness.
Small Business Resilience: Challenges, Risks, and Success Factors
Running a small business isn’t for the faint of heart. Here’s what keeps owners up at night:
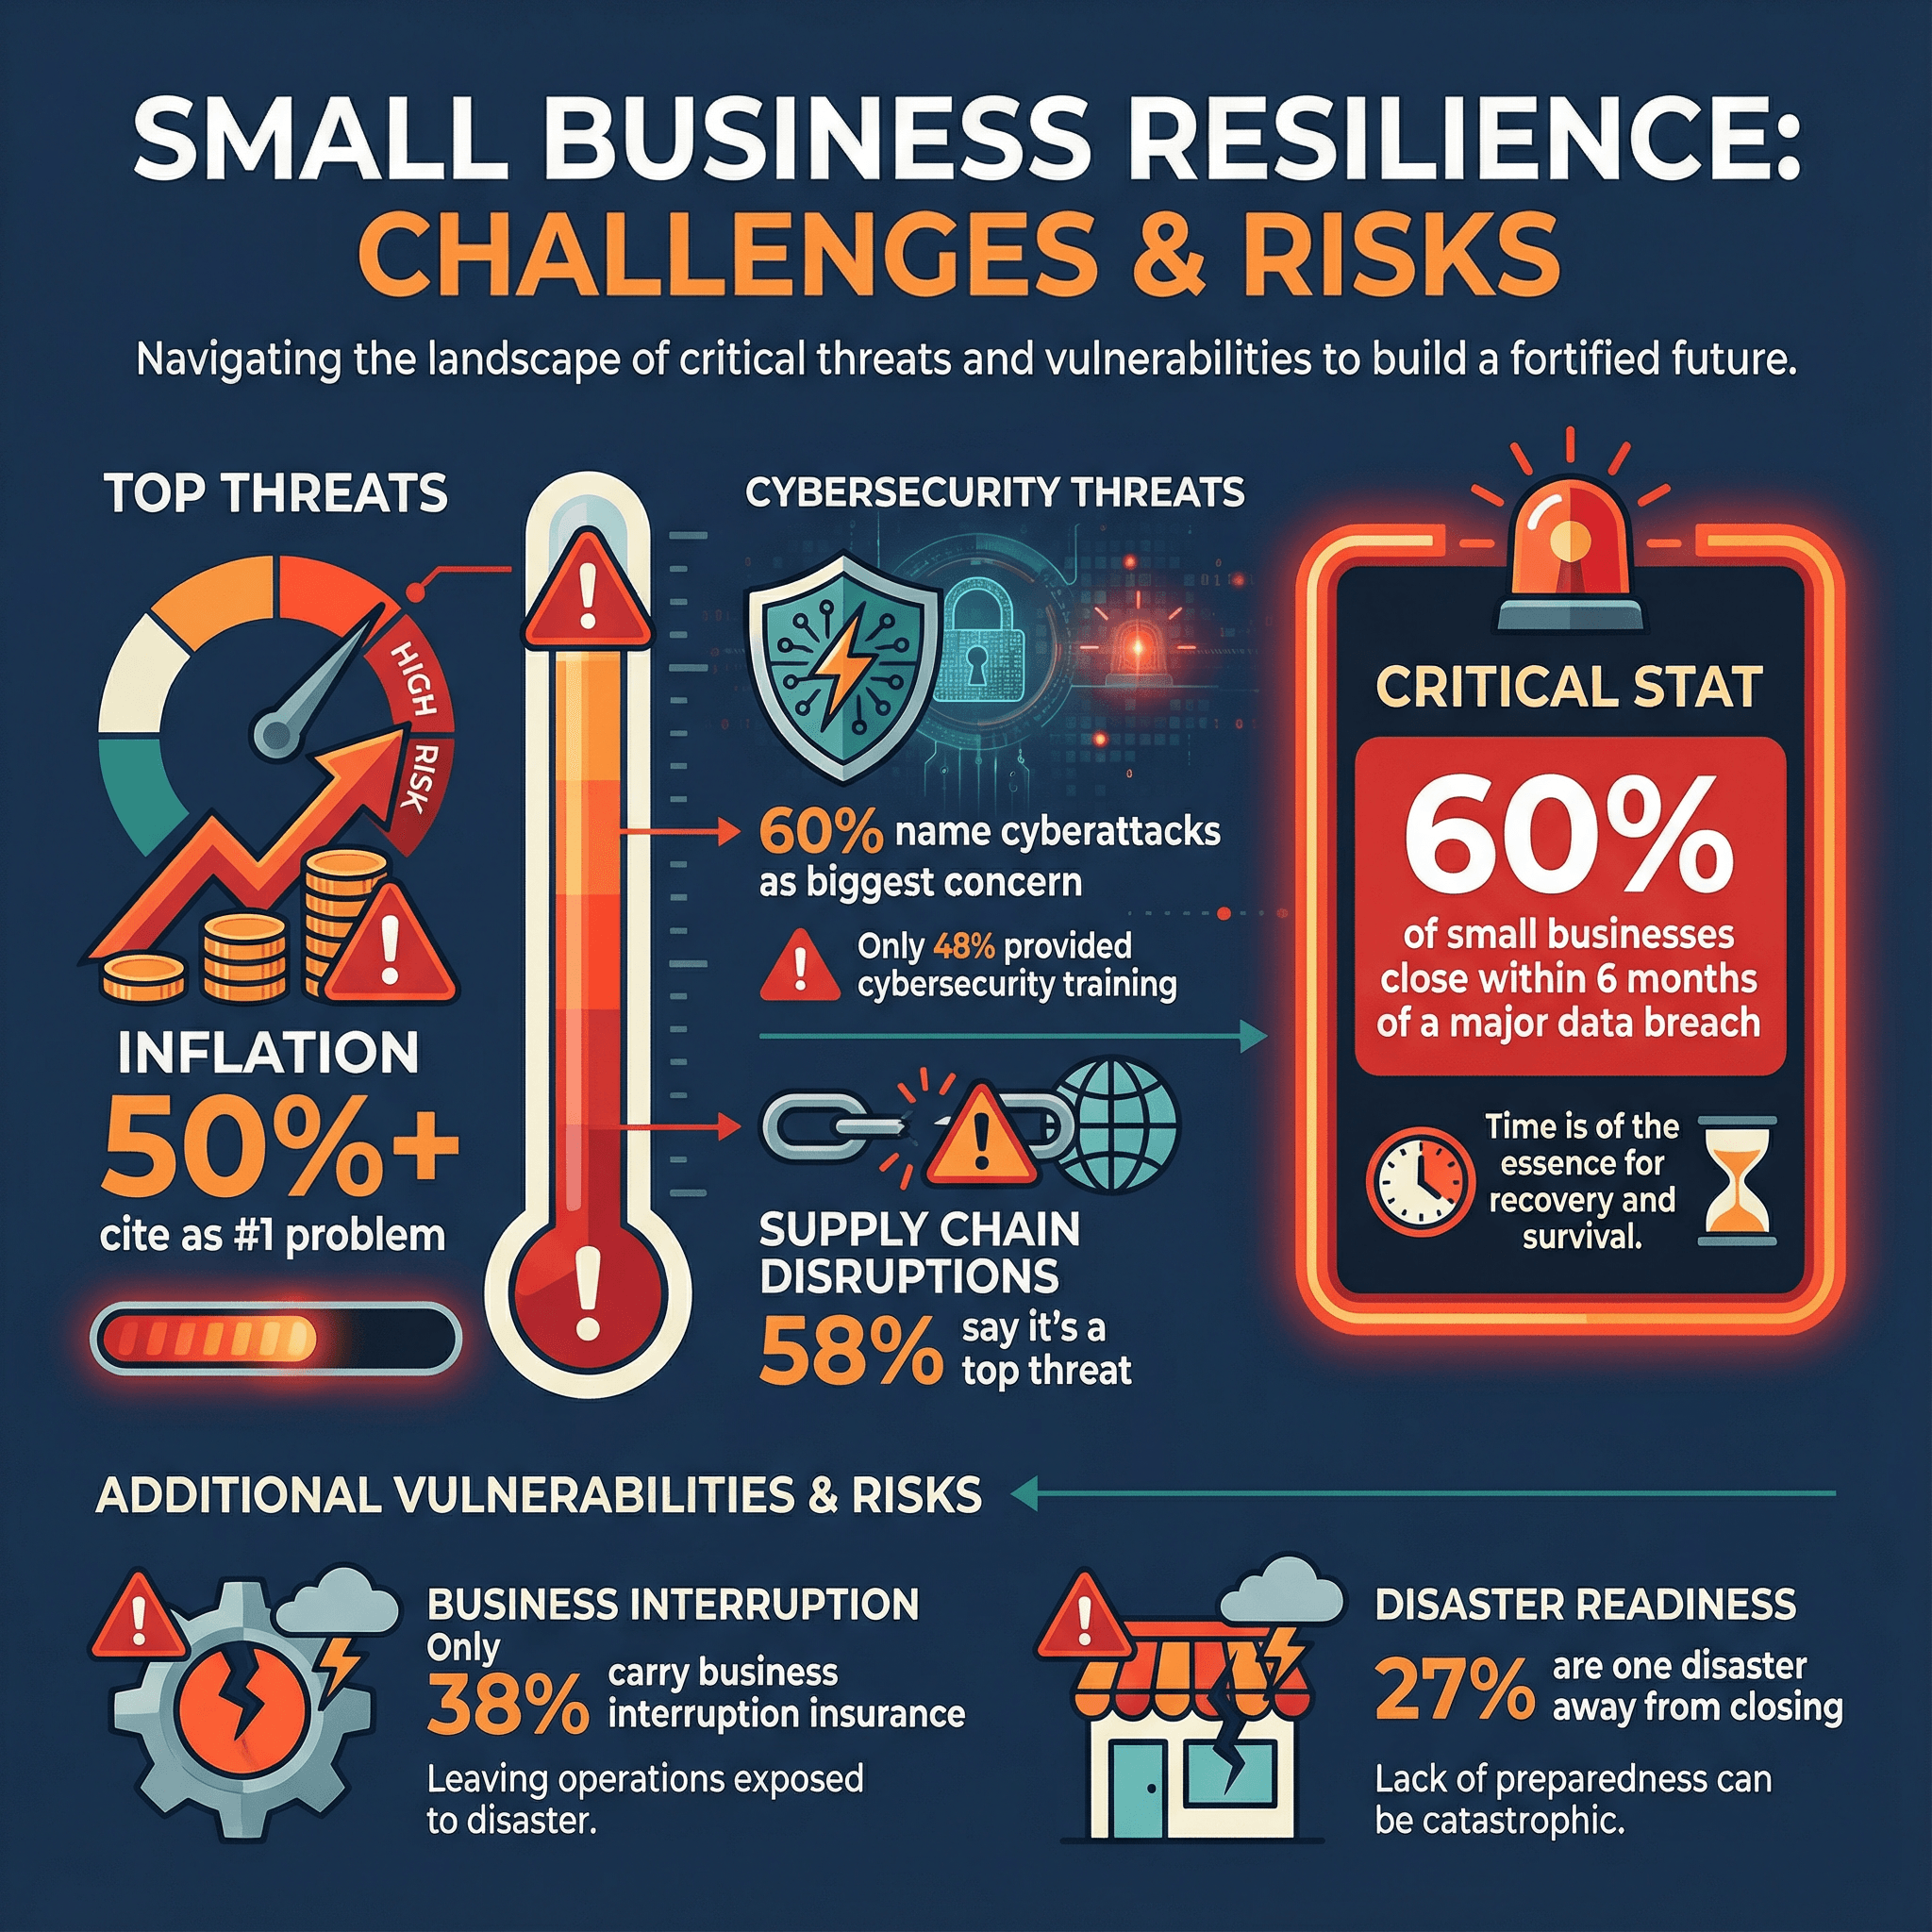
- Inflation: Over 50% cite it as their #1 problem ().
- Supply chain disruptions: 58% say it’s a top threat.
- Cybersecurity: 60% name cyberattacks as their biggest concern, but only 48% have provided cybersecurity training ().
- Insurance and disaster planning: Only 38% carry business interruption or disaster insurance.
- Natural disasters: 27% say they’re one disaster away from closing.
A sobering stat: 60% of small businesses go out of business within 6 months of a major data breach (). That’s why risk management, continuity planning, and digital security are more than nice-to-haves—they’re survival essentials.
Regional and Global Small Business Statistics
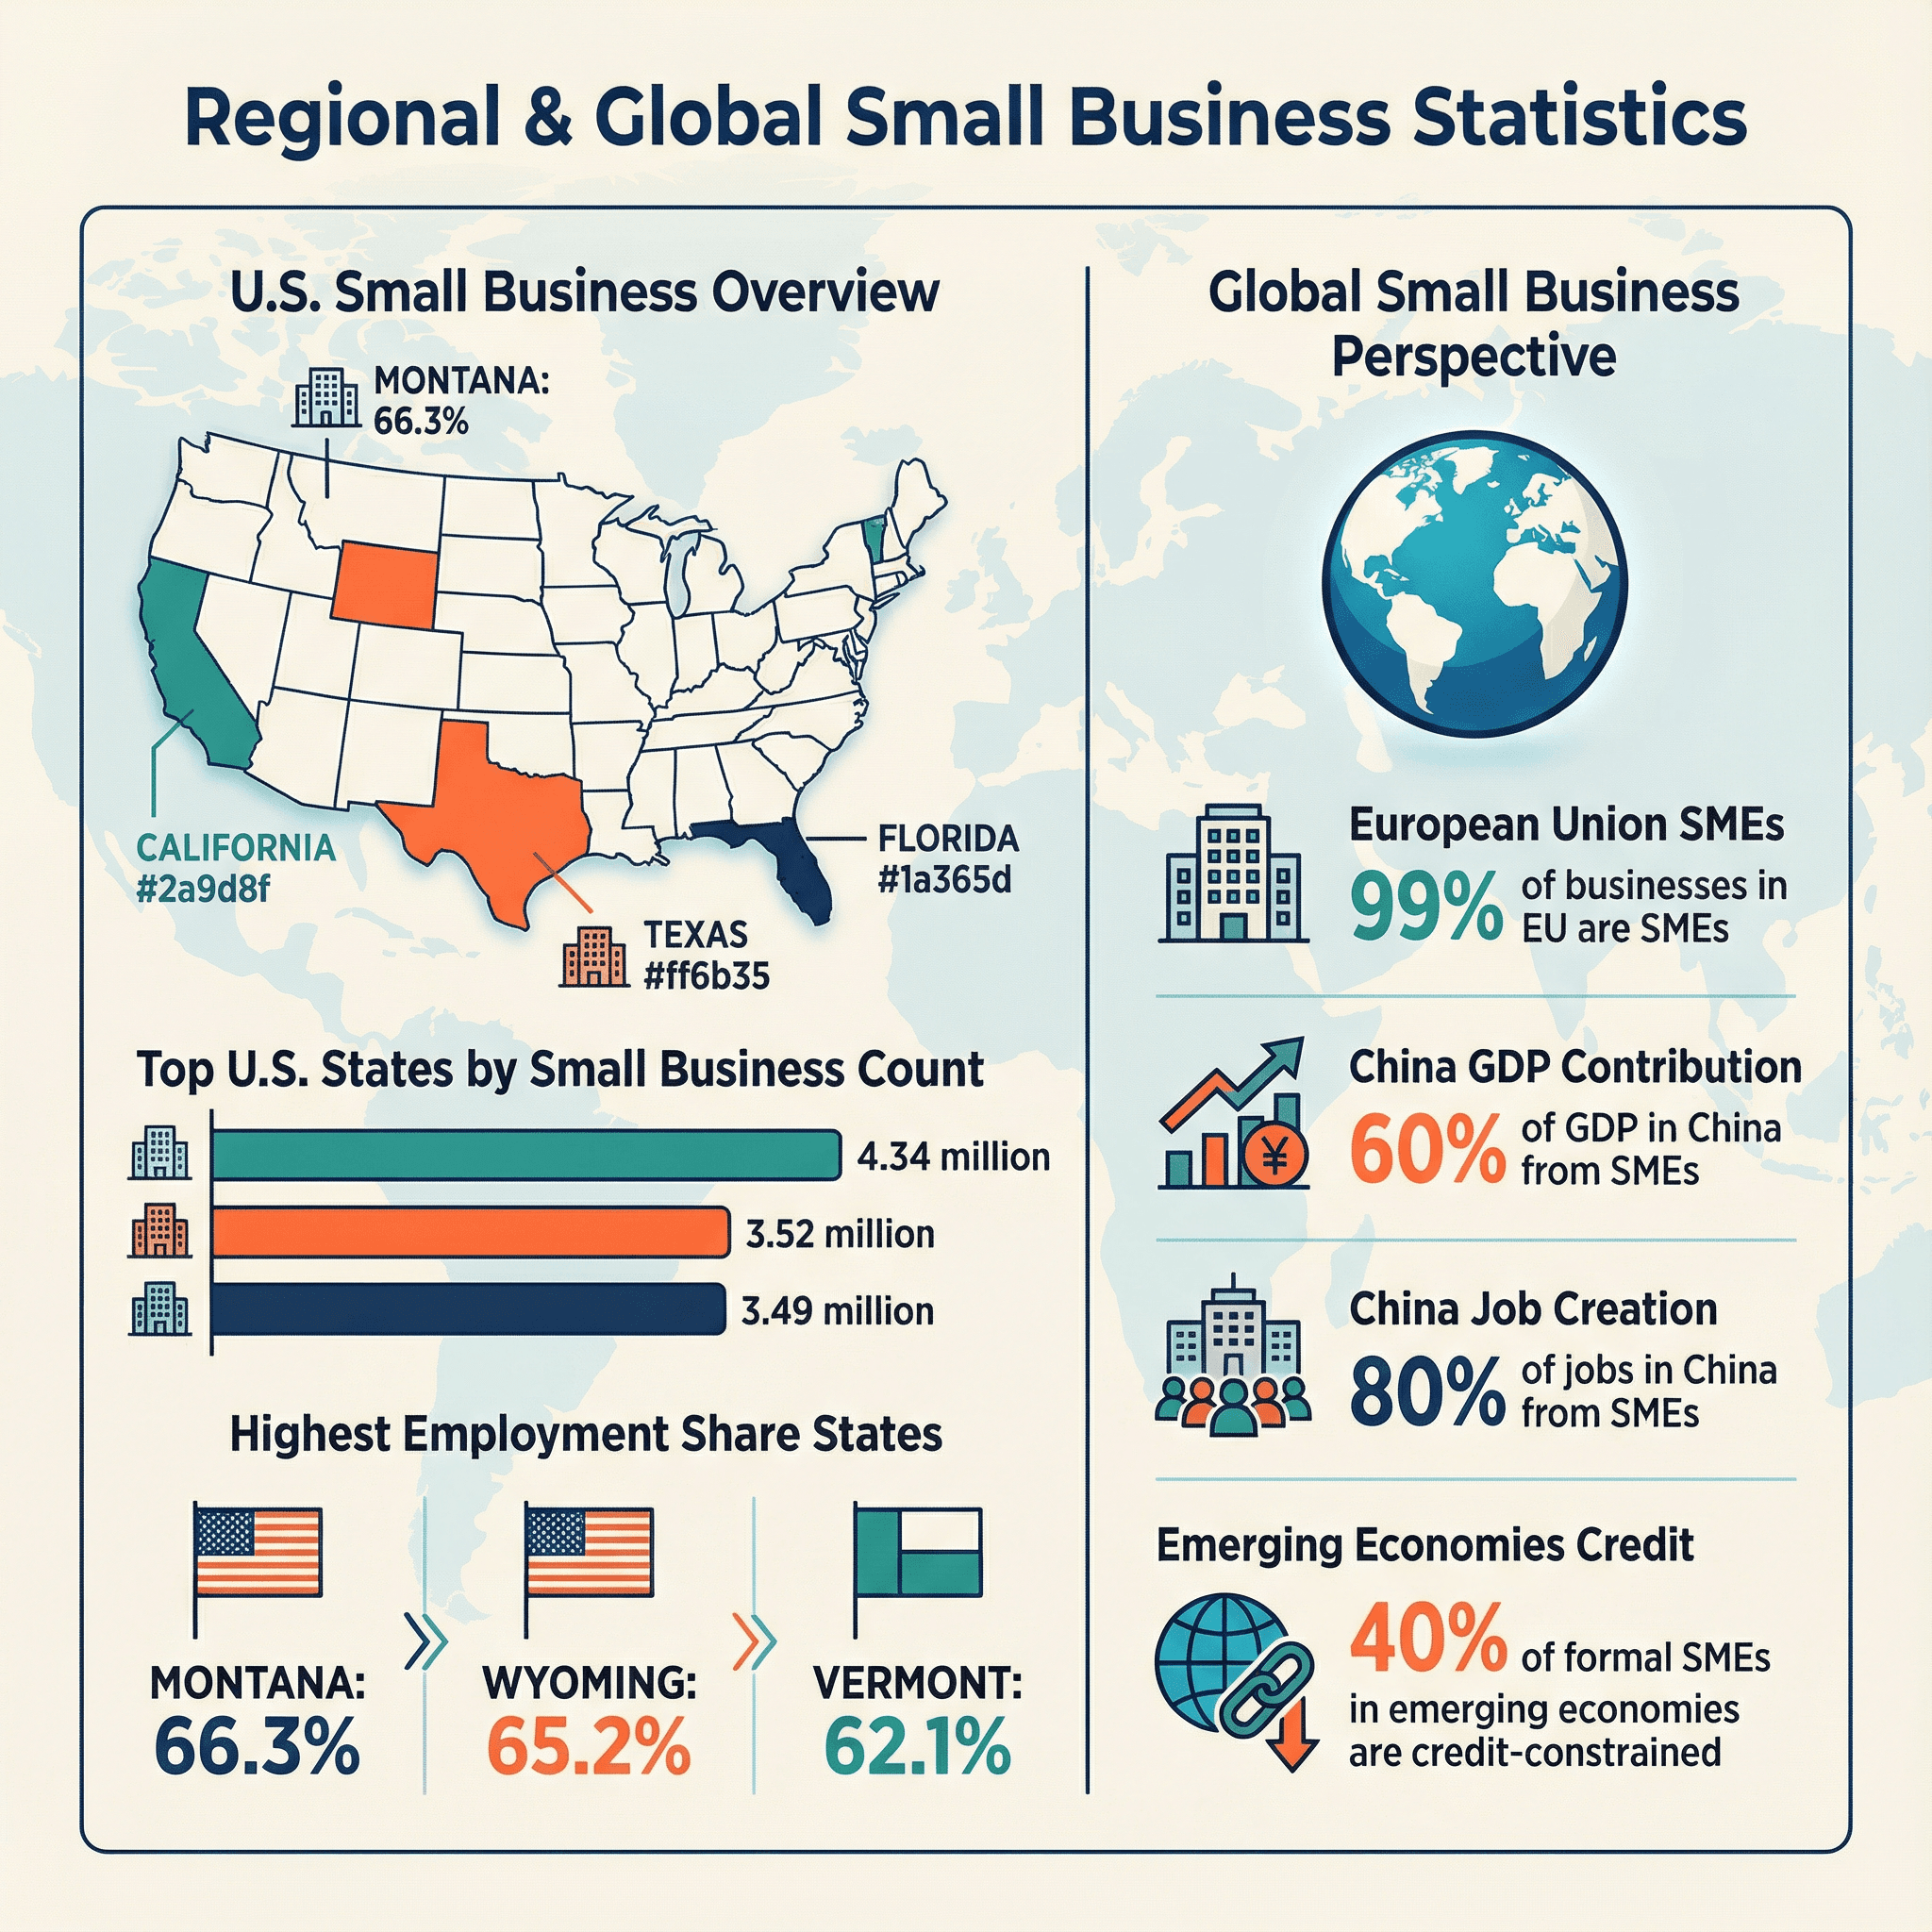
The U.S. is a patchwork of small business ecosystems:
- California: 4.34 million small businesses
- Texas: 3.52 million
- Florida: 3.49 million ()
States like Montana (66.3%), Wyoming (65.2%), and Vermont (62.1%) have the highest share of employment in small businesses, thanks to fewer large corporations.
Globally, SMEs account for 99% of businesses in the EU (), 60% of GDP and 80% of jobs in China, and dominate employment in India and emerging markets (). Access to finance is a bigger challenge outside the U.S.—40% of formal small firms in emerging economies are credit-constrained.
Key Takeaways for Small Business Stakeholders
After sifting through all these numbers, here’s what stands out to me—and what I think every entrepreneur, policymaker, and support organization should keep in mind:
- Small businesses are everywhere: They make up 99.9% of firms and employ nearly half of all workers. Their health is the economy’s health.
- Entrepreneurship is booming: The surge in new business applications is real and sustained.
- Diversity is rising: Minority and women ownership is growing, but funding gaps remain.
- Hiring is tough: Talent shortages are a top pain point—creative recruitment and training are musts.
- Digital is non-negotiable: Ecommerce, AI, and automation are now mainstream for small businesses.
- Risks are real: Inflation, cyber threats, and disasters can sink a business—resilience planning is critical.
- Policy matters: Access to credit, streamlined regulations, and infrastructure investments can make or break small business growth.
For founders, the message is clear: embrace technology, plan for risks, and build your network. For policymakers, focus on access to capital, workforce development, and digital infrastructure. For everyone else—maybe give your local small business a little extra love (and maybe a five-star review).
Sources and Further Reading
Want to dig deeper? Here are the key sources behind these stats—perfect for citation, research, or just satisfying your inner data nerd:
For more insights on digital transformation, automation, and how AI tools like are helping small businesses save time and scale smarter, check out the . And if you’re curious about scraping data for market research, competitor analysis, or lead generation, you might enjoy our deep dives on and .