If you've ever sat in a meeting where someone asked, "Should we double down on Shopify or focus more on Amazon?"—you know how heated (and confusing) the debate can get. In 2026, the stakes are higher than ever. Ecommerce is booming, but the rules of the game are changing fast. As someone who's spent years building automation and analytics tools for sales and operations teams, I've seen firsthand how the right data can turn a hunch into a winning strategy—and how the wrong data can send you chasing your tail.
So, let's cut through the noise. I've pulled together the latest, most credible statistics and market insights to help you compare Shopify and Amazon seller data in 2026. Whether you're a founder, a sales lead, or just the "data person" everyone turns to, this guide will arm you with the numbers, context, and practical takeaways you need to make smart, data-driven decisions. And yes, I'll show you how tools like Thunderbit can help you go beyond the dashboards and see the whole playing field.
Try Thunderbit for Cross-Platform Data Analysis
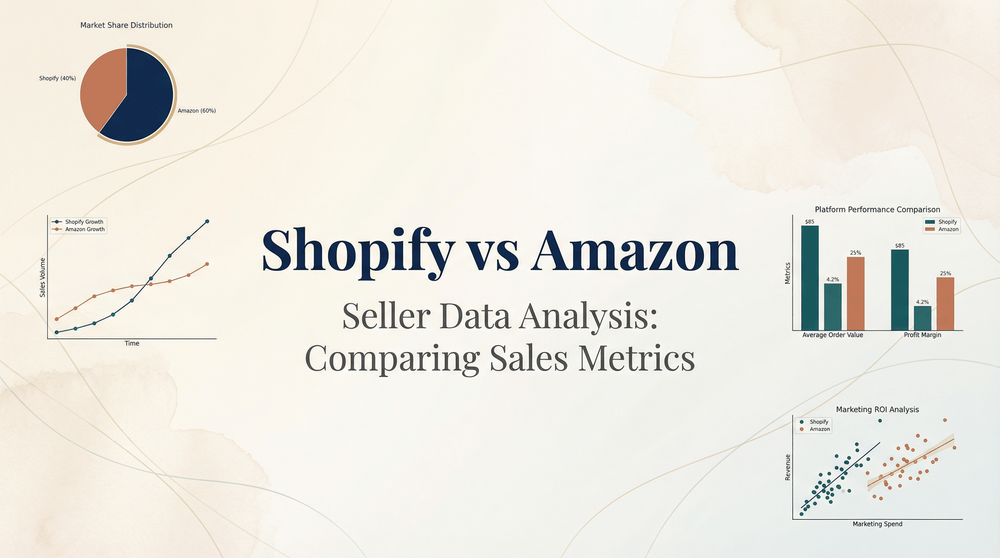
Shopify vs Amazon Seller Data: 2026 Top Statistics at a Glance
Let's start with the headline numbers. If you're looking for quick stats to drop in your next team meeting (or just want to impress your boss), here are the most important Shopify vs Amazon seller data points for 2026:
- Global retail ecommerce sales will reach $6.88 trillion in 2026, up 7.2% YoY.
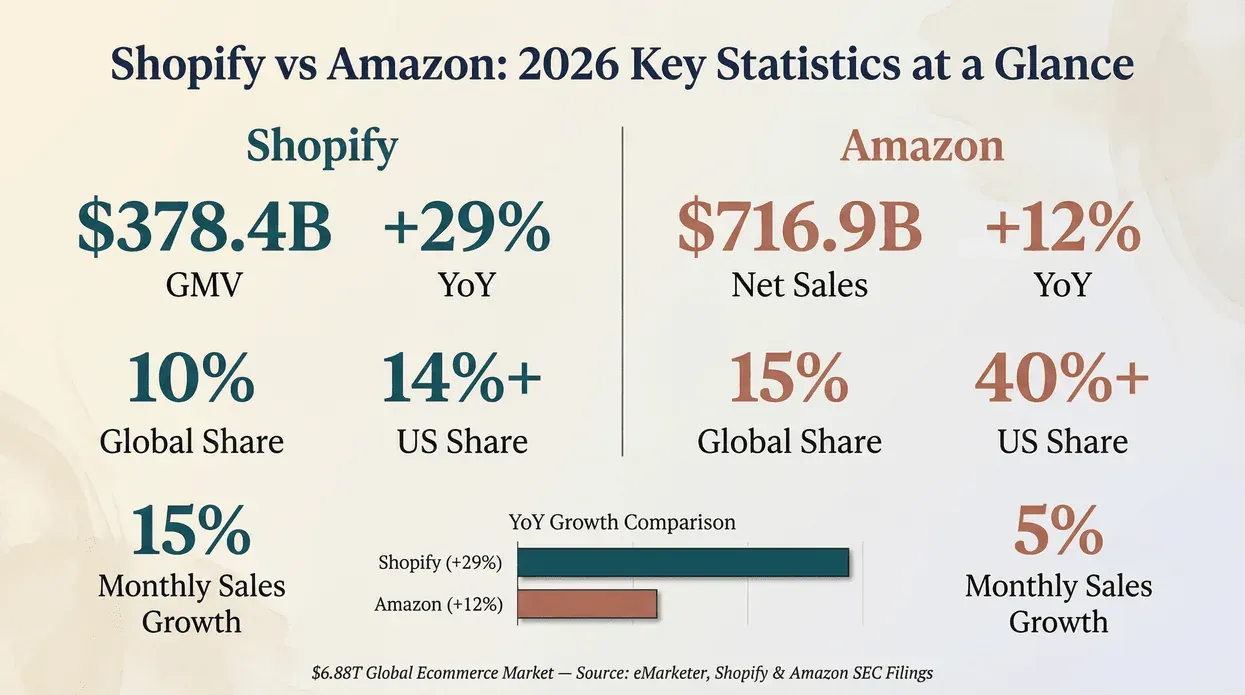
- Shopify's 2025 Gross Merchandise Volume (GMV) hit $378.4B, up 29% YoY. Q1 2026 added another $100.7B in a single quarter, with revenue up 34% YoY to $3.17B — the first time Shopify cleared $100B GMV in one quarter.
- Amazon's 2025 net sales reached $716.9B, up 12% YoY. Q1 2026 net sales rose 17% to $181.5B, an acceleration from the FY2025 pace.
- Shopify's estimated global market share is now 10%, with US share above 14%. Amazon's global share is 15%, but its growth rate is slowing.
- Shopify sellers saw an average monthly sales growth rate of 15% in 2026, compared to Amazon sellers' 5%.
- Repeat purchase rate: Shopify stores average 28–35%, while Amazon's is closer to 20%.
- Average monthly sales per Amazon SMB seller: $11,671; Shopify GMV per store ranges from $4.5K–$11.3K/month depending on store count estimate.
- Amazon seller profit margins: 57% report >10%, 28% report >20%. Shopify profit margins vary widely by business model.
- Shopify Analytics offers deep, store-level data; Amazon Seller Central focuses on inventory and sales performance. Thunderbit enables cross-platform data analysis and competitive monitoring.
- Amazon's FBA fees will increase by an average of $0.08 per unit in 2026; Shopify's card rates start at 2.9% + $0.30 per transaction.
That's a lot of numbers, but they tell a story: Shopify is growing faster, Amazon is still the giant, and both platforms require a sharp eye on data to win.
Shopify vs Amazon Sales Growth Trends: 2026 Data
Let's dig into the growth numbers. If you're betting your business on a platform, you want to know: where is the momentum?
Shopify's Growth Engine
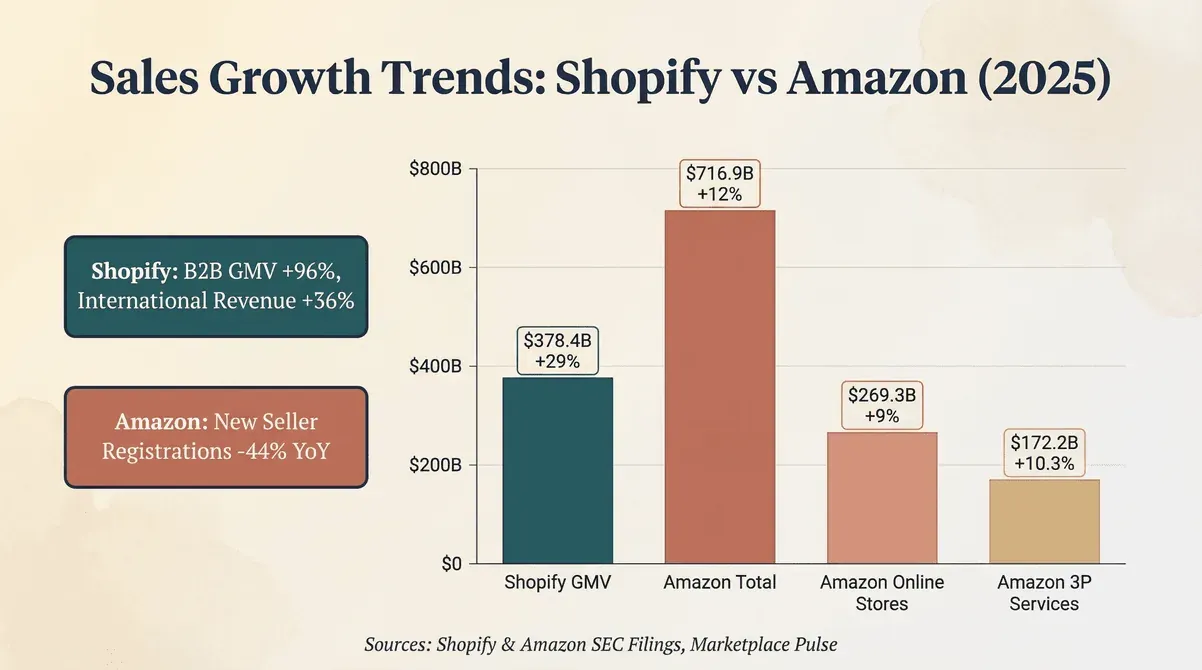
Shopify's 2025 GMV soared to $378.4 billion, up 29% year-over-year. That's not just a blip—it's a sign of sustained, global expansion. Revenue grew even faster, up 30% YoY, with international revenue up 36%. B2B GMV nearly doubled (96% growth), showing Shopify's reach beyond just DTC brands.
Momentum carried into 2026. In Q1 2026, Shopify merchants cleared $100.7 billion in GMV in a single quarter (up 35% YoY, 30% on a constant-currency basis), revenue rose 34% to $3.17 billion, and B2B GMV grew 80% year over year. Shop Pay processed $35 billion of GMV (+59% YoY), with non-US Shop Pay growth above 70% — a sign Shopify's international flywheel is still spinning up, not coasting.
What's fueling this? A few things stand out:
- Personalized store control: Shopify lets brands own their customer experience, which is huge for loyalty and retention.
- Global reach: Shopify merchants now span 175+ countries, with 44% in the US, 31% in EMEA, and 16% in APAC (SEC filing).
- Flexible ecosystem: App integrations, payments, and analytics are all getting more sophisticated.
Amazon's Steady, But Slower, Climb
Amazon's 2025 net sales reached $716.9 billion, up 12% YoY. "Online stores" sales grew 9%, and "third-party seller services" (the backbone for most SMBs) grew 10.3%. Amazon is still the biggest player, but its growth rate is less than half of Shopify's.
What's slowing Amazon down?
- Marketplace saturation: More competition, tougher ad economics, and fee increases.
- Seller registration slowdown: Only ~165,000 new sellers registered in 2025, down 44% from 2024 (Marketplace Pulse).
- Rising costs: FBA fees are up, and ad spend is eating into margins.
Visualizing the Growth
Here's a quick comparison:
| Platform | FY 2025 Sales/GMV | FY 2025 YoY | Q1 2026 YoY | Notable Trends |
|---|---|---|---|---|
| Shopify (GMV) | $378.4B | +29% | +35% ($100.7B in Q1 alone) | International, B2B (+80% in Q1), DTC, ecosystem flexibility |
| Amazon (total net sales) | $716.9B | +12% | +17% ($181.5B in Q1) | Reaccelerated in Q1 2026, led by AWS (+28%) and ads |
| Amazon (online stores) | $269.3B | +9% | +5% (ex-FX, Q1 2026: $64.3B) | Slower than 3P |
| Amazon (3P seller services) | $172.2B | +10.3% | +12% ex-FX ($41.6B in Q1) | 3P resilient, growth picking back up |
Bottom line: Shopify is still the faster grower (+35% Q1 GMV vs Amazon's +17% net sales). Amazon is the volume leader and — based on Q1 2026 — not cooling so much as concentrating: fewer new sellers, but bigger ones taking more share.
Buyer Behavior Comparison: Shopify and Amazon in 2026
Now, let's talk about what really matters: the people buying your stuff. Are Shopify or Amazon shoppers more loyal? Who spends more? Where do you build a real brand?
Shopify: The Loyalty Machine
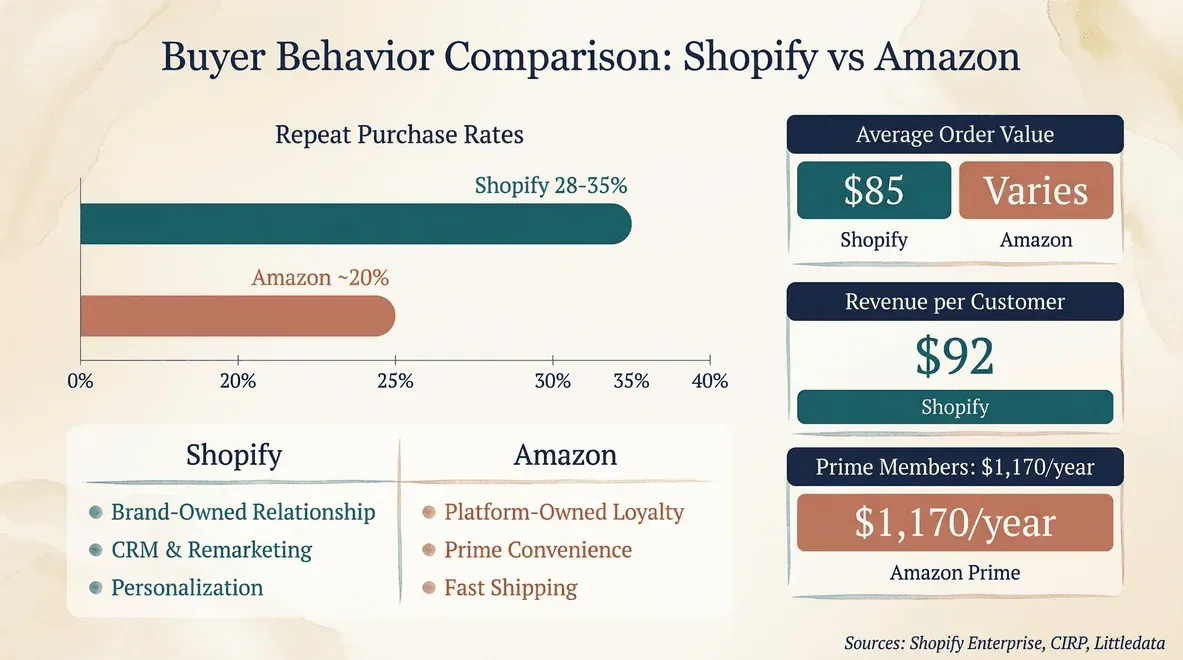
Shopify merchants enjoy a big advantage in customer retention. The average repeat customer rate is 28.2%, with top performers hitting 35% or higher. That means more than a quarter of customers come back for a second (or third, or tenth) purchase.
Why is this so high?
- Brand experience: Shopify stores control their own look, feel, and messaging. Customers remember where they bought.
- CRM and remarketing: Shopify's ecosystem makes it easy to run email, SMS, and loyalty programs.
- Personalization: Brands can tailor offers, bundles, and post-purchase experiences.
Average order value (AOV) for Shopify stores is around $85, with revenue per customer at $92.
Amazon: The Convenience King
Amazon's repeat purchase story is a bit different. Loyalty is to the platform, not the brand. Prime members spend $1,170/year and order about twice per month—double the rate of non-Prime shoppers. But they're loyal to Amazon, not necessarily to your storefront.
- Repeat purchase rate for individual sellers is closer to 20%.
- Average order value varies widely, but Amazon's scale means more frequent, smaller purchases.
The challenge? It's tough to build a direct relationship with your customer. Amazon owns the data, the communication, and the discovery.
Buyer Behavior at a Glance
| Metric | Shopify | Amazon |
|---|---|---|
| Repeat purchase rate | 28–35% | ~20% |
| Average order value | $85 | Varies (often lower, but higher frequency) |
| Customer relationship | Brand-owned | Platform-owned |
| Loyalty drivers | Experience, CRM, personalization | Prime, convenience, fast shipping |
Key takeaway: If you want to build a loyal customer base and maximize lifetime value, Shopify gives you the tools. If you want to tap into a massive pool of impulse buyers, Amazon is still king.
Seller Analytics Tools: Shopify Analytics vs Amazon Seller Central vs Thunderbit
Let's get nerdy for a second—because analytics is where the real edge happens.
Shopify Analytics
Shopify's built-in analytics are all about giving you a 360° view of your store:
- Sales trends: Track GMV, revenue, and conversion rates over time.
- Customer insights: See repeat purchase rates, cohort analysis, and customer lifetime value.
- Custom reports: Use ShopifyQL to dig deep into your own data, segment by product, region, or campaign.
- Visualization: Dashboards, charts, and export options for further analysis.
Shopify's analytics are especially strong for DTC brands that want to optimize for retention, AOV, and personalized marketing.
Amazon Seller Central
Amazon's Seller Central is focused on operational performance:
- Sales and traffic reports: See units sold, page views, and conversion rates.
- Inventory management: Track stock levels, FBA shipments, and restock alerts.
- Brand Analytics: For registered brands, get insights into top search terms, funnel performance, and competitor benchmarks.
- CSV exports: Download raw data for your own analysis.
Amazon's analytics are great for managing inventory and tracking performance, but less flexible for deep customer insights or cross-channel analysis.
Thunderbit: The Cross-Platform Game Changer
Here's where I get excited. Thunderbit is an AI-powered web scraper that lets you collect, unify, and analyze data from both Shopify and Amazon (and beyond):
- AI field suggestions: Just describe what you want ("scrape all product prices and reviews from these Shopify stores and Amazon listings"), and Thunderbit figures out the rest.
- Subpage scraping: Automatically visit product detail pages, review sections, or competitor listings and enrich your dataset.
- Export anywhere: Push data directly to Google Sheets, Airtable, Notion, or Excel.
- Scheduled scraping: Set up recurring jobs to monitor competitor prices, stock, or new product launches.
- Unified view: Combine Shopify and Amazon data into a single table for apples-to-apples comparison.
Thunderbit is especially useful for sales and operations teams who want to go beyond the built-in dashboards and see the whole market—not just their own store.
Pro tip: If you want to see Thunderbit in action, check out our YouTube channel for walkthroughs.
Market Share Shifts: Shopify and Amazon in the Global Ecommerce Landscape (2026)
Who's winning the ecommerce platform race in 2026? The answer depends on how you slice the data.
Shopify's Rising Star
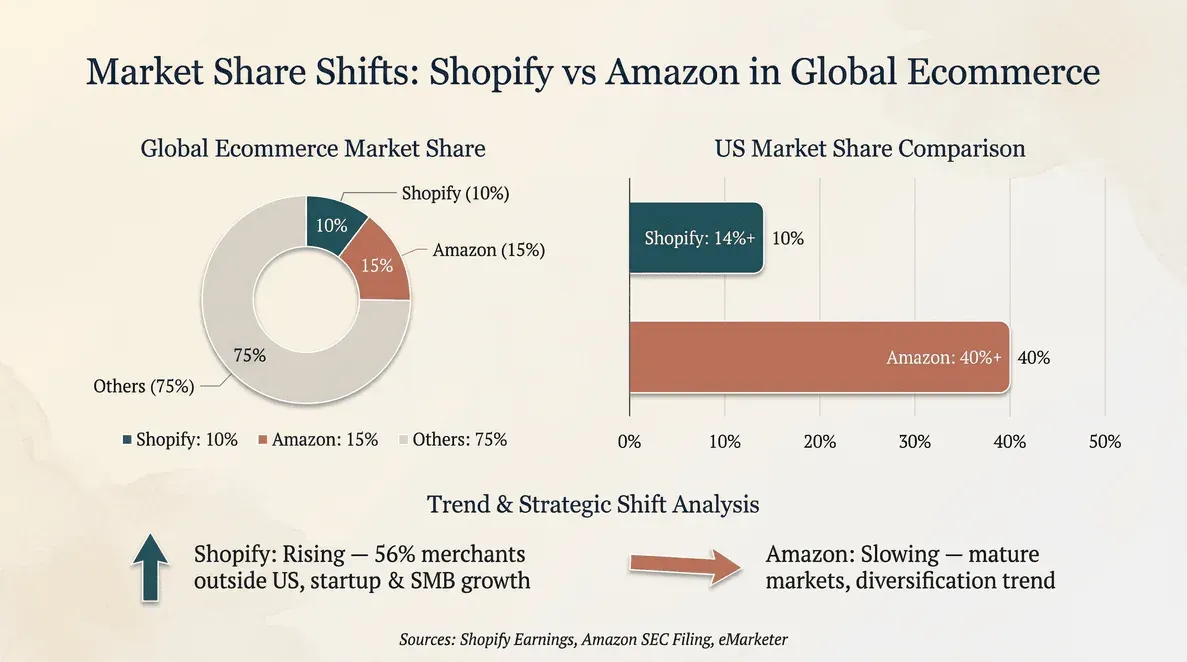
Shopify's global market share has climbed to 10% in 2026, with US share above 14% (Shopify earnings). That's a big jump from just a few years ago, and it's being driven by:
- Brand-building startups: Shopify is the go-to for new DTC brands and SMEs who want control.
- International expansion: Shopify's merchant base is now 56% outside the US.
- Ecosystem growth: Payments, apps, and integrations are making it easier to scale.
Amazon: Still the Giant, But Slowing
Amazon's global market share is 15%, but its growth rate is slowing—especially in mature markets like the US and Western Europe. The platform is still the first stop for many shoppers, but more brands are diversifying to avoid being "just another Amazon seller."
Market Share Table
| Platform | Global Market Share (2026) | US Market Share | Growth Trend |
|---|---|---|---|
| Shopify | 10% | 14%+ | Rising |
| Amazon | 15% | 40%+ (retail ecommerce) | Slowing |
What's the takeaway? Shopify is gaining ground, especially with startups and SMBs who want to build their own brand. Amazon is still the volume leader, but the days of "just list it and they will come" are fading.
Profitability and Seller Margins: Shopify vs Amazon Data
Let's talk money. Which platform puts more profit in your pocket?
Amazon Seller Profitability
According to Jungle Scout's 2025 seller survey:
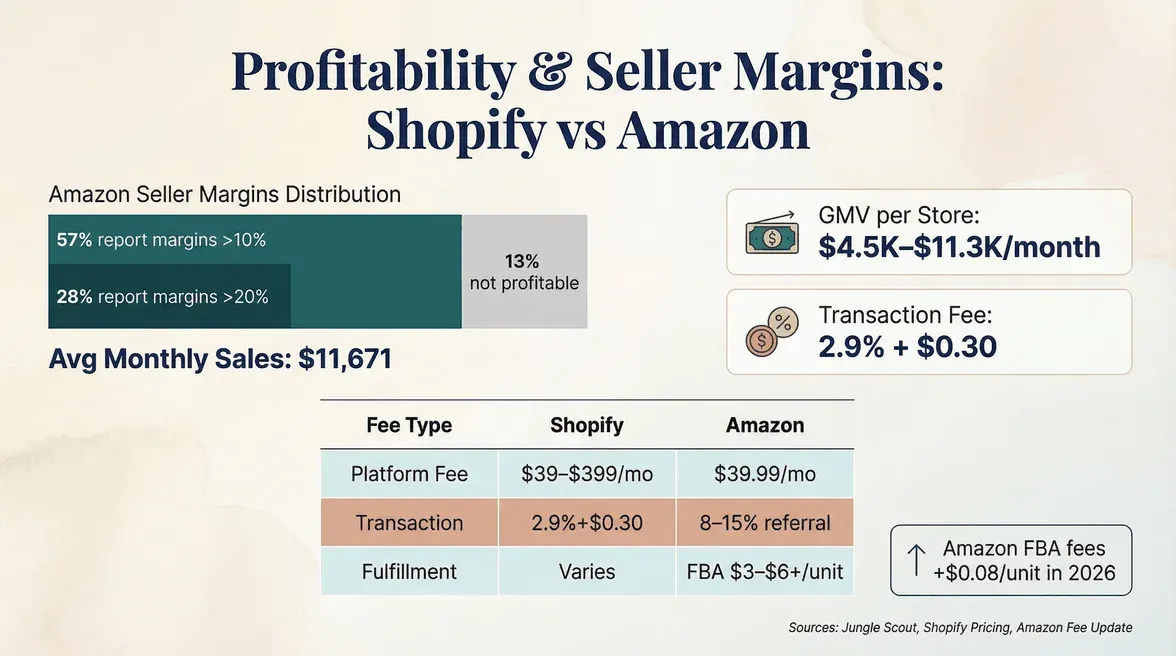
- 57% of Amazon sellers report profit margins above 10%.
- 28% report margins above 20%.
- 13% say they're not currently profitable.
- 58% become profitable within their first year.
- Average monthly sales per seller: $11,671.
- Average profit per month (at 21% margin): ~$2,451.
But there's a catch: Amazon's fee stack is getting heavier. In 2026, FBA fees are increasing by an average of $0.08 per unit, and ad costs are rising.
Shopify Seller Profitability
Shopify doesn't publish profit margin data (it varies widely by business model), but we can estimate:
- GMV per store ranges from $4.5K–$11.3K/month depending on whether you use BuiltWith or StoreLeads for store count (Shopify earnings).
- Fee structure: Shopify charges a monthly subscription ($39 Basic, $105 Grow, $399 Advanced on monthly billing, with Plus starting at $2,300/mo), plus card rates of 2.9% + 30¢ on Basic, dropping to 2.5% + 30¢ on Advanced (Shopify pricing).
- No marketplace fees: You keep more of each sale, but you have to drive your own traffic (which means more marketing spend).
Cost Structure Comparison Table
| Cost Component | Shopify | Amazon |
|---|---|---|
| Platform fee | $39–$399/mo (Basic / Grow / Advanced, monthly billing); Plus from $2,300/mo | $39.99/mo (Pro) |
Field: contents → same section, prose paragraph
| Transaction fee | 2.9% + $0.30 | 8–15% referral fee (category-dependent) |
| Fulfillment fee | Varies (Shopify Fulfillment/3PL) | FBA: $3–$6+/unit (plus 2026 increase) |
| Ad spend | Optional (Meta, Google, TikTok, etc.) | Amazon Ads (rising CPCs) |
| Other fees | App subscriptions, payment gateway | Storage, returns, premium placement |
Key insight: Shopify sellers have more control over costs, but must invest in marketing. Amazon sellers face higher platform fees, but get built-in traffic.
Strategic Implications: Data-Driven Platform Choice for SMBs in 2026
So, what does all this mean for small and mid-sized businesses? Here's my take, based on the data and what I see in the field:
- Shopify is best for brands that want to build long-term customer relationships, control their data, and optimize for repeat purchases. The flexibility and analytics depth make it easier to test, learn, and grow.
- Amazon is unbeatable for instant reach and scale, but you're renting customers, not owning them. The trade-off is less control, higher fees, and more competition.
- The smartest teams are going multi-channel. They use Shopify for brand-building and retention, Amazon for volume and discovery, and unify their data to optimize both.
Pro tip: Don't pick a platform based on gut feeling. Use data—repeat purchase rates, margin analysis, and competitive monitoring—to guide your strategy. That's where AI tools like Thunderbit come in.
Use AI to compare Shopify and Amazon data Get Started Free
Here's where Thunderbit shines. As an AI web scraper, Thunderbit lets you collect and harmonize data from both Shopify and Amazon (and even your competitors):
- Sales trend tracking: Monitor your own and competitor sales, prices, and stock levels across platforms.
- Competitor monitoring: Scrape Amazon SERPs, Shopify collections, and product pages for pricing, reviews, and promo activity.
- Customer behavior analysis: Pull review data, ratings, and sentiment to spot trends and opportunities.
- Unified reporting: Export all your data to Google Sheets, Airtable, Notion, or Excel for side-by-side analysis.
Thunderbit Workflow Example
- Open the Thunderbit Chrome Extension.
- Paste a list of Shopify and Amazon URLs (product, collection, or search pages).
- Click "AI Suggest Fields" to let Thunderbit recommend the best columns (price, reviews, stock, etc.).
- Enable subpage scraping to grab details from product pages or review sections.
- Export your unified dataset to your favorite spreadsheet or database.
- Analyze deltas: Compare pricing, promo frequency, shipping speed, and review density across platforms.
With Thunderbit, you're not limited to what Shopify or Amazon's dashboards give you. You can see the whole market, spot trends early, and make smarter decisions—no coding required.
Key Takeaways: Shopify vs Amazon Seller Data in 2026
Let's wrap up with the big lessons:
- Shopify is growing faster than Amazon in 2026, especially among startups and SMBs. Its 29% YoY GMV growth outpaces Amazon's 12%.
- Shopify sellers enjoy higher repeat purchase rates (28–35%) and more control over customer relationships. Amazon sellers benefit from massive reach but face lower brand loyalty.
- Profit margins are under pressure on both platforms, but Amazon's fee stack is heavier and rising. Shopify sellers must invest more in marketing, but keep more per sale.
- Analytics depth matters. Shopify Analytics is great for DTC, Amazon Seller Central is operationally focused, and Thunderbit bridges the gap with cross-platform, AI-powered data extraction.
- The best strategy is data-driven and multi-channel. Use Shopify for brand-building, Amazon for scale, and unify your data to maximize growth and profitability.
Actionable tip: Start collecting your own cross-platform data now. Don't wait for a quarterly report to tell you what's happening—use tools like Thunderbit to stay ahead of the curve.
FAQs: Shopify vs Amazon Seller Data Analysis
1. How do I estimate whether Amazon fees or Shopify fees are higher for my product?
Amazon charges a referral fee (8–15% depending on category), plus FBA and storage fees — and FBA fees rose an average of $0.08 per unit effective January 15, 2026. Shopify charges a monthly subscription ($39 Basic up to Plus from $2,300/mo) plus a transaction fee starting at 2.9% + 30¢ (Shopify pricing). For low-priced, high-volume items, Amazon's fees can add up quickly. Use each platform's fee calculator and model your own unit economics for an accurate comparison.
2. How many sellers are actually active on Shopify and Amazon?
Shopify reports "millions" of merchants across 175+ countries but doesn't disclose an exact count. Third-party estimates range from 2.8M (StoreLeads) to 6.9M (BuiltWith) live stores. On Amazon, only ~165,000 new sellers registered in 2025 (a decade low, down 44% YoY), and Marketplace Pulse estimates active sellers fell from 2.4M in 2021 to 1.65M by the end of 2025 — even as over 100,000 now do $1M+/year (up from ~60,000 in 2021).
3. Is buyer loyalty stronger on Shopify or Amazon?
Shopify stores average a 28–35% repeat purchase rate, thanks to brand-owned relationships and CRM tools. Amazon shoppers are loyal to the platform (especially Prime), but individual seller repeat rates are closer to 20% (Shopify retention, CIRP Amazon Prime).
4. Which analytics data is first-party vs estimated?
Shopify Analytics and Amazon Seller Central/Brand Analytics provide first-party data for your own store. Market share, seller count, and competitor data are typically estimates from third-party sources or web scraping (Shopify Analytics, Amazon Seller Analytics).
5. How can I analyze Shopify and Amazon data side-by-side?
Use a cross-platform tool like Thunderbit to scrape, unify, and export data from both Shopify and Amazon. This lets you compare pricing, reviews, stock, and promotions in a single spreadsheet or dashboard, giving you a true apples-to-apples view.
Further Reading & Resources
Want to dive deeper? Here are the best sources for up-to-date Shopify vs Amazon seller analytics and ecommerce platform data analysis:
- eMarketer: Global Retail Ecommerce Forecast 2026
- U.S. Census Bureau: Quarterly Ecommerce Sales
- Shopify FY 2025 Earnings Press Release
- Shopify Q1 2026 Financial Results
- Shopify SEC Filing 2025
- Amazon FY 2025 SEC Filing
- Amazon Q1 2026 Earnings Release
- Amazon 2024 Small Business Empowerment Report
- Jungle Scout: Amazon Seller Profitability and Sales Benchmarks
- Shopify Enterprise: Customer Retention Benchmarks
- Littledata: Shopify Conversion Rate and AOV Benchmarks
- Thunderbit: Amazon Product Scraper Tool
- Thunderbit Blog: Ecommerce Analytics & Automation