Picture this: It’s Monday morning, your coffee’s still hot, and you’re staring at a pipeline dashboard that looks more like a rollercoaster than a revenue forecast. You’re not alone. In 2026, sales teams everywhere are feeling the heat—targets are up, buyer patience is down, and the old playbook just isn’t cutting it. The good news? The numbers are finally on your side—if you know where to look.
Today’s sales landscape is powered by data, not just gut instinct. Teams that embrace a data-driven approach are seeing over 3× the revenue growth of their less-savvy peers (Marketing LTB). But here’s the kicker: only 16% of sales reps hit their annual quota in 2024—a jaw-dropping drop from 53% just a decade ago (Flowlu). If you’re not using up-to-date sales statistics to shape your strategy, you’re basically bringing a butter knife to a sword fight.
Let’s dig into the 45 sales statistics you need to know for 2026—covering everything from sales funnel conversion rates to B2B decision-maker dynamics, follow-up best practices, and the real impact of AI and enablement. Whether you’re a sales leader, a quota-carrying rep, or just someone who loves a good stat, these insights will help you outsmart, outpace, and (hopefully) out-sell the competition.
45 Sales Statistics for 2026: Quick Reference
Before we dive deep, here’s a skimmable list of the most impactful sales statistics for 2026. Bookmark this section for your next team meeting, board deck, or “why do we need a new CRM?” debate.
General Sales & Funnel Statistics
-
Only 16% of sales reps hit annual quota in 2024, down from 28% in 2023 and 53% in 2014 (Flowlu).
-
Average B2B sales win rate is 21% (HubSpot).
-
Average sales close rate across industries is ~29% (Flowlu).
-
Sales cycles have gotten 32% longer since 2021 (Gradient Works).
-
Average pipeline coverage ratio for top performers is 3–4× (Landbase).
B2B Sales & Decision-Maker Stats
- 80% of B2B sales interactions now occur via digital channels (Flowlu).
- There’s an average of 5 decision-makers in each B2B sale (HubSpot), with enterprise deals often requiring 10+ sign-offs (Flowlu).
- 75% of B2B buyers are taking longer to make decisions than a year ago (Flowlu).
- 80% of B2B sales are initiated by referrals (Flowlu).
- 72% of company revenue comes from existing customers (HubSpot).
Sales Prospecting & Multi-Channel Stats
- 42% of salespeople say prospecting is the hardest part of sales (Flowlu).
- High-performing sales orgs average 16 touches per prospect (Flowlu).
- 78% of social sellers outperform peers who don’t use social media (Flowlu).
- Combining email and social touchpoints lifts reply rates up to ~12% (Flowlu).
Sales Follow-Up & Response Stats
- Just 2% of sales are made on the first contact (Flowlu).
- 44% of sales reps give up after one follow-up (Flowlu).
- 80% of sales require 5–12 follow-ups to close (Flowlu).
- Leads are 9× more likely to convert when contacted within 5 minutes (Flowlu).
- First vendor to respond wins 35–50% of sales (Flowlu).
Inside Sales, Productivity & Tech
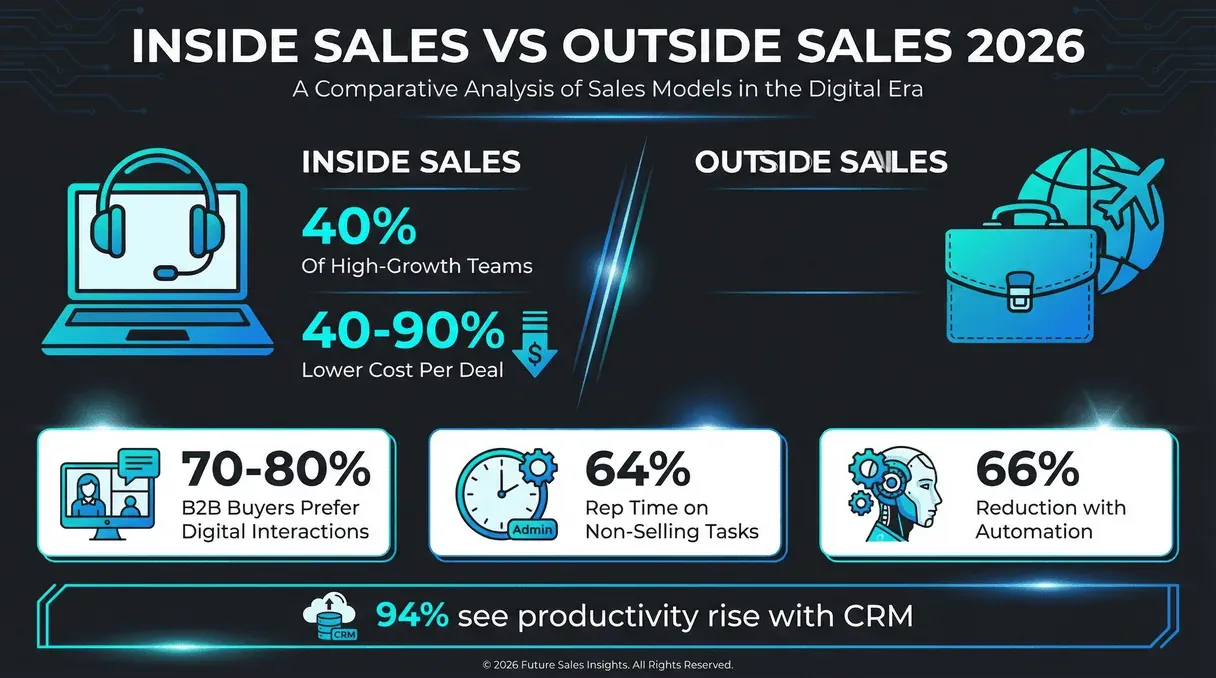
- Inside sales reps now make up 40% of high-growth teams (Flowlu).
- Inside sales can cost 40–90% less per deal than outside sales (Flowlu).
- 64% of a rep’s time is spent on non-selling tasks (Flowlu).
- Automation can cut non-selling work by 66% (Flowlu).
- 94% of businesses see productivity rise after adopting a CRM (Flowlu).
AI, Enablement & Training
- 81% of sales reps believe AI can reduce time spent on manual tasks (Flowlu).
- 72% of sales teams use AI tools in their process (Vena Solutions).
- 45% of sales professionals feel overwhelmed by their tech stack (HubSpot).
- 67% of sales reps now use sales enablement content/tools (Close.com).
- Teams very satisfied with their tools are 82% likely to hit quota (Vena Solutions).
The Modern Sales Funnel: Key Statistics and Trends
The sales funnel isn’t just a buzzword—it’s the backbone of every revenue engine. In 2026, understanding your funnel’s metrics is like having a GPS for your sales strategy. With buyers researching more than ever and switching channels mid-journey, the funnel has become less of a straight line and more like a choose-your-own-adventure book (minus the dragons, unfortunately).
What Is Data Scraping and How to Do It in 2025 Get Started Free
Let’s break down the numbers:
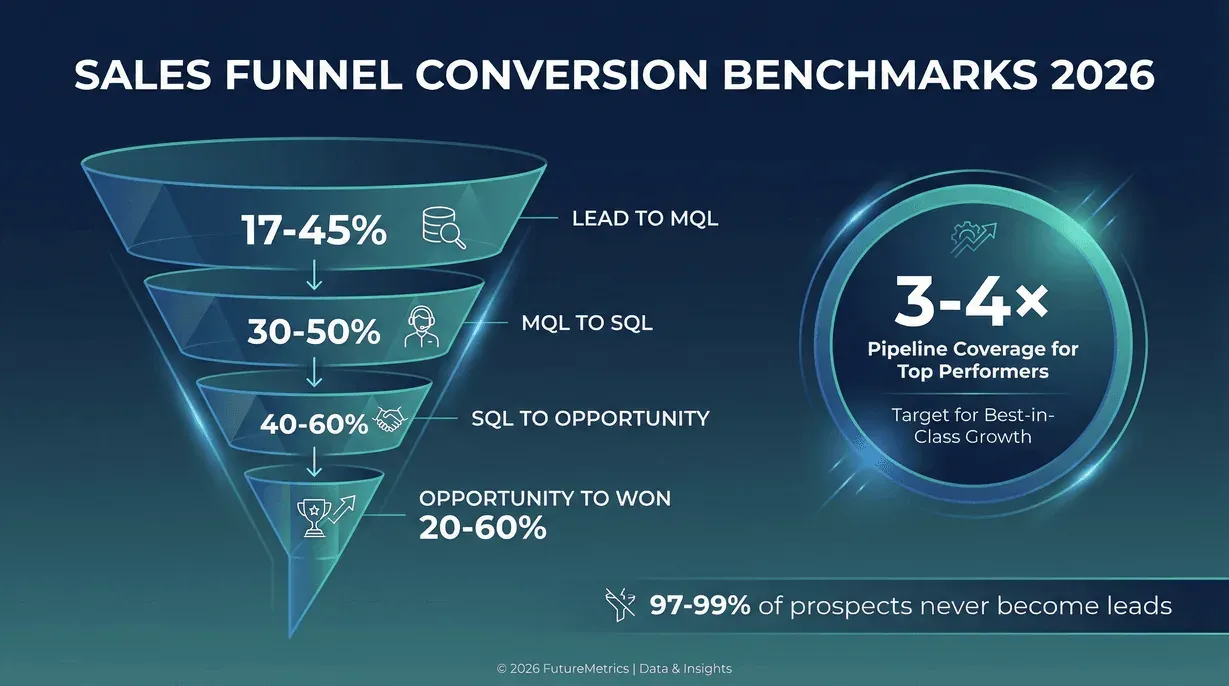
Sales Funnel Conversion Benchmarks
- Lead → MQL conversion: Ranges from ~17% in construction to 45% in higher education (First Page Sage).
- MQL → SQL conversion: Typically 30–50% across industries (First Page Sage).
- SQL → Opportunity: 40–60% (First Page Sage).
- Opportunity → Closed-Won: 20–60% depending on complexity (First Page Sage).
For B2B SaaS:
- Lead to MQL: 39%
- MQL to SQL: 38%
- SQL to Opportunity: 42%
- Opportunity to Closed-Won: 37% (First Page Sage)
For e-commerce:
- Lead to MQL: 23%
- MQL to SQL: 58%
- SQL to Opportunity: 66% (First Page Sage)
Pipeline coverage is another must-watch metric:
Top teams keep 3–4× their quota in pipeline (Landbase). With win rates around 21%, you’ll need that much to consistently hit your number.
And don’t forget the leaky funnel: 97–99% of initial prospects never become a lead (Landbase). If you’re feeling like you’re losing most of your leads, well, you’re in good company.
Multi-channel engagement is now the norm. Buyers use twice as many channels as they did in 2016 (Vena Solutions). Teams that combine email, phone, and social see reply rates up to 12% (Flowlu).
B2B Sales Statistics: Navigating Complex Decision Cycles
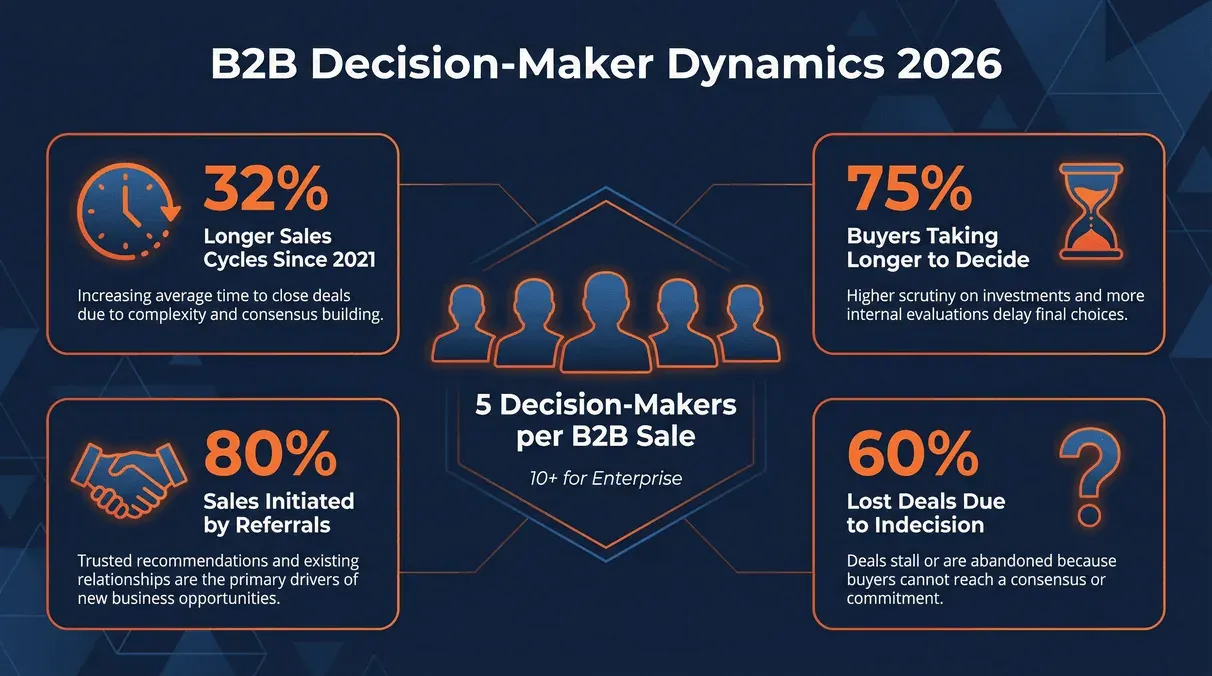
Selling B2B in 2026 is like playing chess against five people at once—each with their own board. The average B2B deal now involves five decision-makers (HubSpot), and in enterprise, it’s often 10+ (Flowlu). No wonder deals are taking longer—sales cycles have stretched 32% since 2021 (Gradient Works).
Decision-Maker Dynamics in B2B Sales
- 75% of B2B buyers are taking longer to make decisions (Flowlu).
- 80% of B2B sales are initiated by referrals (Flowlu).
- 60% of lost deals are due to “no decision,” not competition (Landbase).
- 81% of reps say team selling helps close more deals (Flowlu).
B2B buyers are doing their homework: 96% research independently before talking to sales (Flowlu), and 71% prefer to research on their own (Flowlu). If you’re not adding value beyond what’s on your website, you’re just another tab in their browser.
Sales Prospecting Statistics: Breaking Through in 2026
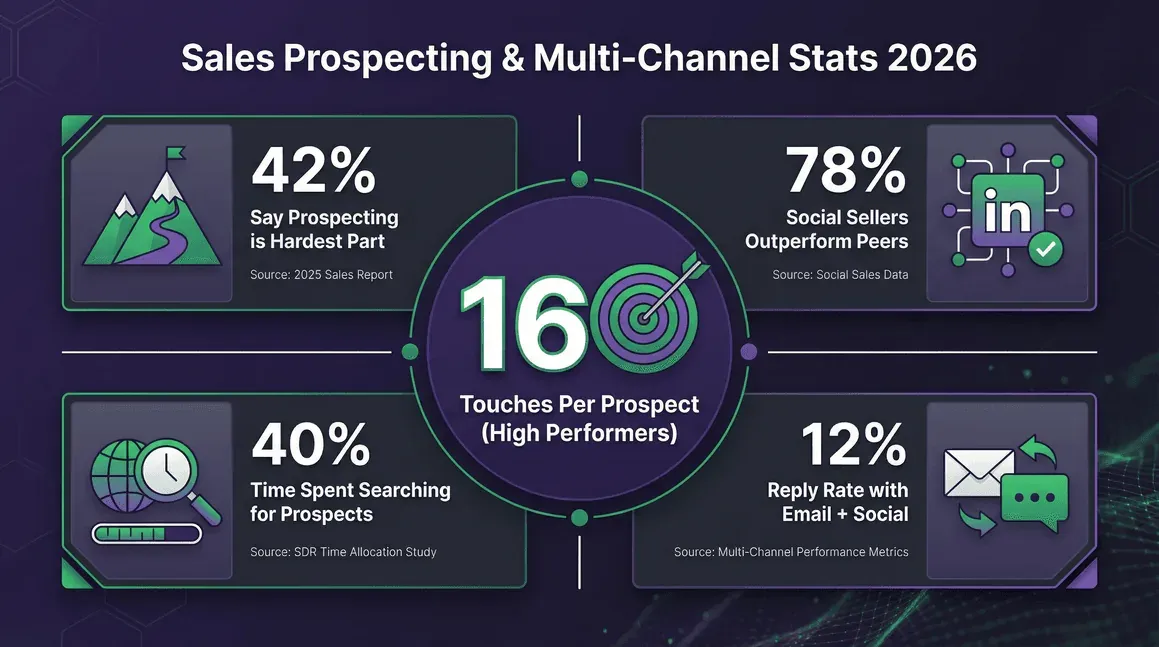
Prospecting in 2026 isn’t for the faint of heart. With inboxes overflowing and buyers dodging cold calls like they’re in the Matrix, it’s no wonder 42% of reps say prospecting is the hardest part of sales (Flowlu). And get this: 40% of their work time is spent just searching for prospects (Flowlu).
Multi-Channel and Social Selling Stats
- High-performing orgs average 16 touches per prospect (Flowlu).
- 78% of social sellers outperform their peers (Flowlu), and 51% are more likely to hit quota (Flowlu).
- Combining email and LinkedIn messages lifts reply rates to ~12% (Flowlu).
The lesson? Persistence and personalization win. And if you’re not using LinkedIn, you’re leaving deals on the table.
Sales Follow Up Statistics: Persistence Pays Off
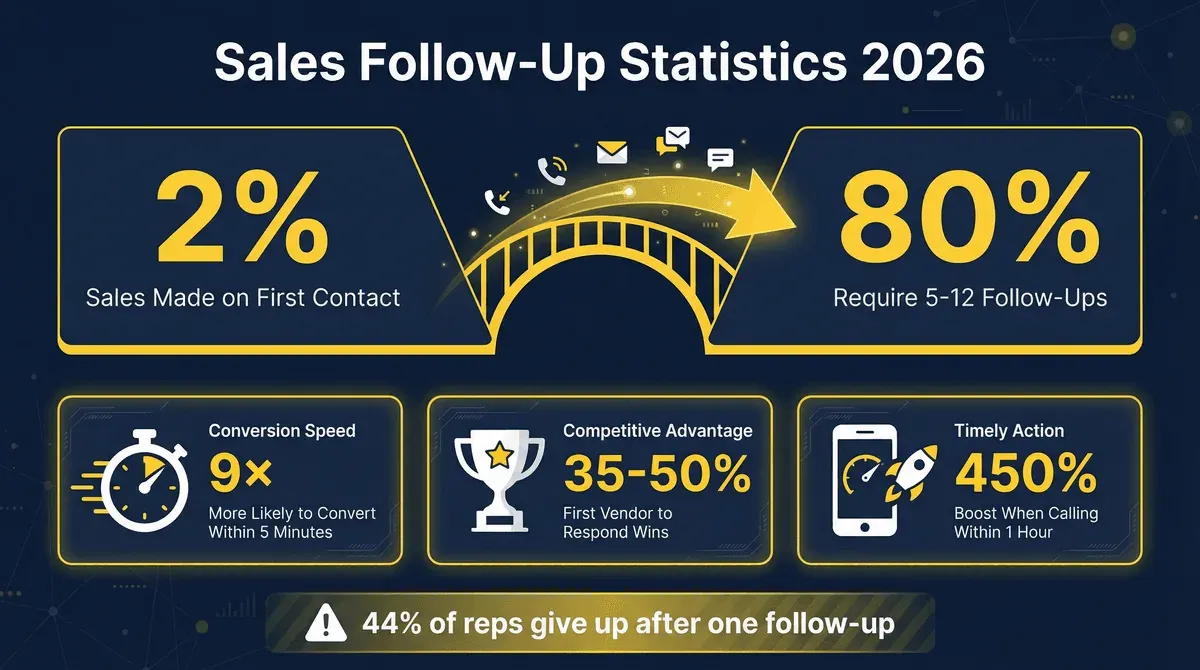
Here’s where most reps drop the ball. Just 2% of sales are made on the first contact (Flowlu), but 44% of reps give up after one follow-up (Flowlu). The reality? 80% of sales require 5–12 follow-ups (Flowlu).
Speed and Frequency: The Follow-Up Formula
- Leads are 9× more likely to convert when contacted within 5 minutes (Flowlu).
- First vendor to respond wins 35–50% of sales (Flowlu).
- Calling a lead within an hour boosts response rate by 450% (Flowlu).
If you’re slow to follow up, you’re basically handing deals to your competitors. And if you’re giving up after two touches, you might as well be selling ice to penguins.
Inside Sales vs. Outside Sales: Cost, Efficiency, and Outcomes
Remember when sales meant hopping on planes and shaking hands? In 2026, inside sales reps make up 40% of high-growth teams (Flowlu), and inside sales can cost 40–90% less per deal (Flowlu). Buyers are on board too: 70–80% of B2B decision-makers now prefer remote or digital interactions (Flowlu).
Inside Sales Productivity and Cost Stats
- 64% of a rep’s time is spent on non-selling tasks (Flowlu).
- Automation can cut non-selling work by 66% (Flowlu).
- 94% of businesses see productivity rise after adopting a CRM (Flowlu).
The bottom line: inside sales is here to stay, and it’s not just about cutting costs—it’s about meeting buyers where they are.
Sales Productivity Statistics: Maximizing Selling Time
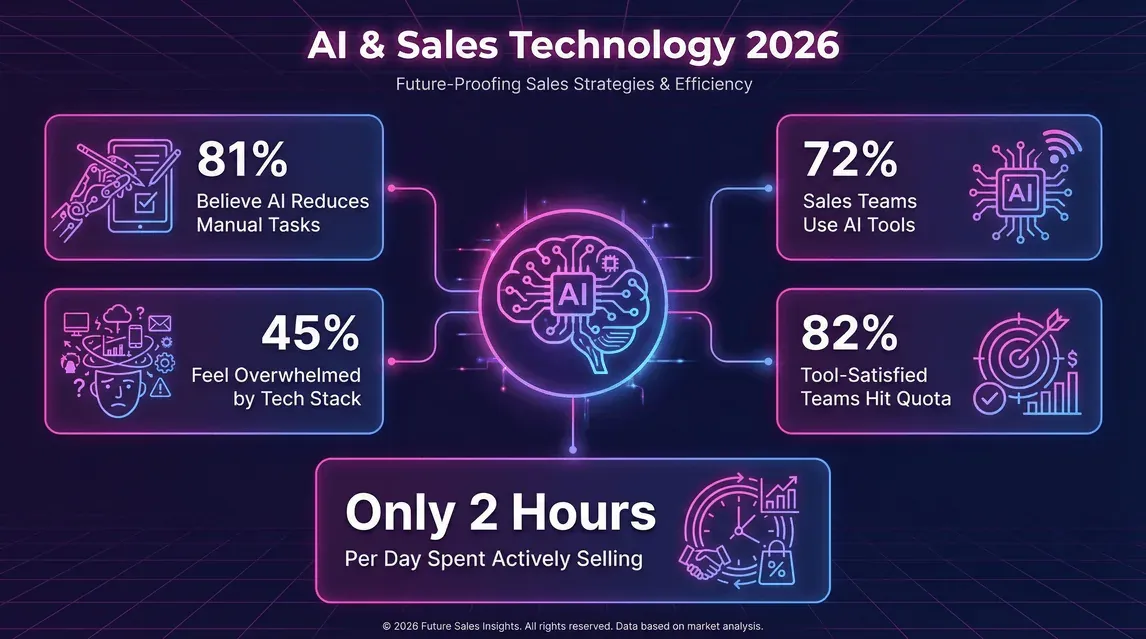
If you’ve ever felt like your day is spent updating CRM fields instead of talking to customers, you’re not alone. Reps spend only about 2 hours per day actively selling (Flowlu). The rest? Admin work, meetings, searching for info, and wondering where the day went.
The Role of Technology and AI in Sales Productivity
- 81% of sales reps believe AI can reduce time spent on manual tasks (Flowlu).
- 72% of sales teams use AI tools in their process (Vena Solutions).
- 45% of sales professionals feel overwhelmed by their tech stack (HubSpot).
- Teams very satisfied with their tools are 82% likely to hit quota (Vena Solutions).
The trick is to use tech that actually helps—not just adds more tabs to your browser. (And if you’re looking for a way to automate data entry, check out Thunderbit—our AI web scraper Chrome extension that helps sales teams pull leads and contact info from any website in just a few clicks.)
Try Thunderbit AI Web Scraper for Sales Prospecting
Sales Closing Statistics: Turning Opportunities into Revenue
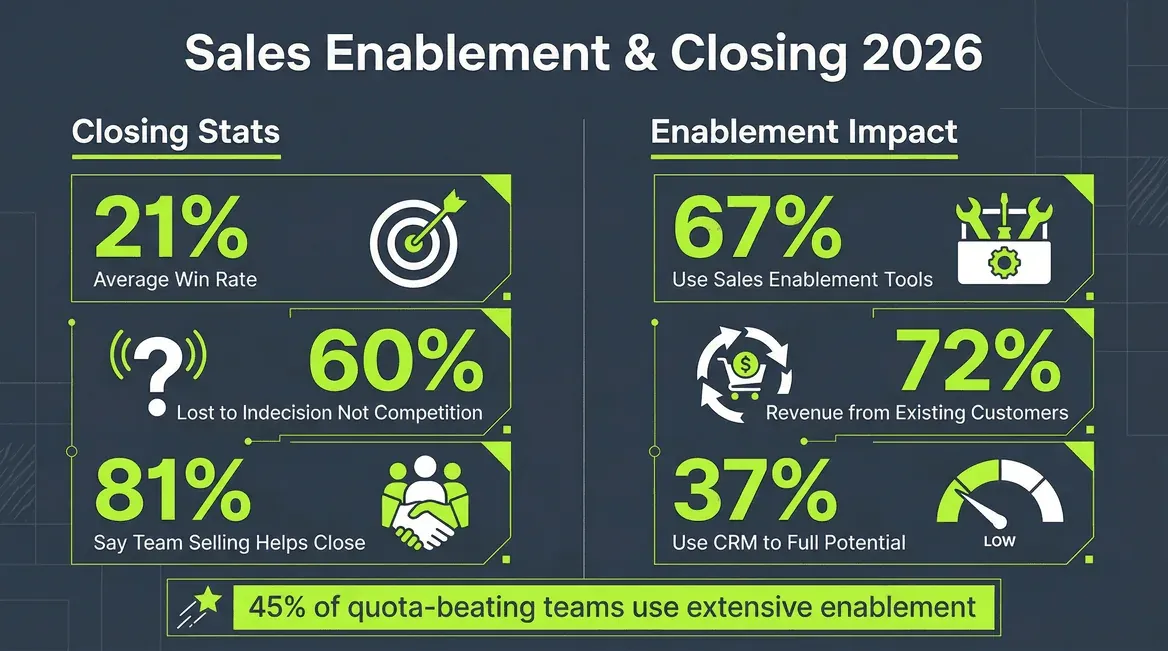
All the pipeline in the world won’t help if you can’t close. The average win rate is 21% (HubSpot), and 60% of lost deals are due to indecision—not competition (Landbase). That means your biggest competitor is often the status quo.
Team Selling and Customer Retention Stats
- 81% of reps say team selling helps close more deals (Flowlu).
- 72% of company revenue comes from existing customers (HubSpot).
- 91% of sales professionals engage in upselling, and 87% in cross-selling (Vena Solutions).
The lesson? Don’t just chase new logos—double down on customer success and expansion. And if you’re not looping in your product or success teams on big deals, you’re missing out.
Sales Enablement and Training: The Hidden Driver of Success
You can have the best tech stack and the fanciest pitch deck, but if your team isn’t trained and enabled, you’re leaving money on the table. 67% of sales reps now use sales enablement content/tools (Close.com), and 45% of teams that beat their quotas report extensive use of enablement tools (Close.com).
Enablement Tools and Content Utilization
- Sales reps spend 5+ hours per week on training/self-improvement (Vena Solutions).
- Only 37% of organizations use their CRM to its full potential (Landbase).
- One-third of reps say lack of training hinders their adoption of AI and new tech (Vena Solutions).
Enablement isn’t a “set it and forget it” deal. Ongoing training, coaching, and content that’s actually used (not just sitting in a Google Drive folder) are what separates top teams from the rest.
What Is List Crawling and How to Do It Using AI Get Started Free
Key Takeaways from 2026 Sales Statistics
Let’s wrap up with the most actionable insights from all these numbers:
- Persistence wins: Most deals require 5+ follow-ups. Don’t quit after one or two.
- Speed matters: Respond to leads in minutes, not hours. The first to reply often wins.
- Focus on selling: Free up reps from admin work with automation and AI.
- Go multi-channel: Use email, phone, social, and text—don’t put all your eggs in one basket.
- Know your funnel: Benchmark your conversion rates at every stage and plug the leaks.
- Prioritize enablement: Invest in training and tools your team will actually use.
- Double down on existing customers: Most revenue comes from renewals, upsells, and referrals.
- Embrace data: Use these benchmarks to spot gaps and drive improvement.
Citing Sales Statistics: How to Use This Data in Your Strategy
Want to make your next sales strategy deck bulletproof? Here’s how to leverage these stats:
- Always cite your sources: Use reputable reports (HubSpot, Gartner, etc.) and link directly to the data.
- Contextualize: Don’t just drop a stat—explain what it means for your team.
- Visualize: Turn key stats into charts or infographics for maximum impact.
- Keep it fresh: Use the latest data (2024–2026) to stay relevant.
- Mix external and internal: Benchmark your own numbers against industry averages.
And if you’re ever in need of up-to-date sales data, bookmark this post—or check out the Thunderbit Blog for more insights on sales, automation, and productivity.
Read More Sales & Automation Insights on Thunderbit Blog
Final Thoughts
Sales in 2026 is a data-driven, tech-enabled, and buyer-centric game. The teams that win are the ones who adapt quickly, persist longer, and use every tool at their disposal (including a few AI-powered ones—shameless plug for Thunderbit and our Chrome Extension). Whether you’re optimizing your funnel, refining your follow-up cadence, or leveling up your enablement, let the numbers guide you.
And remember: in sales, as in life, it’s not about how many times you get knocked down—it’s about how many times you follow up after. (Okay, maybe that’s not exactly how the saying goes, but you get the idea.)
If you found these stats helpful, share them, cite them, and let’s make 2026 the year your team crushes quota—one data point at a time.
Try Thunderbit AI Web Scraper for Sales Teams Get Started Free
Learn More