Picture this: you’re standing in a store aisle, phone in hand, comparing prices online while an app pings you with a coupon for curbside pickup—meanwhile, your friend just bought a pair of sneakers straight from a TikTok live stream. Welcome to retail in 2026, where the lines between online and offline have blurred into a fast-paced, data-driven dance. Whether you’re a brand, a retailer, or just someone who can’t resist a good deal, the way people shop is evolving at breakneck speed. And if you want to keep up (or, let’s be honest, just keep your cart from being abandoned), you need to know the numbers behind the trends.
From the explosive growth of ecommerce—now topping one-fifth of all global retail sales—to the enduring pull of brick-and-mortar, and the meteoric rise of mobile and AI-powered shopping, these retail statistics aren’t just trivia. They’re the playbook for anyone in sales, marketing, ecommerce, or retail operations looking to win in 2026. I’ve dug deep into the latest research, and I’m excited to share the 60 most eye-opening retail shopper statistics that will shape your strategy for the year ahead.
Quick-Glance: Top Retail Shopper Statistics for 2026
Let’s kick things off with a rapid-fire look at the most jaw-dropping stats every retailer and brand should know for 2026:
-
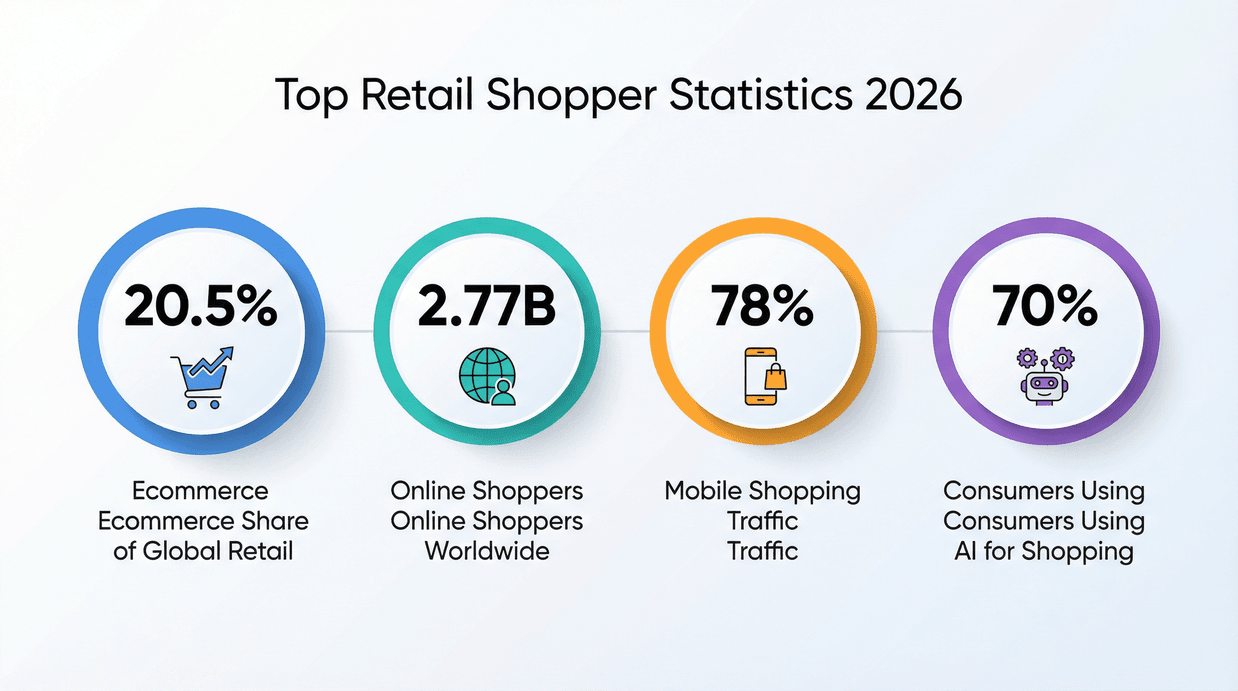
Ecommerce Surpasses 20% of Global Retail: For the first time, online shopping will represent over one-fifth of total global retail sales (20.5%) in 2025—a pivotal milestone for digital commerce.
-
2.77 Billion People Shop Online: That’s nearly 35% of the world’s population clicking “Add to Cart”, showing ecommerce’s reach in both mature and emerging markets.
-
Mobile Dominates Shopping Traffic: 78% of online shopping traffic now comes from mobile devices. If your site isn’t mobile-optimized, you’re missing out on the majority of shoppers.
-
Brick-and-Mortar Still Rules the U.S.: 81.6% of U.S. retail sales happen in-store, reminding us that physical stores remain essential for product discovery and instant gratification.
-
Hybrid Shopping Is the New Normal: 72% of U.S. consumers like buying online and picking up in-store, and 10% of all retail transactions are now click-and-collect.
-
Gen Z Shops Digital-First: 80% of Gen Z’s shopping is online, and 60%+ are influenced by social media and influencers.
-
AI Is Everywhere: 70% of consumers have used an AI tool or feature to assist with shopping, and 58% trust AI to find them the best deals.
-
Fast & Free Shipping Is a Must: 74% of online shoppers expect delivery within two days, and 68% expect free shipping on orders under $50.
-
Buy Now, Pay Later (BNPL) Takes Off: 51–54% of Gen Z and Millennials use BNPL more often than credit cards.
-
Value-Driven Shopping Is Universal: Over one-third of consumers have “traded down” to cheaper brands, and private label sales now make up 25% of U.S. grocery purchases.
Why do these stats matter? Because they reveal where shoppers are, what they expect, and how you can win their loyalty (and their wallets) in 2026.
Retail Sales in 2026: Ecommerce vs. In-Store Showdown
The “ecommerce vs. in-store” debate is officially over. The answer? Both are thriving—just in different ways.
Ecommerce Statistics: The Digital Surge
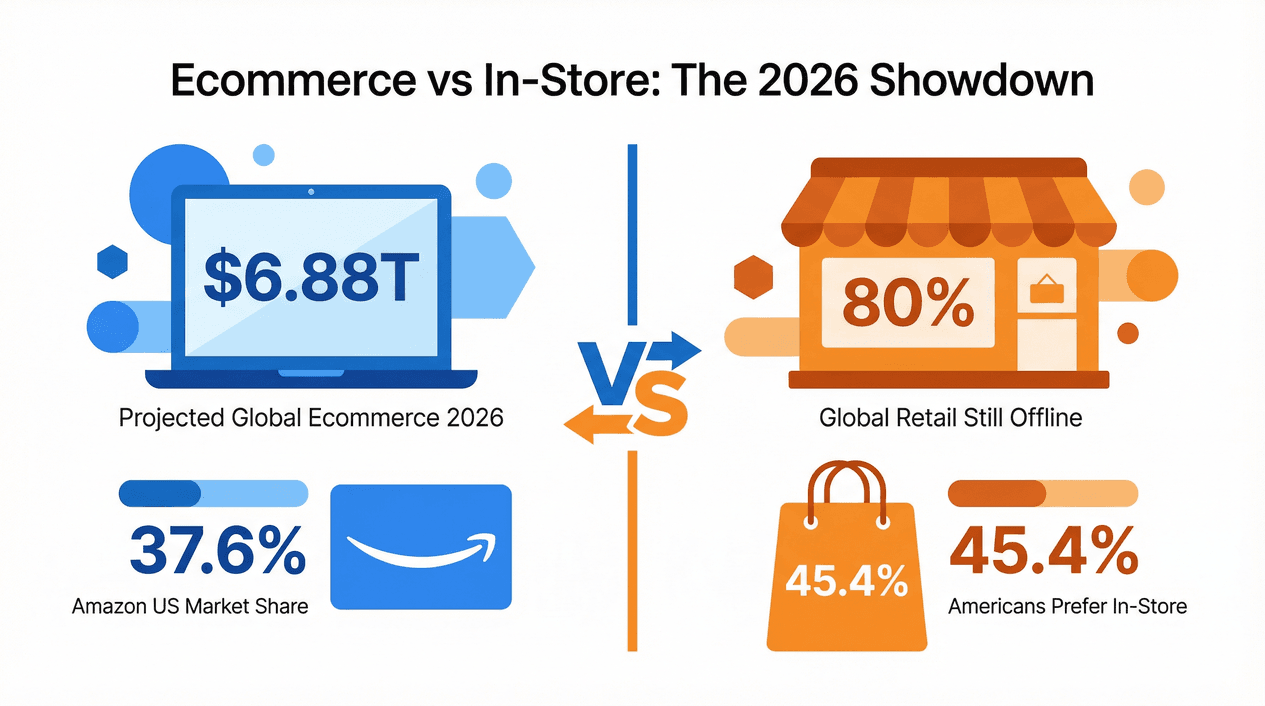
Ecommerce is on a tear. In 2024, global online retail sales hit $6.01 trillion, and projections show we’re heading for $6.88 trillion by 2026. That’s a 6–8% annual growth rate—no small feat for an industry already this massive.
-
Ecommerce’s Share of Retail: 20.5% of global retail sales will be online in 2025. In the U.S., it’s 18.4% in 2024 and climbing.
-
Who’s Leading? China is the global ecommerce powerhouse, with over 50% of its retail spend happening online.
-
Top Categories: Electronics, fashion, and home goods are ecommerce’s bread and butter, but online grocery and automotive parts are the fastest-growing segments.
-
Marketplace Domination: 72% of global online sales happen on marketplaces like Amazon, Alibaba, and eBay. In the U.S., Amazon commands 37.6% of the online retail market.
What does this mean for brands? If you’re not optimizing for marketplaces and mobile, you’re leaving money on the table. And with AI-powered personalization now boosting conversion rates by 10–15%, digital retail is only getting smarter.
Scrape ecommerce data with AI Get Started Free
Don’t let the digital surge fool you—brick-and-mortar is alive and well.
In-Store Shopping: Still Going Strong
-
Global Perspective: 80% of retail spending still happens offline, and in the U.S., in-store sales are over four times larger than ecommerce sales.
-
Shopper Preferences: 45.4% of Americans prefer shopping in-store, compared to 28.4% who prefer online.
-
Category Leaders: Groceries, furniture, and beauty products are still mostly bought in person. For example, only 23.8% of consumers prefer to buy furniture/appliances online.
Why do stores endure? Immediacy, hands-on experiences, and the social aspect of shopping can’t be replicated online. Plus, in-person impulse buys are still a thing—just ask anyone who’s ever gone to Target for “one thing.”
Hybrid Shopping: Where Online Meets Offline
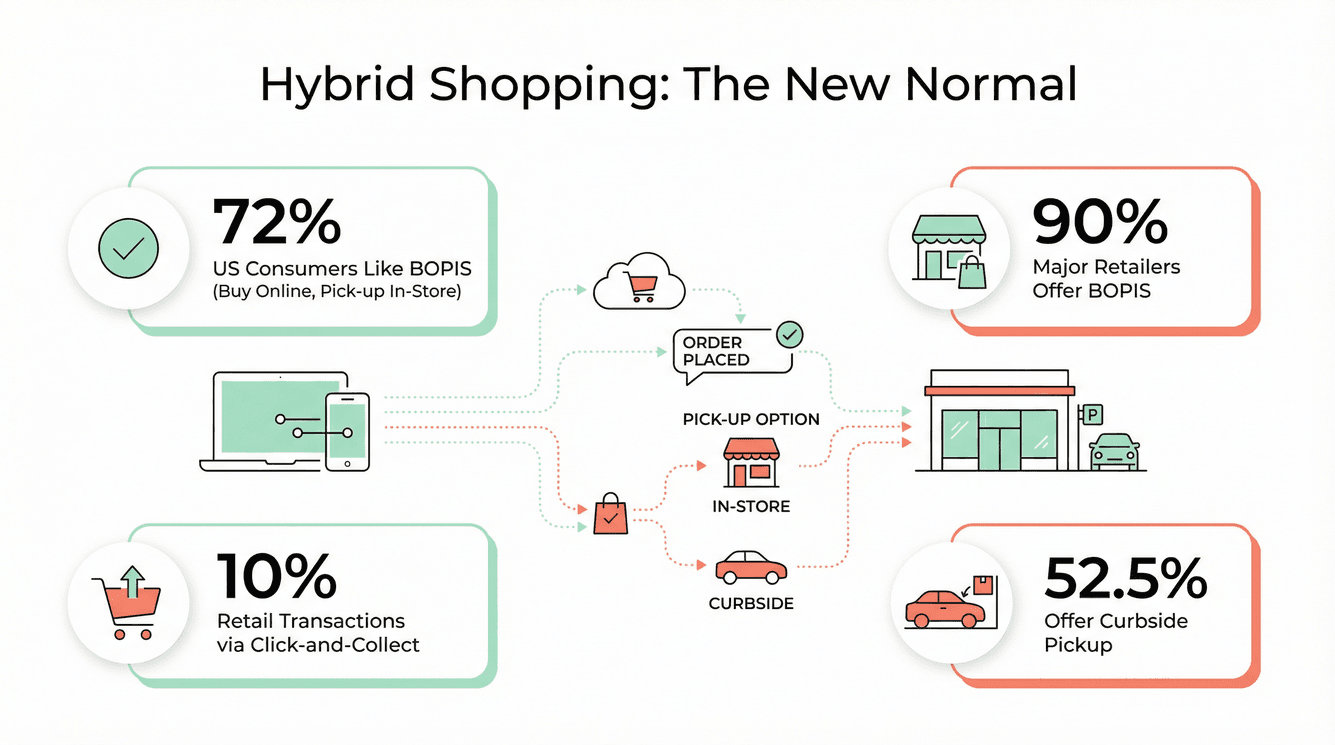
Hybrid shopping—think BOPIS (Buy Online, Pick Up In Store), curbside pickup, showrooming, and webrooming—isn’t just a trend. It’s the new expectation.
-
BOPIS Boom: 10% of all retail transactions are now click-and-collect, and 72% of U.S. consumers like BOPIS.
-
Retailer Adoption: 90% of major retailers offer BOPIS, and 52.5% offer curbside pickup.
-
Customer Journey: Hybrid shoppers expect to check local inventory online, order for same-day pickup, and return items in-store—even if they bought them online.
Hybrid shopping isn’t just about convenience; it’s about control. Shoppers want to choose how, when, and where they get their products, and retailers that deliver on this flexibility are winning loyalty.
Generational Retail Shopper Statistics: How Each Age Group Shops
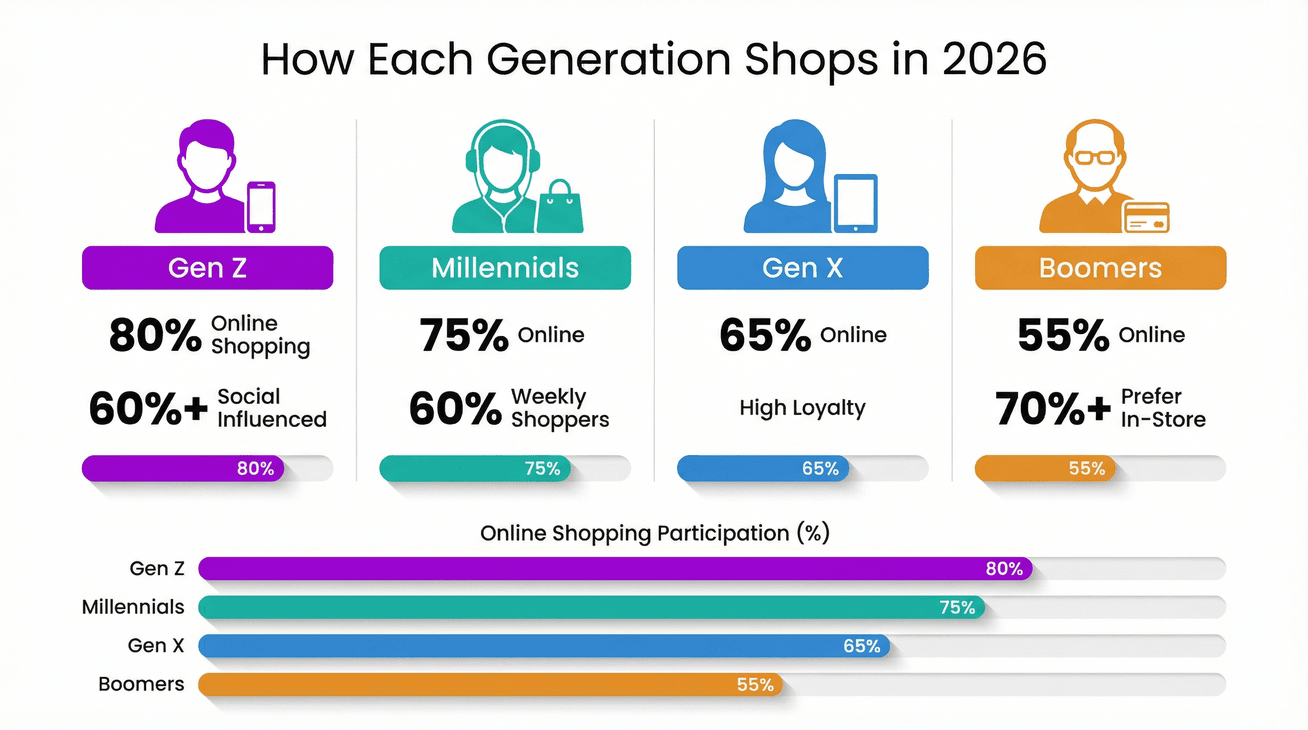
Let’s break down how Gen Z, Millennials, Gen X, and Boomers are shopping in 2026. Spoiler: there’s no one-size-fits-all.
| Generation | % Shopping Online | Social Influence | Loyalty | Top Motivators |
|---|---|---|---|---|
| Gen Z | 80% | 60%+ | Low | Social media, speed, values |
| Millennials | 75% | 50–65% | Medium | Convenience, fast shipping |
| Gen X | 65% | 45% | High | Value, loyalty programs |
| Boomers | 55% | 25% | Highest | In-store, trust, simplicity |
Gen Z Retail Statistics
- Digital Natives: 80% of Gen Z shopping is online.
- Social Power: 60%+ are influenced by social media/influencers.
- Values-Driven: 60% will pay a premium for sustainable products.
- Hybrid Habits: Most likely to mix online, in-store, and mobile in a single shopping journey.
Millennial Retail Statistics
- Omnichannel Pros: 75% prefer online shopping; 60% shop online weekly.
- BNPL Fans: More likely to use Buy Now, Pay Later.
- Mobile-First: Early adopters of mobile shopping and expect seamless app experiences.
Gen X and Boomer Retail Statistics
- Gen X: 65% shop online regularly, but love loyalty programs and value.
- Boomers: 55% shop online, but 70%+ prefer in-store. Highest brand loyalty and spending power.
Each generation has its quirks—Gen Z wants authenticity and speed, Millennials want convenience, Gen X wants value, and Boomers want trust. Retailers that tailor their approach win.
Mobile Shopping & Social Commerce: Retail on the Go
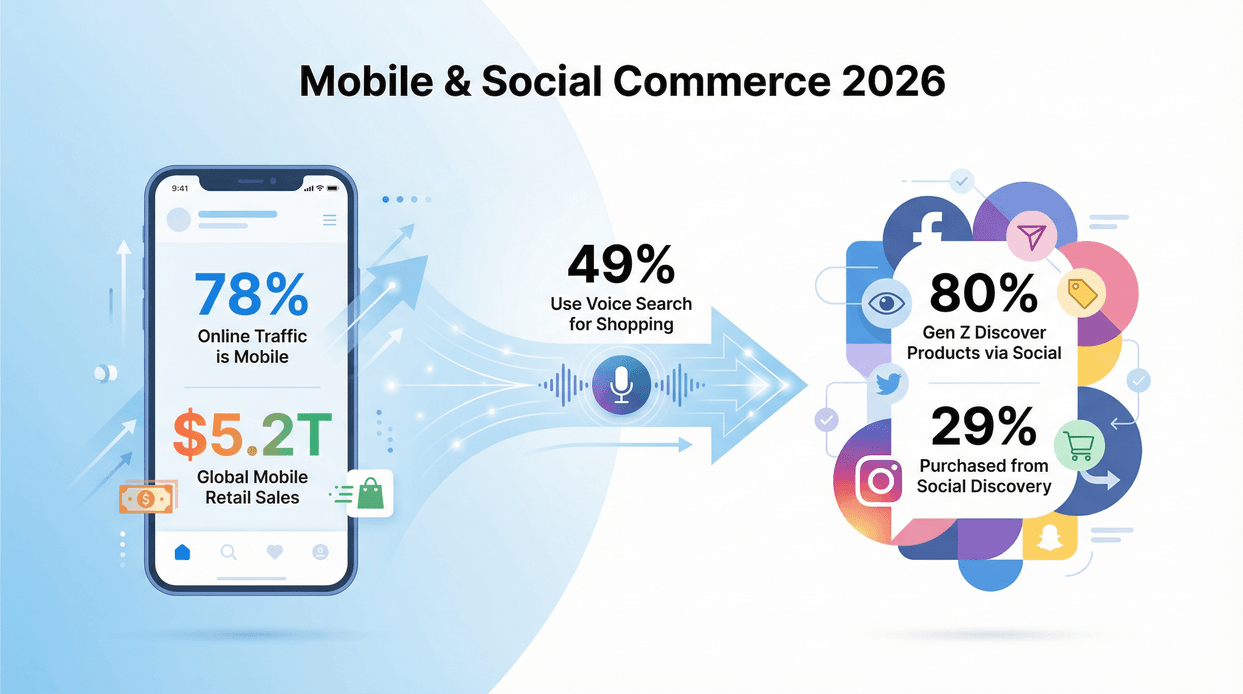
If you’re reading this on your phone, you’re not alone—78% of online shopping traffic is mobile. Mobile isn’t just a channel; it’s the main stage.
- Mobile Shopping: 45% of U.S. consumers shop on mobile weekly.
- Mobile Sales: $5.2 trillion in global mobile retail sales in 2024.
- Voice Search: 49% of U.S. consumers use voice search for shopping.
Social Media’s Impact on Retail Shopper Statistics
- Product Discovery: 32% of consumers use social media to find products; 80% of Gen Z discover new products via social.
- Social Commerce: 29% of consumers have purchased a product they first found on social media.
- Influencer Power: 60% of Gen Z are influenced by influencer recommendations.
If you’re not optimizing for mobile and social, you’re basically showing up to a marathon in flip-flops.
Scrape Retail & Ecommerce Data Instantly
AI Personalization, Voice Search, and Retail Tech Trends
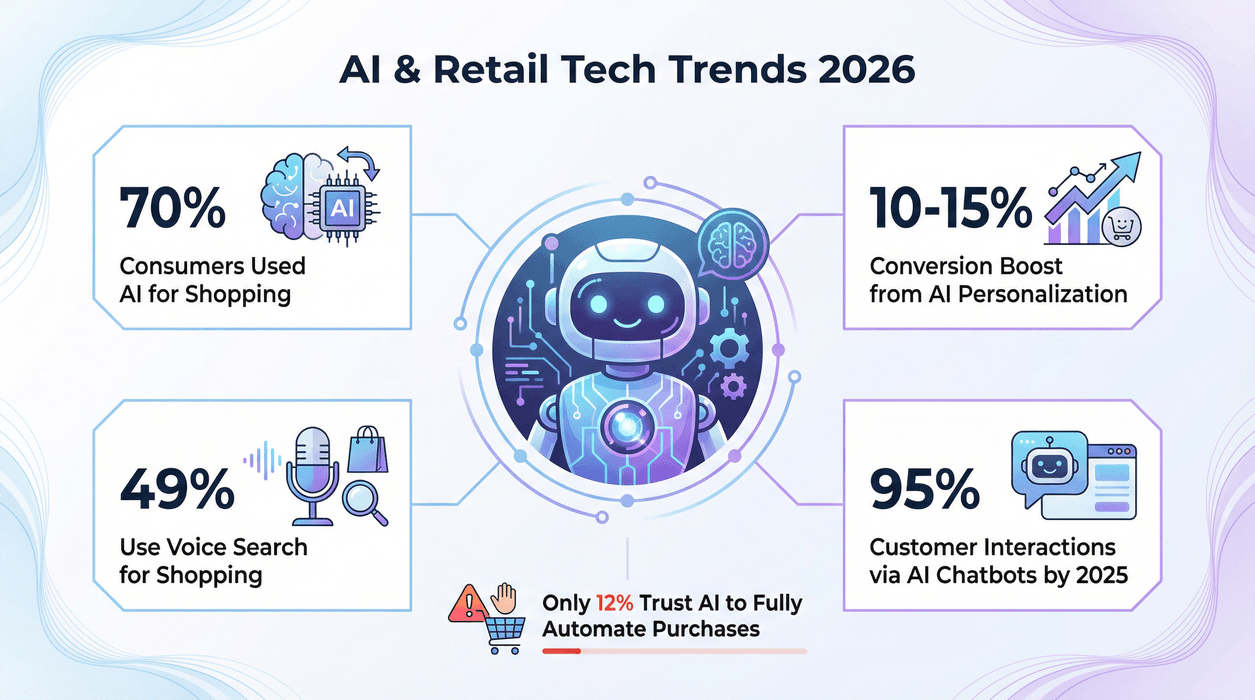
AI isn’t just for Silicon Valley anymore—it’s in your shopping cart, your inbox, and even your voice assistant.
- AI Adoption: 70% of consumers have used AI tools for shopping.
- Personalization Pays: AI-driven personalization can boost conversion rates by 10–15%, and 58% of marketers say it increases loyalty.
- Voice Search: 49% of U.S. consumers use voice search for shopping, and 74% of those have completed a purchase via voice.
- Chatbots: 95% of customer interactions could be initiated via AI chatbots by 2025.
AI is making shopping smarter, faster, and more personal. But trust is still building—only 12% of shoppers trust AI to fully automate a purchase.
Shipping, Delivery, and Fulfillment: What Retail Shoppers Expect
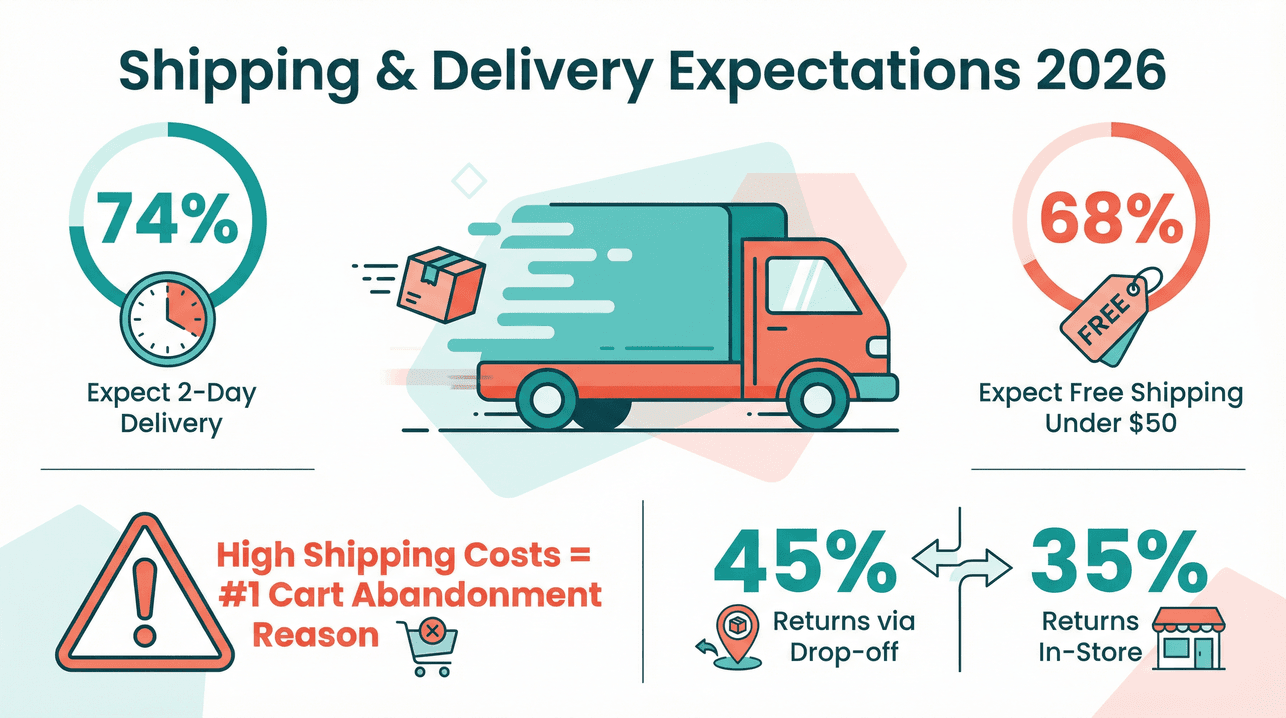
Thanks to Amazon Prime, patience is officially out of style.
- Speed: 74% of online shoppers expect delivery within two days.
- Free Shipping: 68% expect free shipping on orders under $50.
- Cart Abandonment: High shipping costs are the #1 reason for cart abandonment.
- Returns: 45% of online returns happen via drop-off points, 35% in-store.
Retailers, if your shipping isn’t fast and free (or at least feels that way), you’re not just losing sales—you’re practically giving them away.
Payment Preferences & Cybersecurity: How Retail Shoppers Pay
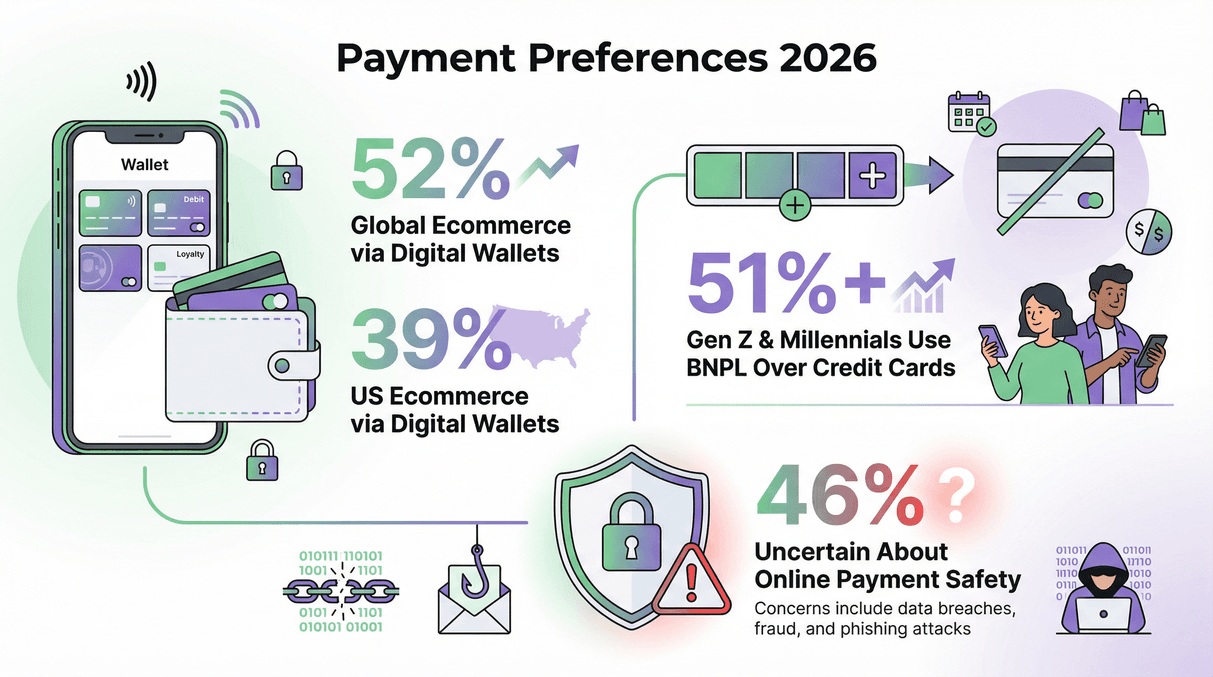
Cash is fading, cards are holding on, but digital wallets and BNPL are stealing the show.
- Digital Wallets: 52% of global ecommerce transaction value is via digital wallets.
- U.S. Adoption: 39% of U.S. ecommerce spend is via digital wallets.
- BNPL: Over half of Gen Z and Millennials use BNPL more than credit cards.
- Security Concerns: 46% of U.S. consumers are uncertain about online payment safety.
If you’re not offering digital wallets and BNPL, you’re missing out on the next generation of spenders. And if your checkout doesn’t scream “secure,” expect some abandoned carts.
Gender-Based Retail Shopper Statistics: Who Buys What, Where, and How
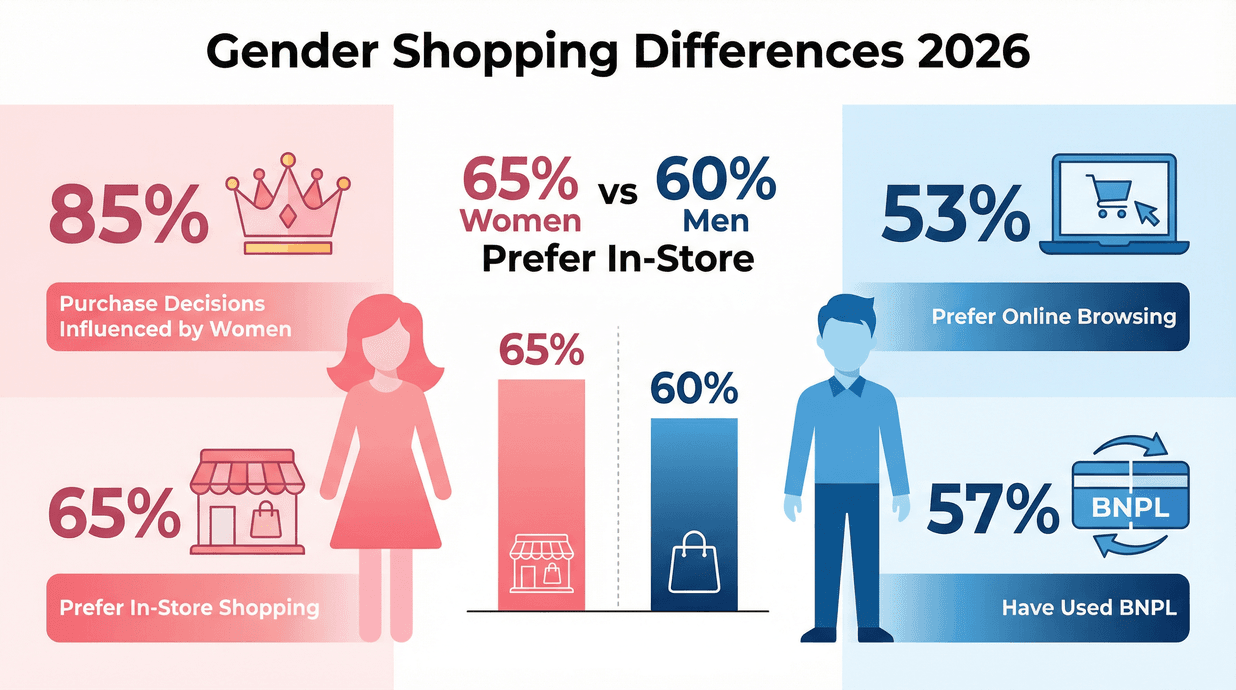
Let’s bust some myths and get to the facts:
- Women Drive Spending: 85% of purchase decisions are influenced by women.
- In-Store vs. Online: 65% of women prefer in-store shopping, vs. 60% of men.
- Online Habits: 53% of men prefer browsing online vs. 44% of women.
- BNPL Adoption: 57% of men vs. 45% of women have used BNPL.
Women tend to handle most household shopping and value loyalty programs, while men are more likely to splurge on gadgets and adopt new tech like voice shopping.
Value-Seeking Shoppers: The New Retail Reality
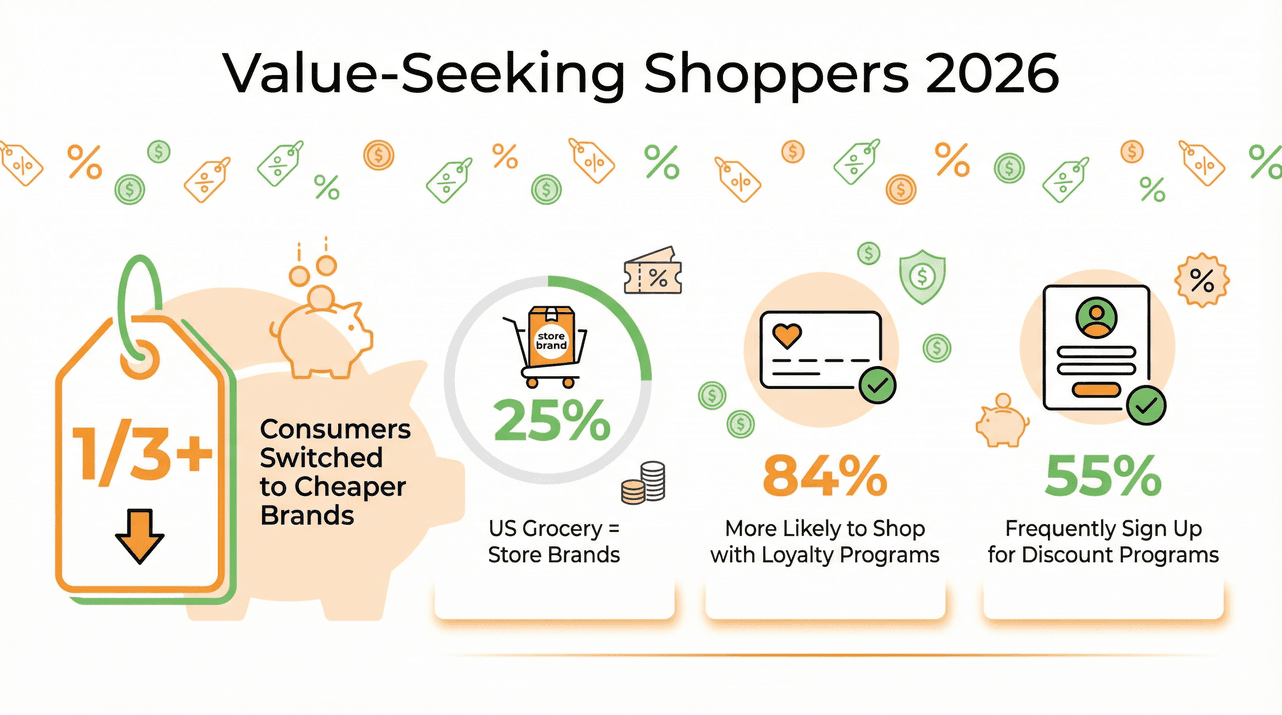
Everyone loves a deal, but in 2026, value-seeking is the default.
- Trading Down: Over one-third of consumers have switched to cheaper brands.
- Private Label Growth: 25% of U.S. grocery products are store brands.
- Loyalty Programs: 84% of consumers are more likely to shop with brands that offer loyalty programs.
- Coupon Culture: 55% of consumers frequently sign up for loyalty or discount programs.
Retailers are responding with dynamic pricing, more promotions, and personalized offers. If you’re not showing value, you’re not even in the running.
Learn how to collect retail data with AI Get Started Free
Key Takeaways: What These Retail Shopper Statistics Mean for 2026
So, what’s the big picture? Here’s what these retail and ecommerce statistics are telling us:
- Omnichannel Is Essential: Shoppers expect to move seamlessly between online and offline. Invest in unified inventory, loyalty programs, and fulfillment options like BOPIS and curbside pickup.
- Mobile and Social Are Non-Negotiable: If your mobile experience is clunky or your social channels are just for “likes,” you’re missing where the action (and the dollars) are.
- Personalization Wins: AI-powered recommendations and tailored marketing aren’t a “nice to have”—they’re the new baseline for conversion and loyalty.
- Speed and Value Rule: Fast, free shipping and clear value propositions (think loyalty perks, private label, and deals) are what keep shoppers coming back.
- Trust Is Currency: With rising concerns about payment security and data privacy, transparency and robust cybersecurity are must-haves.
- Know Your Audience: Different generations and genders shop differently. Segment your messaging and channels to meet them where they are.
- Adapt or Get Left Behind: The only constant is change. Use these statistics as your compass, but keep listening to your customers and be ready to pivot.
Methodology & Data Sources
All these retail shopper statistics for 2026 were compiled from the latest and most reputable sources in the industry, including:
- U.S. Census Bureau & Department of Commerce
- eMarketer/Insider Intelligence
- Statista & DataReportal
- National Retail Federation (NRF)
- Deloitte, McKinsey, PwC
- Capital One Shopping Research
- Circana (formerly IRI + NPD)
- Private Label Manufacturers Association (PLMA)
- Payments Dive, The Financial Brand, Worldpay/FIS Global Payments Report
- YouGov, Ipsos, and more
Every stat is linked to its original source for transparency and citation. For a deeper dive, check out the links throughout this article—there’s a treasure trove of insights for anyone who wants to dig in.
Want to stay ahead in retail and ecommerce?
Bookmark this page, share it with your team, and keep these statistics handy as you plan your next move. And if you’re looking to automate your own data collection or keep tabs on your competitors, check out Thunderbit—our AI web scraper makes gathering retail and ecommerce data as easy as a couple of clicks. (Seriously, it’s so simple, even your least techy coworker could use it.)
For more retail and ecommerce insights, swing by the Thunderbit Blog or explore guides like What Is Data Scraping and How to Do It in 2025 and How to Scrape Amazon Products and Reviews in 2025 using AI.
Stay curious, stay data-driven, and here’s to making 2026 your most successful retail year yet.
Try Thunderbit AI Web Scraper for Retail Data Get Started Free
Learn More