The world is drowning in data—no exaggeration. In 2024 alone, we’re expected to generate a mind-boggling 147 zettabytes of digital information, more than double what we produced just a few years ago. Whether you’re a market researcher, an academic, or a business analyst, the real challenge isn’t finding data—it’s making sense of it. And let’s be honest: nobody wants to spend 80% of their time just cleaning, organizing, or copy-pasting information from a hundred different sources. I’ve been there, and it’s about as fun as watching paint dry.
Scrape data from any website using AI Get Started Free
That’s why I’m a huge believer in the power of the right research analysis tools. With the right toolkit, you can transform raw data into actionable insights, streamline your workflow, and—dare I say—actually enjoy the process. From AI-powered web scraping to advanced qualitative coding, from interactive dashboards to seamless citation management, there’s a tool for every research headache. So, let’s dive into the top 25 tools for research analysis that every professional should have on their radar in 2025.
Why Choosing the Right Tools for Research Analysis Matters
Let’s face it: research isn’t just about collecting information—it’s about turning chaos into clarity. The right tools for research analysis don’t just save you time; they help you avoid costly mistakes, reduce manual errors, and let you focus on what really matters: finding insights and telling compelling stories with your data.
Without modern tools, you’re stuck in the weeds—copy-pasting, manually coding, or wrestling with spreadsheets that seem to multiply like rabbits. In fact, data analysts spend up to 80% of their time just collecting and cleaning data. That’s not just inefficient—it’s a recipe for burnout and missed opportunities.
But when you use specialized tools, everything changes. AI web scrapers can cut data collection time by 30–40%, transcription software can turn hours of interviews into text in minutes, and reference managers can format hundreds of citations with a click. The result? Faster, more accurate, and more impactful research—whether you’re in business, academia, or somewhere in between.
How We Selected the Top Tools for Research Analysis
With so many options out there, how did I narrow it down to these 25? Here’s my approach:
- Popularity and Proven Use: These tools are trusted by professionals and academics worldwide. Many are industry standards.
- Unique Features: Each tool brings something special—AI-driven automation, advanced analytics, or unbeatable ease of use.
- Ease of Use: I included both beginner-friendly tools and advanced platforms, because the best tool is the one you’ll actually use.
- Integration: The best tools play well with others—think seamless exports, API access, or direct connections to your favorite apps.
- Value for Money: From free open-source gems to premium enterprise solutions, there’s something here for every budget.
I also leaned on user reviews, expert opinions, and my own experience in SaaS and automation. Whether you’re a solo researcher or part of a large team, technical or non-technical, you’ll find tools here that can supercharge your workflow.
1. Thunderbit
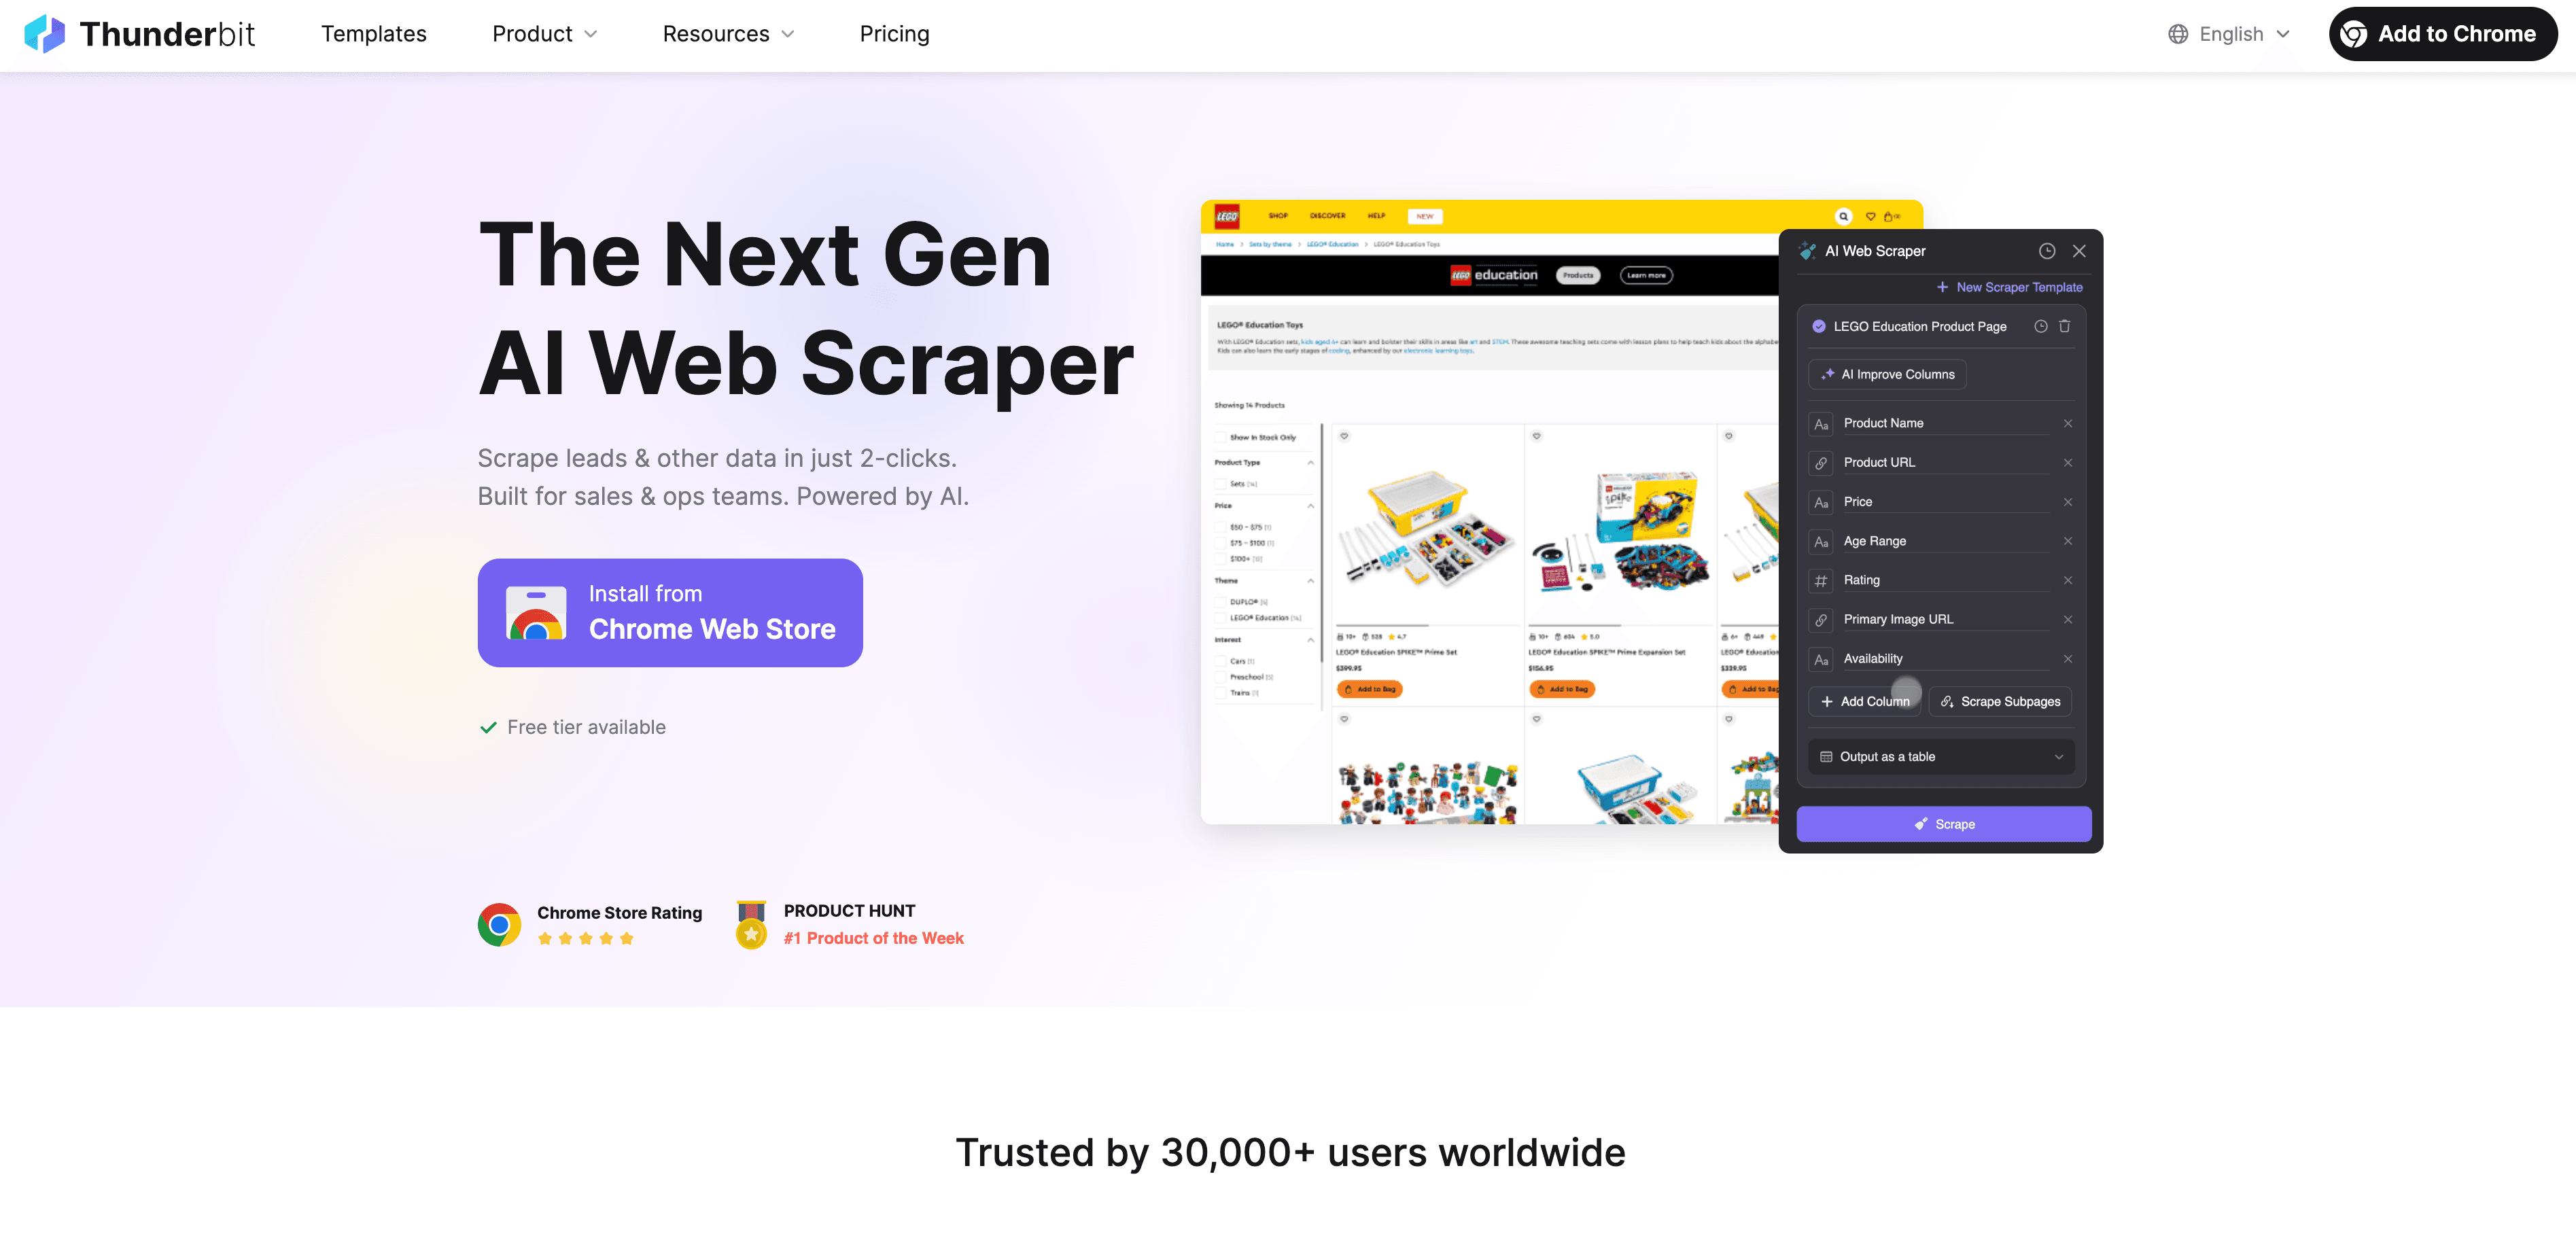
Thunderbit is my go-to for AI-powered web data extraction. As someone who’s spent years building automation tools, I can say Thunderbit is a game-changer for anyone who needs to collect research data from the web—especially if you don’t want to mess with code or complicated templates.
What makes Thunderbit stand out? It’s all about simplicity and power. With just two clicks—“AI Suggest Fields” and “Scrape”—Thunderbit’s AI reads any website, figures out the structure, and spits out clean, structured data. Need to scrape paginated lists or follow links to subpages? Thunderbit handles it. Want to export to Excel, Google Sheets, Airtable, or Notion? That’s free and instant.
Thunderbit is perfect for sales teams gathering leads, ecommerce analysts tracking competitors, or researchers collecting data from niche sites. And because it’s a Chrome extension, you can use it anywhere, in 34 languages. The credit-based pricing is flexible (free for small jobs, affordable for heavy users), and all features are included at every tier. For anyone who’s ever lost hours to copy-paste purgatory, Thunderbit is a breath of fresh air.
Try Thunderbit AI Web Scraper for Free
2. NVivo
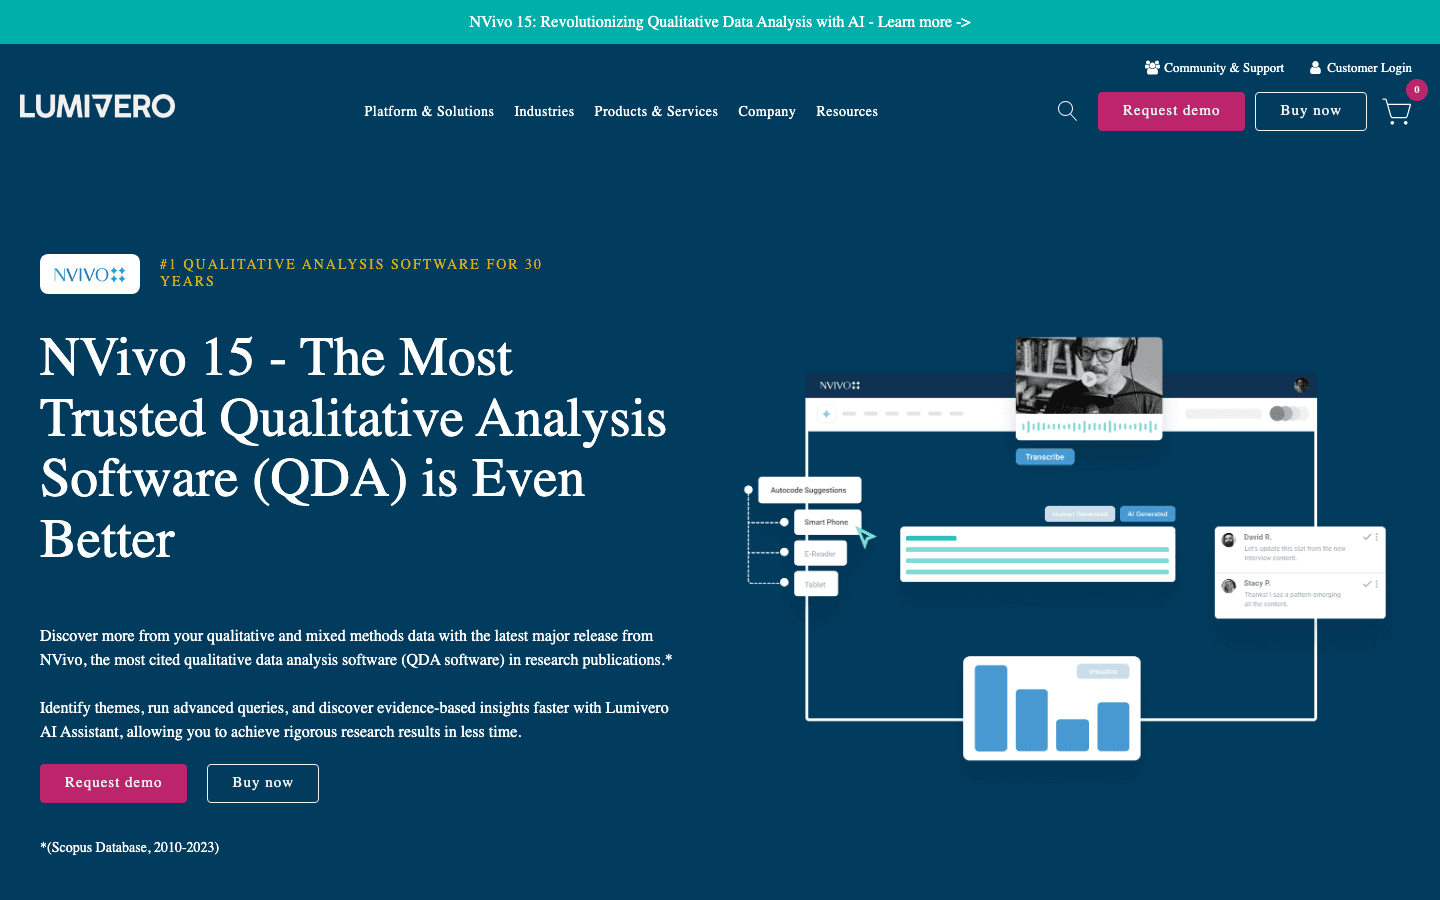
NVivo is the gold standard for qualitative data analysis. If you’re working with interviews, focus groups, or open-ended survey responses, NVivo lets you code, organize, and analyze your data with surgical precision. Its AI-assisted features can auto-code sentiment or themes, and its Collaboration Cloud makes teamwork a breeze. NVivo is a must-have for social scientists, market researchers, and anyone tackling complex qualitative projects.
3. MAXQDA
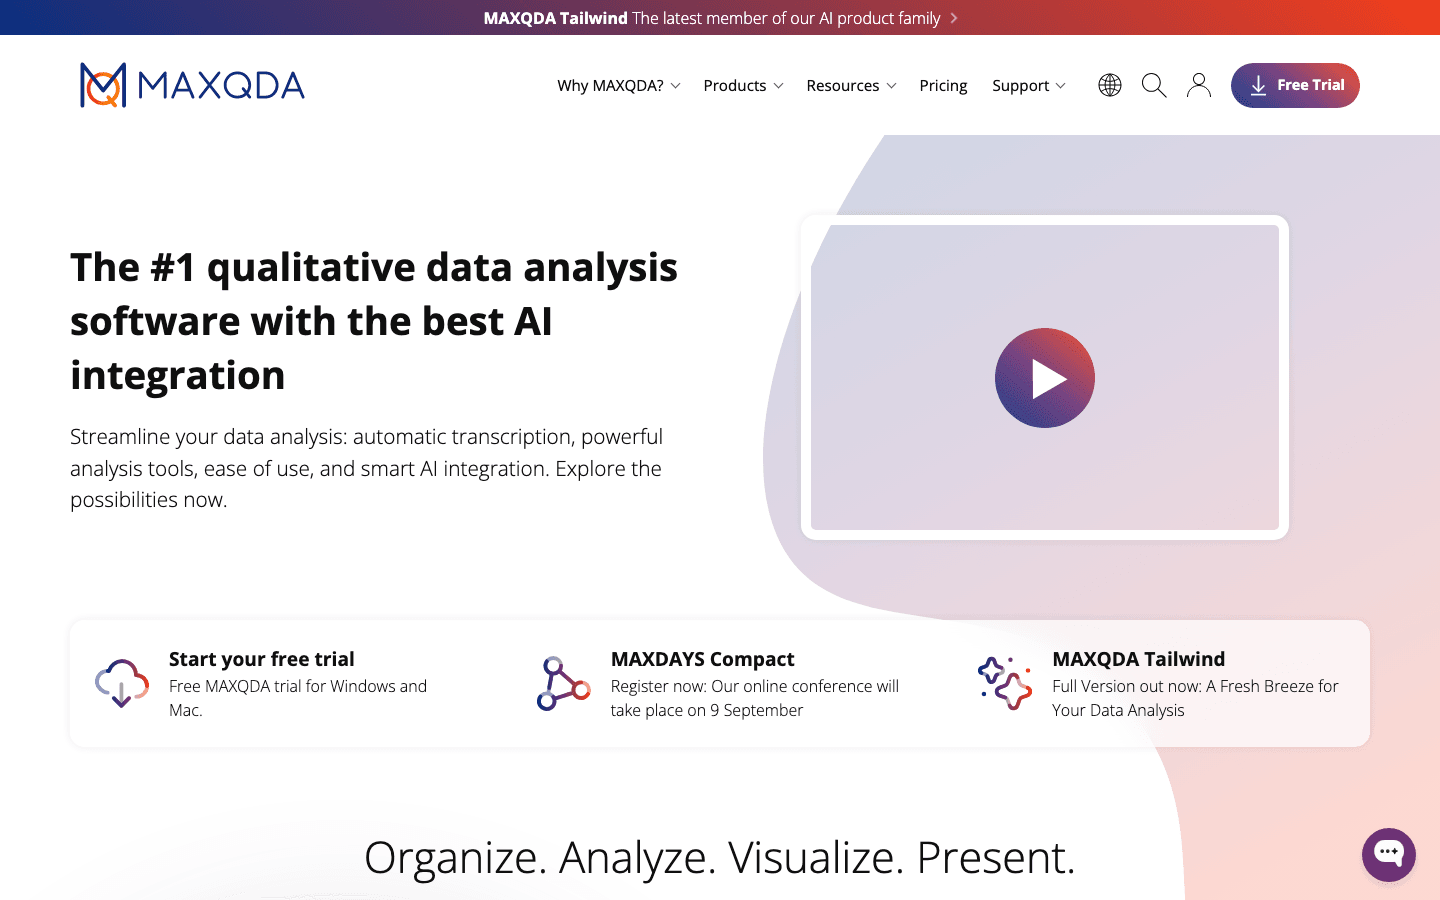
MAXQDA is another powerhouse for qualitative and mixed-methods research. It’s known for its intuitive interface, robust visualization tools (think word clouds, concept maps), and seamless integration of quantitative data. MAXQDA’s Stats module lets you run statistical tests on your coded data, making it a favorite for researchers who want to bridge the gap between qual and quant.
4. ATLAS.ti
ATLAS.ti is all about deep coding and visualization. Its network diagrams and AI-powered auto-coding help you see relationships and patterns in your data. The web-based platform enables real-time collaboration, and its reporting tools make it easy to share insights. If you love mapping out complex ideas and want a “Photoshop for networks,” ATLAS.ti is your tool.
5. Qualtrics
Qualtrics is the Cadillac of survey platforms. It’s built for large-scale, complex surveys with advanced logic, analytics, and automation. From customer experience to academic research, Qualtrics handles everything—distribution, panel management, and even predictive analytics. It’s not cheap, but for organizations that need enterprise-grade survey power, it’s worth every penny.
6. SurveyMonkey
SurveyMonkey is the go-to for quick, user-friendly surveys. Its drag-and-drop builder, template library, and real-time analytics make it perfect for collecting feedback fast. While it doesn’t have all the bells and whistles of Qualtrics, it’s ideal for small businesses, nonprofits, or anyone who wants results without a learning curve.
7. Dedoose
Dedoose brings qualitative and mixed-methods analysis to the cloud. Its real-time collaboration features are a lifesaver for remote teams, and it excels at integrating qualitative coding with quantitative attributes. If you’re working with a distributed team or juggling both numbers and narratives, Dedoose is a smart pick.
8. Google Scholar
Google Scholar is the essential search engine for academic research. It helps you find scholarly articles, track citations, and set up alerts for new publications. With one-click exports to reference managers, Google Scholar is the backbone of any literature review.
9. EndNote
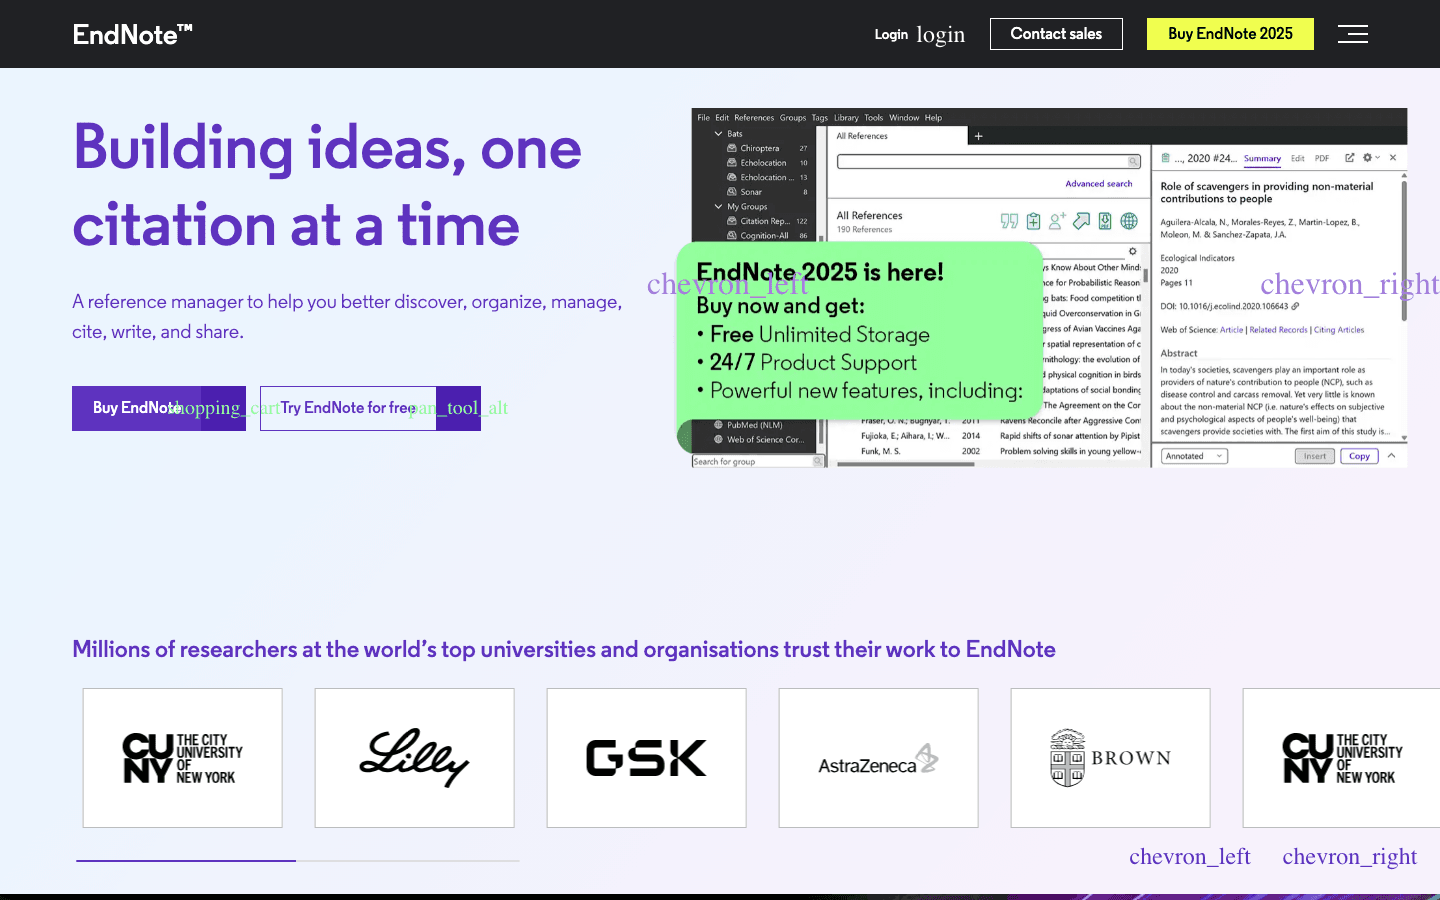
EndNote is a robust reference manager built for large projects and collaboration. Its Cite-While-You-Write plugin for Word, PDF annotation, and library sharing features make it a staple for academics and research teams handling thousands of citations.
10. Mendeley
Mendeley is a free reference manager with a social twist. Organize your PDFs, annotate them, and connect with other researchers. Its cloud sync and group features make collaboration easy, and its recommendation engine helps you discover new papers.
11. Zotero
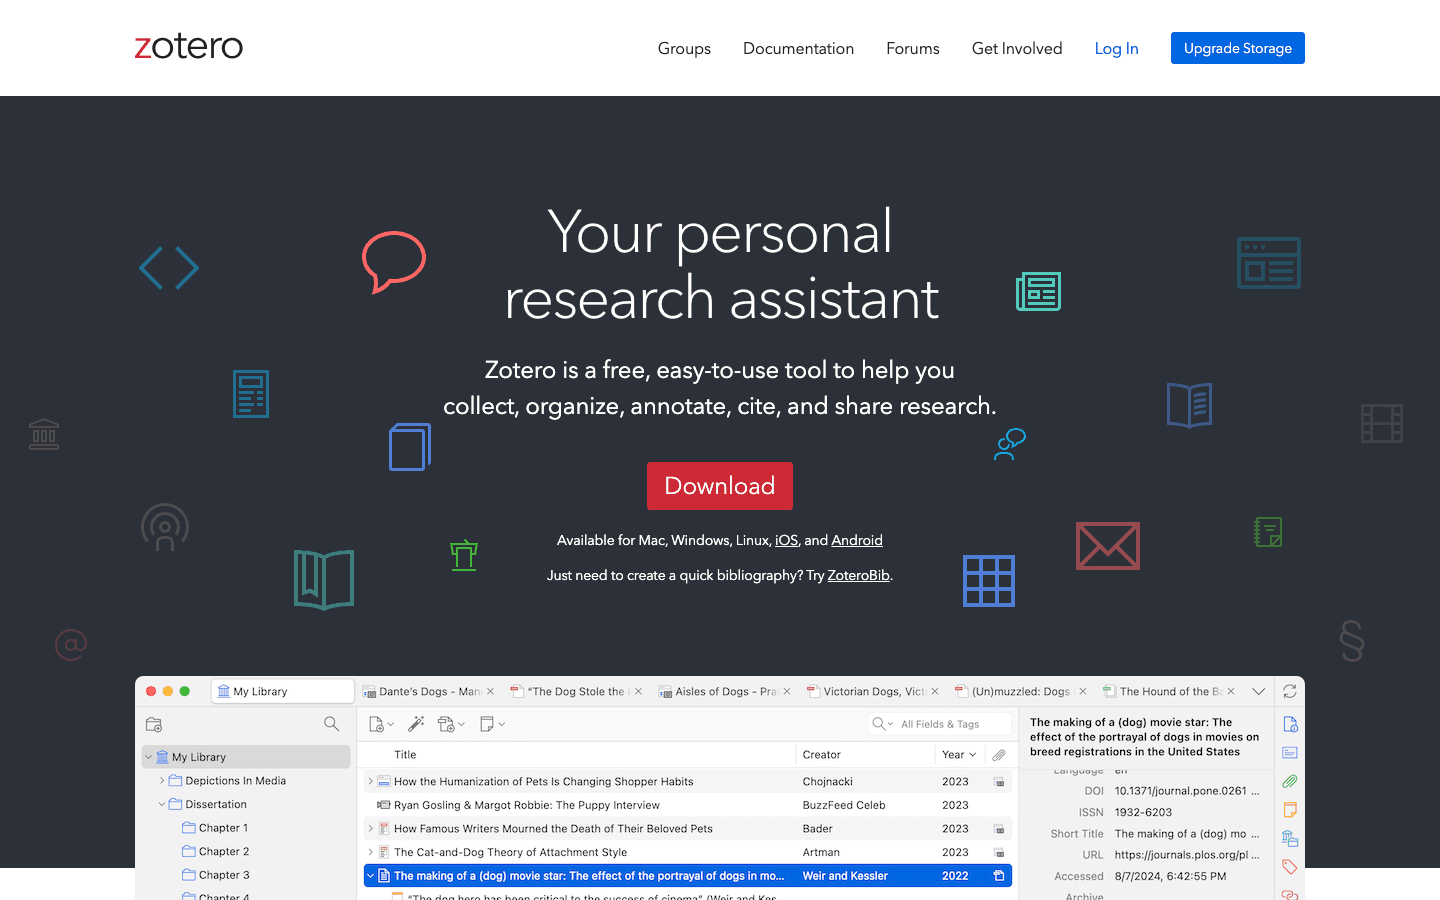
Zotero is the open-source hero of reference management. With one-click capture from your browser, group libraries, and plugins for Word and Google Docs, Zotero is perfect for budget-conscious researchers and anyone who values flexibility and data ownership.
12. RefWorks
RefWorks is a cloud-based reference manager often provided by universities. It’s designed for team sharing and integrates smoothly with academic databases and word processors. If your institution offers RefWorks, it’s a great way to keep your bibliography organized and collaborative.
13. Tableau
Tableau is the king of interactive data visualization. Its drag-and-drop dashboard builder, ability to blend multiple data sources, and rich interactivity make it a favorite for business analysts and researchers alike. Tableau turns complex data into compelling stories you can share with anyone.
14. R Studio
R Studio is the premier IDE for R, the go-to language for statistical computing. With thousands of packages, R Studio supports everything from basic stats to advanced machine learning and reproducible reporting. If you’re comfortable with code and want maximum flexibility, R Studio is your playground.
15. IBM SPSS Statistics
IBM SPSS Statistics is a trusted workhorse for statistical analysis, especially in the social sciences. Its point-and-click interface makes complex stats accessible, and its output is detailed and publication-ready. SPSS is perfect for survey data, experiments, and anyone who prefers menus over code.
16. Microsoft Excel
Microsoft Excel is the Swiss Army knife of data analysis. From data entry and cleaning to pivot tables and basic stats, Excel is everywhere. It’s not built for big data or advanced modeling, but for small-to-medium projects, it’s indispensable.
17. SAS
SAS is the enterprise giant of statistical analysis. It’s built for large-scale, regulated, or mission-critical research—think healthcare, finance, or government. SAS is powerful, reliable, and integrates with everything, but it does come with a steeper learning curve (and price tag).
18. MATLAB
MATLAB is the go-to for numerical computing, modeling, and simulation. Engineers and scientists love its matrix-centric language, extensive toolboxes, and top-notch visualization. If your research involves heavy math or simulations, MATLAB is a must.
19. STATA
STATA is beloved by economists and social scientists for its streamlined data management, statistics, and graphics. Its consistent syntax and reproducibility features make it easy to share and replicate analyses. STATA is ideal for panel data, surveys, and longitudinal studies.
20. NVivo Transcription
NVivo Transcription brings AI-powered audio transcription to qualitative research. Upload your interviews or focus groups, and get accurate, timestamped transcripts in minutes. It integrates directly with NVivo, saving you hours of manual typing.
21. SurveyGizmo (Alchemer)
SurveyGizmo (Alchemer) offers flexible, customizable online surveys with advanced logic and workflow integration. It’s perfect for researchers who need more control than SurveyMonkey but don’t require the full enterprise heft of Qualtrics.
22. Microsoft Power BI
Microsoft Power BI is Microsoft’s answer to interactive dashboards and business intelligence. With seamless integration into the Microsoft ecosystem, Power BI makes it easy to connect, transform, and visualize data from multiple sources.
23. Datawrapper
Datawrapper is the journalist’s favorite for quick, beautiful charts and maps. No coding required—just paste your data, choose a chart type, and embed or download the result. It’s perfect for making your research findings visually compelling.
24. Knime
Knime is a no-code, drag-and-drop platform for data analytics and workflow automation. Build end-to-end pipelines, integrate machine learning, and automate repetitive tasks—all without writing a line of code. Knime is ideal for non-technical teams who want to harness the power of data science.
25. Gephi
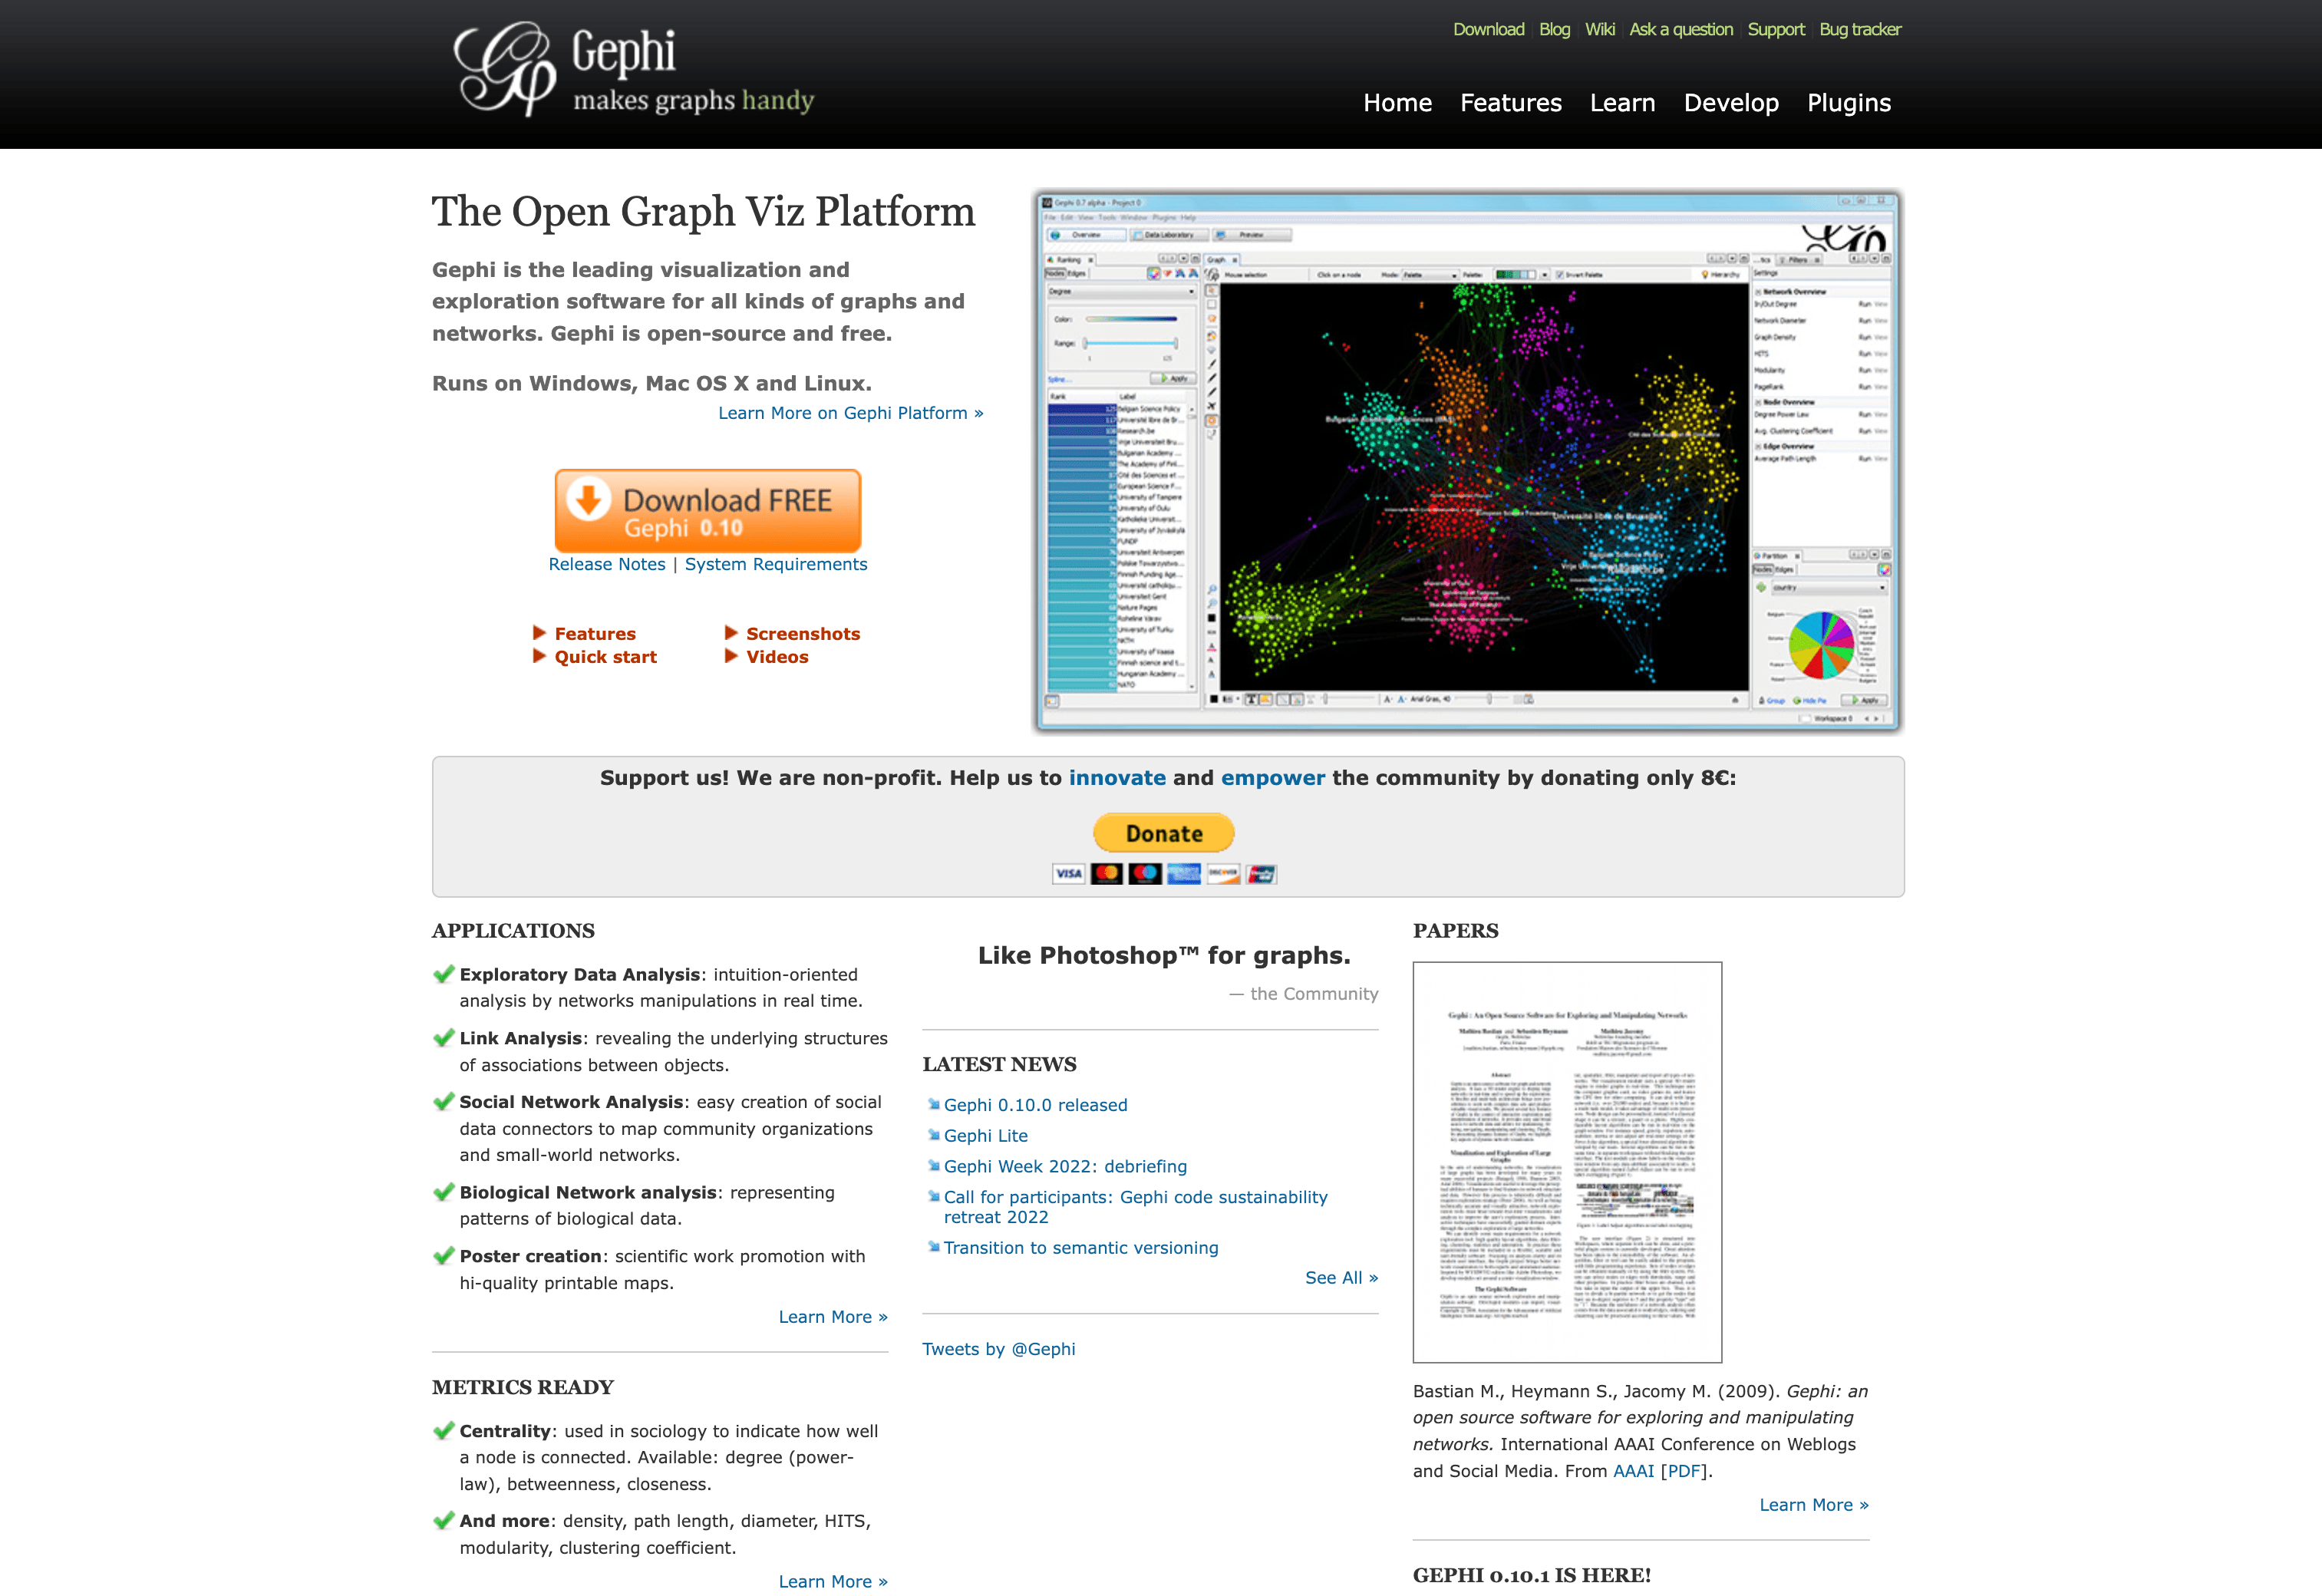
Gephi is the open-source tool for network analysis and visualization. If your research involves mapping relationships—social networks, citation networks, or biological systems—Gephi’s interactive layouts and metrics make it easy to spot clusters, influencers, and hidden patterns.
Tools for Research Analysis: Feature Comparison Table
Here’s a quick side-by-side look at these 25 tools:
| Tool Name | Primary Function | Best For | Key Features | Pricing | Ease of Use | Integration |
|---|---|---|---|---|---|---|
| Thunderbit | AI web data extraction | Web data collection | 2-click AI scraping, subpage, export to Sheets | Freemium | Very easy | Excel, Sheets, Notion, Airtable |
| NVivo | Qualitative data analysis | Text/audio coding | Auto-coding, mixed methods, collaboration | Paid | Moderate | Word, SurveyMonkey, EndNote |
| MAXQDA | Qualitative/mixed methods analysis | Visualization, quant integration | Stats module, word clouds, concept maps | Paid | Moderate | SPSS, Excel, project sharing |
| ATLAS.ti | Qualitative coding/visualization | Network mapping | AI auto-coding, network diagrams, web collab | Paid | Moderate/Hard | Word, PDF, cloud sync |
| Qualtrics | Survey design/analytics | Complex, large-scale surveys | Advanced logic, analytics, panel management | Paid | Moderate | Salesforce, Tableau, Slack |
| SurveyMonkey | Online surveys | Quick feedback | Templates, real-time analytics, easy sharing | Freemium | Very easy | MailChimp, Google Sheets |
| Dedoose | Cloud qual/mixed methods | Team collaboration | Real-time coding, quant-qual charts | Paid | Easy/Moderate | Excel, Word, browser-based |
| Google Scholar | Academic search | Literature reviews | Citation tracking, alerts, one-click export | Free | Very easy | EndNote, Zotero, library links |
| EndNote | Reference management | Large projects, collaboration | Cite-While-You-Write, PDF annotation, sharing | Paid | Moderate | Word, Web of Science |
| Mendeley | Reference manager/social network | PDF organization, discovery | Free cloud sync, group features, recommendations | Free | Easy | Word, BibTeX, APIs |
| Zotero | Open-source reference management | Budget-conscious, open workflows | Browser capture, group libraries, plugins | Free | Easy | Word, Google Docs, BibTeX |
| RefWorks | Cloud reference manager | Institutional, team sharing | Web-based, folder sharing, citation plugins | Institutional | Easy | Library databases, Word, Docs |
| Tableau | Data visualization | Interactive dashboards | Drag-and-drop, multi-source, storytelling | Paid | Moderate | Excel, CSV, web, server sharing |
| R Studio | Statistical computing (IDE) | Advanced stats, reproducibility | R Markdown, packages, code editor | Free | Hard | Git, APIs, databases |
| IBM SPSS | GUI stats analysis | Social science, survey data | Point-and-click, syntax, detailed output | Paid | Easy | Excel, CSV, Python/R add-ons |
| Microsoft Excel | Spreadsheet/data analysis | Entry, cleaning, small analysis | Formulas, pivot tables, charts, add-ins | Paid | Very easy | Office, Power BI, manual integration |
| SAS | Enterprise stats/data management | Large, regulated research | Programming, advanced stats, high performance | Paid | Hard | Databases, Python, R, batch jobs |
| MATLAB | Numerical computing/simulation | Engineering, science, modeling | Matrix ops, toolboxes, Simulink, 2D/3D plots | Paid | Moderate | Python, Java, hardware integration |
| STATA | Integrated stats/data management | Economics, panel data | All-in-one, reproducibility, user-contrib. cmds | Paid | Moderate | Excel, CSV, Python, TeX |
| NVivo Transcription | Automated audio transcription | Qualitative researchers | AI speech-to-text, timestamps, NVivo integration | Paid add-on | Very easy | NVivo, text export |
| SurveyGizmo | Customizable online surveys | Complex logic, branding | Advanced logic, workflow integration, API | Paid | Easy/Moderate | Salesforce, Mailchimp, Zapier |
| Power BI | BI/dashboarding | Interactive reports, MS stack | Power Query, real-time, cross-filtering | Freemium | Moderate | Excel, Azure, Teams, web embedding |
| Datawrapper | Quick charts/maps | Publishing, journalism | Paste data, responsive charts, easy embedding | Free | Very easy | Google Sheets, iframe, image/PDF |
| Knime | No-code analytics/automation | Workflow automation, non-coders | Drag-and-drop, ML, R/Python integration | Free | Moderate | Databases, CSV, R/Python, server |
| Gephi | Network analysis/visualization | Social/citation networks | Interactive layouts, metrics, export high-res | Free | Easy/Moderate | GraphML, CSV, image export |
How to Choose the Best Tools for Research Analysis for Your Needs
Picking the right tools can feel overwhelming, but here are some tips:
- Know Your Data: Are you working with text, numbers, networks, or a mix? Choose tools that fit your data type—qualitative, quantitative, or both.
- Consider Your Skills: Not a coder? Lean toward no-code or GUI tools like Thunderbit, SPSS, or KNIME. Comfortable with code? R Studio or Python unlock advanced possibilities.
- Think Integration: Make sure your tools can talk to each other. Export formats, APIs, and direct integrations save you headaches down the line.
- Budget Wisely: There are fantastic free tools (Zotero, KNIME, Gephi) and premium solutions (NVivo, Tableau). Many universities and companies offer site licenses—check before you buy.
- Test Drive: Almost every tool here offers a free trial or community edition. Run a small project to see what fits your workflow.
- Plan for Collaboration: If you’re working with a team, prioritize cloud-based or sharing-friendly tools like Dedoose, RefWorks, or Google Scholar’s group features.
Often, the best approach is a stack: collect data with Thunderbit, analyze it in R Studio or SPSS, visualize with Tableau or Power BI, and manage your sources in Zotero or EndNote.
Explore more research analysis guides Get Started Free
Conclusion: Empower Your Research with the Right Tools for Research Analysis
The right tools for research analysis don’t just make your life easier—they make your research better. They free you from grunt work, reduce errors, and let you focus on what matters: asking bold questions and finding meaningful answers. Whether you’re scraping web data with Thunderbit, coding interviews in NVivo, or dazzling your stakeholders with a Power BI dashboard, investing in the right toolkit is an investment in your impact.
So, experiment, mix and match, and build your own research analysis arsenal. And if you’re ready to see what AI-powered data collection looks like, give Thunderbit a try—your future self (and your research deadlines) will thank you.
Start AI-Powered Data Collection with Thunderbit
Want more tips and deep dives? Check out the Thunderbit Blog for guides on scraping, data analysis, and the latest in research tech.
FAQs
1. What are the most essential tools for research analysis in 2025?
The essentials depend on your workflow, but most researchers benefit from a combination of data collection (Thunderbit, Qualtrics), analysis (NVivo, R Studio, SPSS), visualization (Tableau, Power BI), and reference management (Zotero, EndNote).
2. How do I choose between qualitative and quantitative analysis tools?
If you’re working with interviews, open-ended surveys, or text, go for qualitative tools like NVivo, MAXQDA, or Dedoose. For numerical data, experiments, or surveys with closed questions, quantitative tools like SPSS, R Studio, or STATA are better.
3. Can I use multiple tools together in my research workflow?
Absolutely! Most professionals use a stack—collect data with Thunderbit, analyze in SPSS or R, visualize in Tableau, and manage citations in Zotero. Look for tools with good export/import options.
4. Are there free tools for research analysis that are actually good?
Yes! Zotero, KNIME, Gephi, R Studio, and Datawrapper are all free (or have generous free tiers) and are widely used by researchers and professionals.
5. What makes Thunderbit unique among research analysis tools?
Thunderbit is the only tool on this list focused on AI-powered web data extraction. Its 2-click workflow, “AI Suggest Fields,” and seamless export options make it the easiest way for non-technical users to collect structured research data from any website.
Happy researching—and may your data always be clean, your citations accurate, and your insights actionable.
Try Thunderbit AI Web Scraper for Research Analysis Get Started Free