Tracking stock prices shouldn’t feel like chasing a moving target with a butterfly net. Yet, for so many investors and business teams, keeping up with the market means endless copy-pasting, browser tab juggling, and the occasional “Wait, is this price from today or last week?” moment. Google Sheets has become the go-to tool for building live dashboards and collaborative trackers, but the real magic happens when you can pull stock prices into Google Sheets instantly—no manual work, no stale data, and no more spreadsheet-induced headaches.
I’ve spent years in SaaS and automation, and I’ve seen firsthand how the right setup can turn a boring spreadsheet into a real-time command center for financial decisions. Whether you’re an individual investor, a sales leader keeping tabs on competitors, or part of a finance team reporting to the C-suite, having up-to-date stock data at your fingertips is a serious edge. Let’s dive into the best ways to automate stock price tracking in Google Sheets, from classic formulas to AI-powered scraping with Thunderbit, and even some custom scripting for the power users out there.
What Does It Mean to Pull Stock Price into Google Sheets?
When we talk about “pulling stock price into Google Sheets,” we mean automatically fetching the latest stock prices (and related data) from the web and having them show up in your spreadsheet—no manual copy-paste, no refreshing finance websites, just live data where you need it. In plain English: your spreadsheet becomes a living window to the market.
Why is this a big deal? Because it transforms a static table into a dynamic dashboard. Imagine your portfolio tracker updating itself throughout the trading day, or your team’s sales dashboard flagging a competitor’s sudden price drop in real time. That’s not just convenient—it’s a game-changer for decision-making speed and accuracy. And the best part? You don’t need to be a coder to make it happen.
Scrape Stock Prices into Google Sheets Instantly Get Started Free
Why Pulling Stock Price into Google Sheets Matters for Business Users
It’s not just day traders and finance nerds who care about live stock data. Here’s how business teams are using Google Sheets for stock tracking—and why it matters:
| Use Case | Business Value |
|---|---|
| Portfolio Monitoring (Finance Teams) | Real-time portfolio value, instant reporting, faster rebalancing decisions |
| Competitor Monitoring (Sales/BD) | Early warning on competitor moves, proactive sales strategy adjustments |
| Supplier Risk (Operations) | Early detection of supplier trouble, better contingency planning |
| Market Research (Strategy/Execs) | Up-to-date market pulse, smarter forecasting and planning |
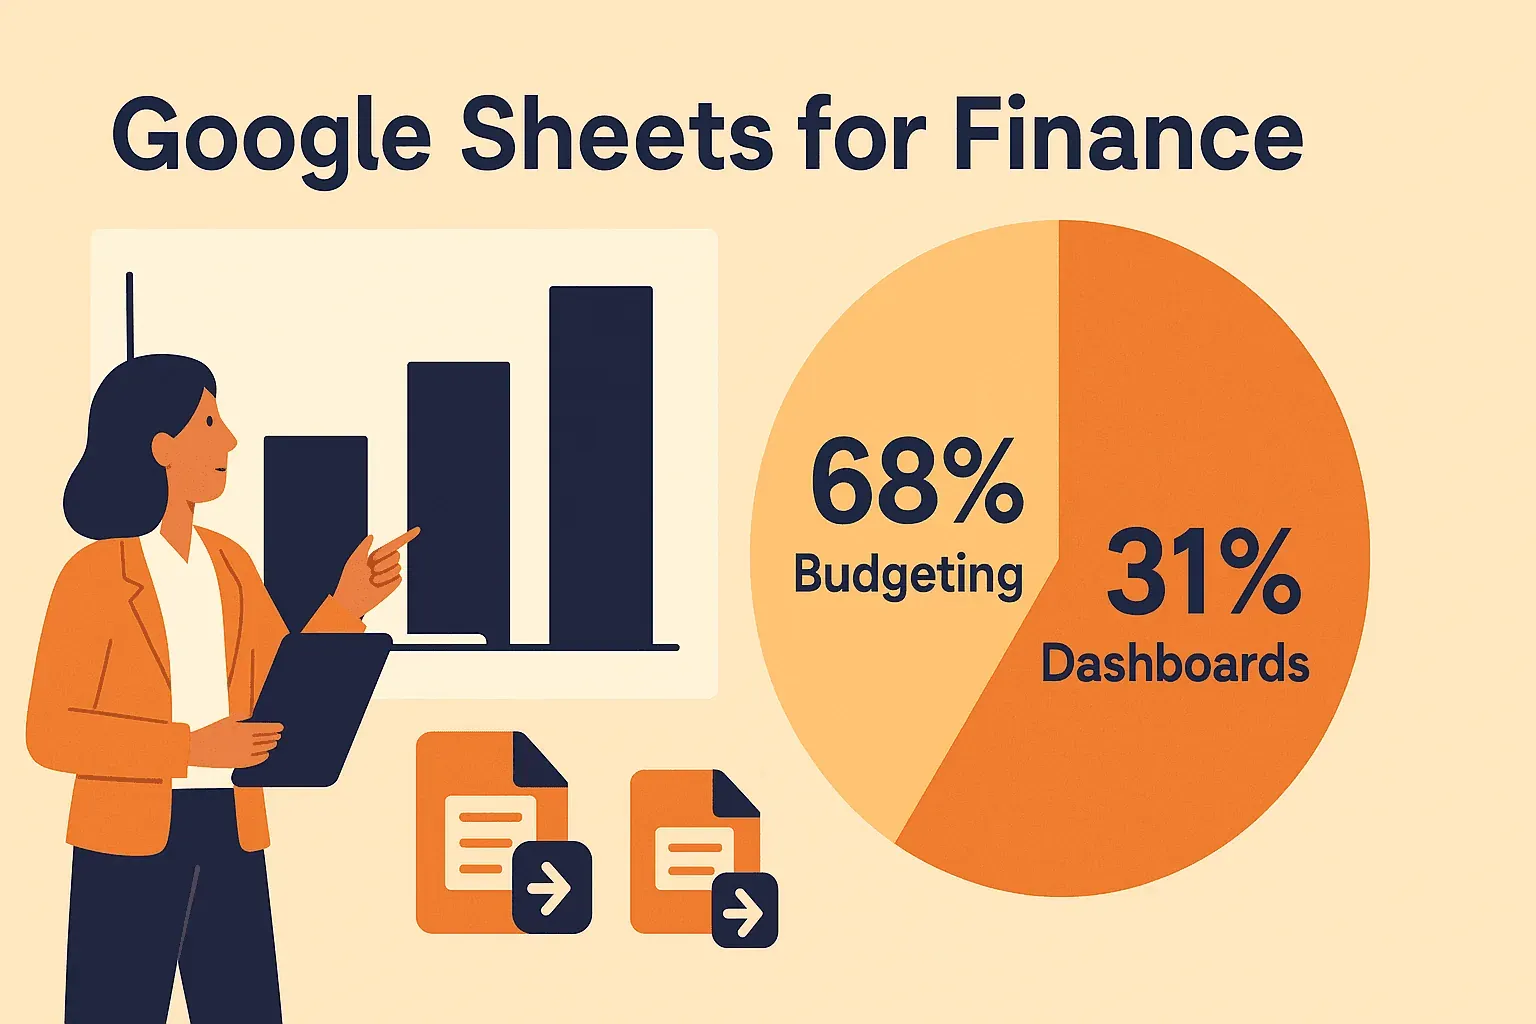
It’s no wonder that 68% of Google Sheets users rely on it for budgeting and financial tracking, and 31% of finance pros use Sheets for real-time dashboards. When you automate the flow of stock prices into your Sheet, you’re not just saving time—you’re making your whole team smarter and faster.
The Classic Way: Use Google Finance Function to Pull Stock Price into Google Sheets
Let’s start with the old reliable: the GOOGLEFINANCE function. This built-in formula lets you pull stock prices and other data straight into your spreadsheet, no add-ons required.
How to Use GOOGLEFINANCE in Google Sheets
The basic syntax is:
=GOOGLEFINANCE("ticker", "attribute")
"ticker"is your stock symbol (e.g.,"AAPL"for Apple,"GOOG"for Alphabet)."attribute"is what you want (e.g.,"price","volume","changepct").
Example:
To get Apple’s current price, just enter:
=GOOGLEFINANCE("AAPL", "price")
Want to track multiple stocks? Put your tickers in column A (A2, A3, etc.), then in B2 use:
=GOOGLEFINANCE(A2, "price")
…and drag down. You can add more columns for other attributes:
| Ticker | Price | Change % | Volume |
|---|---|---|---|
| AAPL | =GOOGLEFINANCE(A2,"price") | =GOOGLEFINANCE(A2,"changepct") | =GOOGLEFINANCE(A2,"volume") |
| MSFT | ... | ... | ... |
| GOOG | ... | ... | ... |
Pro tips:
- Freeze your header row for easy scrolling.
- Use conditional formatting to color-code gains/losses.
- Format columns as currency, percent, etc., for readability.
You can even pull historical data:
=GOOGLEFINANCE("AAPL", "close", DATE(2025,1,1), DATE(2025,12,31), "DAILY")
This gives you a table of daily closing prices for Apple in 2025.
Limitations of the GOOGLEFINANCE Function
As handy as it is, GOOGLEFINANCE isn’t perfect:
- Data Delay: Prices are usually delayed by up to 20 minutes. No after-hours or pre-market data.
- Coverage Gaps: Some international stocks, OTC equities, or crypto aren’t supported.
- Limited Data Types: No news headlines, analyst ratings, or deep financials—just the basics.
- Occasional Outages: Sometimes you’ll get
#N/Aor#REF!errors for no clear reason. - No Background Refresh: Data only updates when your Sheet is open.
- Scaling Issues: Large sheets with hundreds of formulas can get slow or hit Google’s hidden limits.
If you just need basic prices for major stocks, GOOGLEFINANCE is great. But if you want richer data, more automation, or need to cover unsupported tickers, it’s time to look at smarter tools.
Two-Step Setup: Pull Stock Price into Google Sheets Instantly with Thunderbit
Here’s where things get exciting. Thunderbit is an AI-powered web scraper Chrome Extension that lets you pull any data—including stock prices, news, and analysis—from any website straight into Google Sheets. No code, no templates, just a couple of clicks.
Pull Stock Prices into Google Sheets with Thunderbit
How to Instantly Pull Stock Prices with Thunderbit
Step 1: Install Thunderbit and Open Your Stock Page
- Add Thunderbit from the Chrome Web Store.
- Go to your favorite finance site (Yahoo Finance, MarketWatch, Google Finance, etc.) and open the page for the stock you want.
Step 2: Use Thunderbit’s AI to Scrape and Export
- Click the Thunderbit icon.
- Hit “AI Suggest Fields”—Thunderbit scans the page and recommends fields like “Current Price,” “Market Cap,” “P/E Ratio,” or even the latest news headline.
- Select the fields you want, click “Scrape,” and Thunderbit grabs the data.
- Click “Export,” choose Google Sheets, and your data lands in your spreadsheet—fully formatted, ready to analyze.
Want to track multiple stocks? Feed Thunderbit a list of URLs (e.g., Yahoo Finance pages for 10 tickers), and it’ll scrape them all at once. Need to keep your Sheet updated? Set up a scheduled scrape (e.g., every morning at 9 AM), and Thunderbit will refresh your data automatically—even if your Sheet is closed.
Comparing Thunderbit vs. GOOGLEFINANCE
| Aspect | GOOGLEFINANCE | Thunderbit |
|---|---|---|
| Data Coverage | Major stocks, basic fields only | Any website, any field (price, news, ratings, etc.) |
| Data Freshness | 15–20 min delay, no after-hours | As fresh as the source site (can include after-hours) |
| Automation | Updates only when Sheet is open | Scheduled scrapes, background updates |
| Ease of Setup | Just type a formula | 2-click AI setup, no code needed |
| Extra Info | No news, no sentiment | Scrape news headlines, analysis, even social sentiment |
| Reliability | Sometimes returns errors, quota limits | Adapts to most sites, robust to layout changes |
| Cost | Free | Free tier (6 pages), pay-as-you-go for heavy use |
Thunderbit is especially powerful when you need data that GoogleFinance can’t provide—like after-hours prices, analyst ratings, or the latest news headlines. And it’s a lifesaver for business users who want automation without writing scripts.
Advanced Customization: Use Google Apps Script for Stock Data Analysis
If you want to go full power-user, Google Apps Script lets you automate and customize Google Sheets with JavaScript. You can fetch data from APIs, run calculations, and even trigger alerts.
Example: Calculating Stock Volatility with Apps Script
Let’s say you want to calculate 30-day volatility for a stock. Here’s a simplified approach:
- Use
GOOGLEFINANCEto pull 31 days of closing prices into a hidden sheet. - Write an Apps Script to:
- Calculate daily returns.
- Compute the standard deviation of returns.
- Annualize volatility (
volatility = stdev * sqrt(252)). - Write the result into your dashboard.
- (Optional) Send an email alert if volatility exceeds a threshold.
Here’s a handy guide for doing this with formulas, or you can adapt the logic in Apps Script for more automation.
When to use Apps Script:
- You need custom metrics or calculations.
- You want to integrate with external APIs.
- You need automated alerts or workflows.
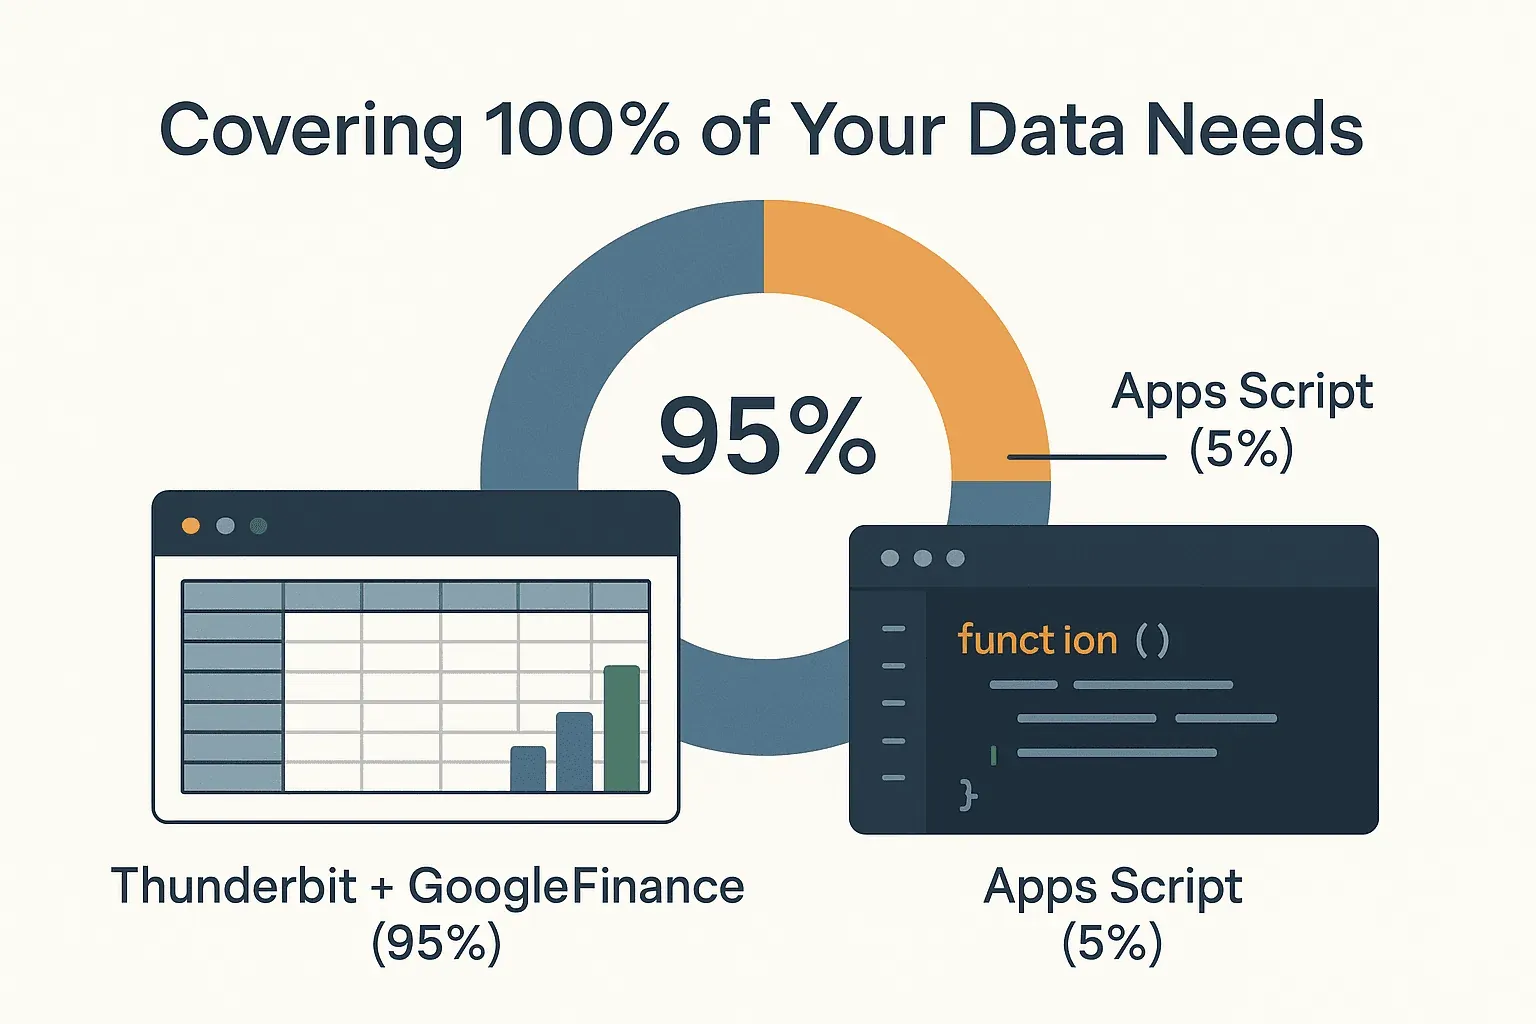
If you’re not a coder, Thunderbit and GoogleFinance will cover 95% of your needs. But for the other 5%, Apps Script is your secret weapon.
Thunderbit for Extra Insights: Scrape Stock News and Market Analysis into Google Sheets
Numbers only tell half the story. Sometimes you need to know why a stock is moving—news, analyst commentary, or even social sentiment. Thunderbit shines here.
How to Scrape Stock News and Analysis with Thunderbit
- Go to a stock’s page on Yahoo Finance (or similar).
- Use Thunderbit’s “AI Suggest Fields” and add fields for “Latest News Headline,” “Analyst Rating,” or anything else visible on the page.
- Scrape and export to Google Sheets.
- For multiple stocks, feed Thunderbit a list of URLs and let it pull prices and news for each.
Pro tip: Use Thunderbit’s Field AI Prompt to label news sentiment (“Positive,” “Negative,” “Neutral”) right as you scrape. Now your dashboard can flag not just price moves, but the stories driving them.
Practical Example: Building a Stock Dashboard with News & Analysis
Imagine a Sheet where each row is a stock, with columns for:
- Current price
- % change
- Latest news headline
- News sentiment
- Analyst rating
With Thunderbit, you can build this in minutes. Use conditional formatting to flag negative news, sparklines to show price trends, and dropdowns to filter by sector or sentiment. Suddenly, your Sheet is more than a tracker—it’s a decision-making hub.
How to Scrape Website Data into Excel using AI Get Started Free
Visualizing Stock Data in Google Sheets
Don’t let your hard-won data sit in a sea of numbers. Google Sheets offers plenty of ways to turn stock data into actionable visuals:
- Line Charts: Show price trends over time.
- Sparklines: Tiny trend charts right in your table.
- Conditional Formatting: Green for gains, red for losses—see movers at a glance.
- Dashboards: Use a summary sheet to pull key metrics, highlight top gainers/losers, and embed charts.
For more tips, check out this guide on making your stock tracker pop.
Troubleshooting: Common Issues When Pulling Stock Price into Google Sheets
Even the best setups hit snags. Here’s how to handle the most common headaches:
- GOOGLEFINANCE errors (
#N/A,#REF!): Double-check ticker symbols, reduce the number of formulas, and try refreshing your Sheet. If a stock isn’t supported, consider scraping with Thunderbit. - Data not updating: Remember, GoogleFinance only refreshes when your Sheet is open. For background updates, use Thunderbit’s scheduling.
- Thunderbit issues: If scraping fails, try switching between cloud and browser mode, or refine your field selection. For login-required sites, use browser mode.
- Quota limits: Thunderbit’s free tier is generous for light use, but heavy users may need to upgrade.
- Performance: Too much data can slow your Sheet. Pull only what you need, and archive old data as needed.
For more help, check out Thunderbit’s documentation, Google’s support forums, or the Thunderbit Blog.
Conclusion & Key Takeaways
Pulling stock prices into Google Sheets instantly is not just possible—it’s easier (and more valuable) than ever. Here’s what I recommend:
- Start with GOOGLEFINANCE for basic, quick-and-dirty tracking of major stocks.
- Use Thunderbit when you need richer data, automation, or want to pull prices, news, and analysis from any website—no code required.
- Leverage Apps Script for custom calculations, alerts, or integrating with external APIs.
- Visualize your data with charts, sparklines, and dashboards to turn numbers into insights.
- Automate everything you can—the ROI on time saved (and errors avoided) is huge.
Whether you’re building a personal portfolio tracker or a cross-team market dashboard, the right setup in Google Sheets can give you real-time visibility and a serious decision-making edge. And with tools like Thunderbit, you don’t need to be a spreadsheet wizard to make it happen.
Ready to ditch the manual updates and build your own live stock tracker? Download Thunderbit and see how easy it is to pull stock prices—and so much more—into Google Sheets. Your future self (and your team) will thank you.
Want more tips on web scraping, automation, and building smarter dashboards? Check out the Thunderbit Blog for deep dives and step-by-step guides.
FAQs
1. What’s the easiest way to pull stock price into Google Sheets?
The simplest way is to use the built-in GOOGLEFINANCE function. Just type =GOOGLEFINANCE("AAPL", "price") to get Apple’s current price. For more advanced needs, Thunderbit lets you scrape prices and news from any website into Sheets with just a couple of clicks.
2. Why isn’t my stock price updating in Google Sheets?
GOOGLEFINANCE data typically updates every 15–20 minutes and only when your Sheet is open. For background updates or more frequent refreshes, use Thunderbit’s scheduled scraping feature.
3. Can I pull after-hours or pre-market stock prices into Google Sheets?
GOOGLEFINANCE does not support after-hours or pre-market data. However, if your source website (like Yahoo Finance) displays it, Thunderbit can scrape and import that data into your Sheet.
4. How do I add stock news and analysis to my Google Sheet?
With Thunderbit, you can scrape not just prices but also news headlines, analyst ratings, and sentiment from finance websites. Just select the fields you want, scrape, and export to Google Sheets.
5. Is Thunderbit free to use for pulling stock prices into Google Sheets?
Thunderbit offers a free tier (scrape up to 6 pages, or 10 with a trial boost). For heavier use or scheduled automation, you may need to upgrade, but the pricing is affordable for most business users.
Ready to build your own real-time stock dashboard? Try Thunderbit for free and see how much time you can save. And if you get stuck, the Thunderbit Blog is packed with guides, tips, and inspiration. Happy tracking!
Try AI Web Scraper for Google Sheets Get Started Free