If you think your inbox is crowded now, just wait until you see the numbers for 2026. The world is sending and receiving nearly 400 billion emails every single day—and a huge chunk of that is newsletters fighting for a few seconds of your attention. As someone who’s spent years helping teams turn data into action, I’ve seen firsthand how understanding newsletter statistics—especially open rates and click-through rates—can be the difference between a campaign that gets results and one that gets lost in the noise.
Let’s dig into the latest newsletter engagement metrics, see how open rates and click-through rates are shifting across industries and regions, and talk about how you can actually use this data to boost your ROI. I’ll also show you how tools like Thunderbit can help you analyze, benchmark, and optimize your newsletter strategy—no data science degree required.
Try Thunderbit for Newsletter Benchmarking
Newsletter Statistics 2025–2026: Global Trends at a Glance
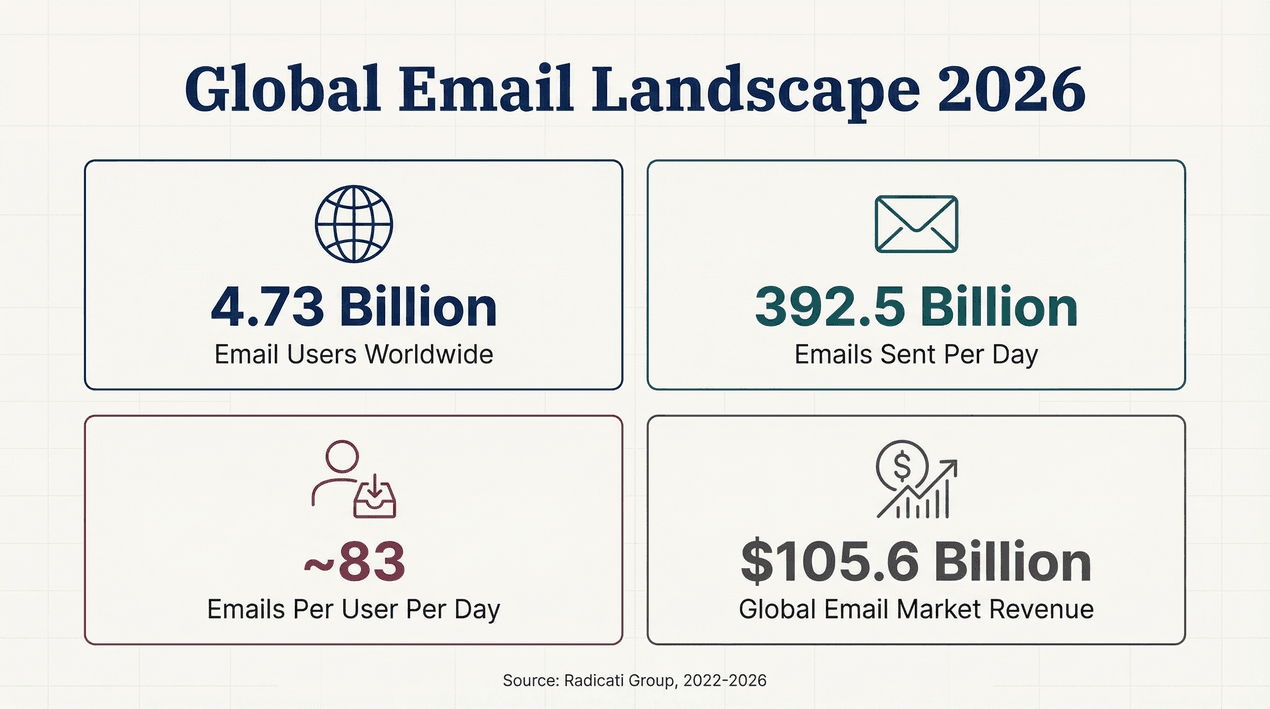
The scale of email in 2026 is honestly mind-blowing. According to Radicati’s latest report:
- Worldwide email users: 4.73 billion
- Daily email traffic: 392.5 billion emails/day
- Average emails per user per day: ~83
- Global email market revenue: $105.6 billion
But here’s the kicker: while the volume is up, attention is down. Marketers are battling for a shrinking slice of reader focus, and the old playbook for newsletter engagement just isn’t cutting it anymore.
Key Newsletter Metrics: 2025–2026 Benchmarks
| Source | Open Rate | Click Rate (CTR) | CTOR | Unsubscribe Rate | Notes |
|---|---|---|---|---|---|
| Brevo | 31.22% | 3.64% | (industry cut) | 0.40% | 44B emails, global, Apple MPP included |
| MailerLite | 43.46% | 2.09% | 6.81% | 0.22% | 3.6M campaigns, 181k accounts |
| Klaviyo | 31% (campaigns) | 1.69% (campaigns) / 5.58% (flows) | — | — | Flows = automated, higher engagement |
| Omnisend | 30.7% (campaigns) / 38% (automated) | — | — | — | Ecommerce focus, automation outperforms |
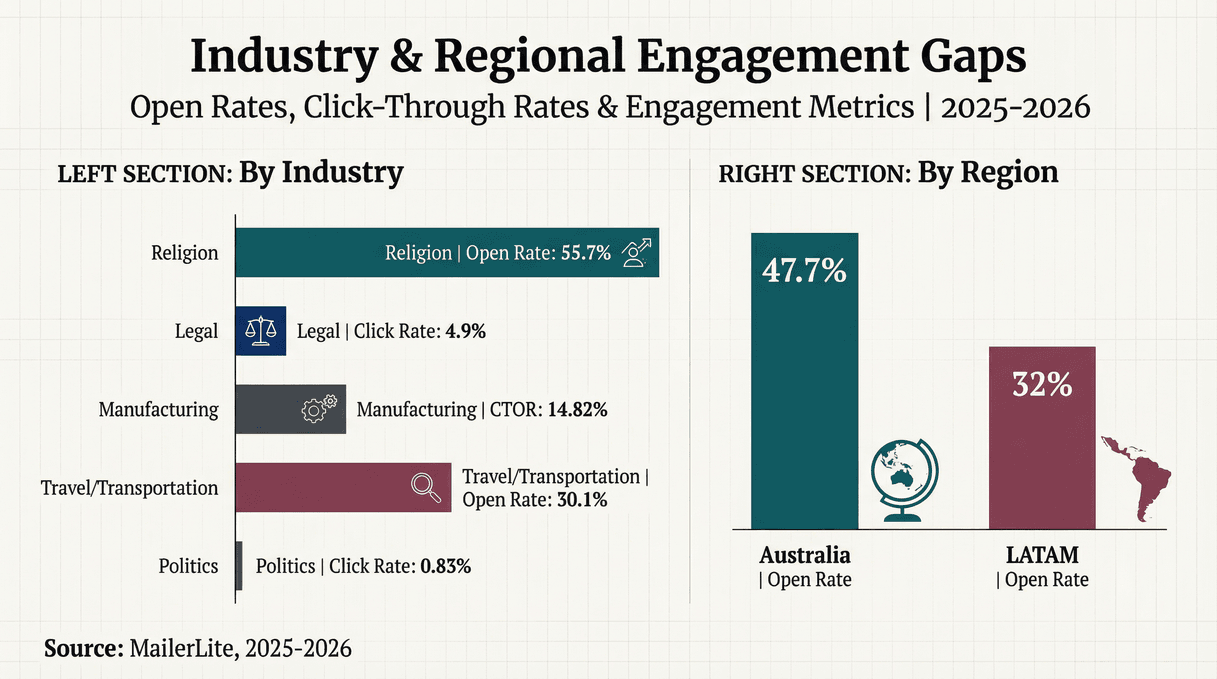
Industry and Region Gaps:
Open rates can swing from 30.1% in travel/transportation to 55.7% in religion. Click rates range from 0.83% in politics to 4.9% in legal. And regionally, Australia boasts a 47.7% open rate, while LATAM lags at 32%.
Top 10 Newsletter Statistics & Email Open Rates for 2026
Here are the headline stats every marketer, sales pro, and operations leader should know (and cite):
- Worldwide email users: 4.73 billion in 2026
- Global daily email traffic: 392.5 billion emails/day
- Average emails per user per day: ~83
- Email market revenue: $105.6 billion by 2026
- Median open rate (MailerLite): 43.46%
- Median click rate (MailerLite): 2.09%
- Brevo’s global open rate: 31.22%
- Klaviyo’s automated flow click rate: 5.58%
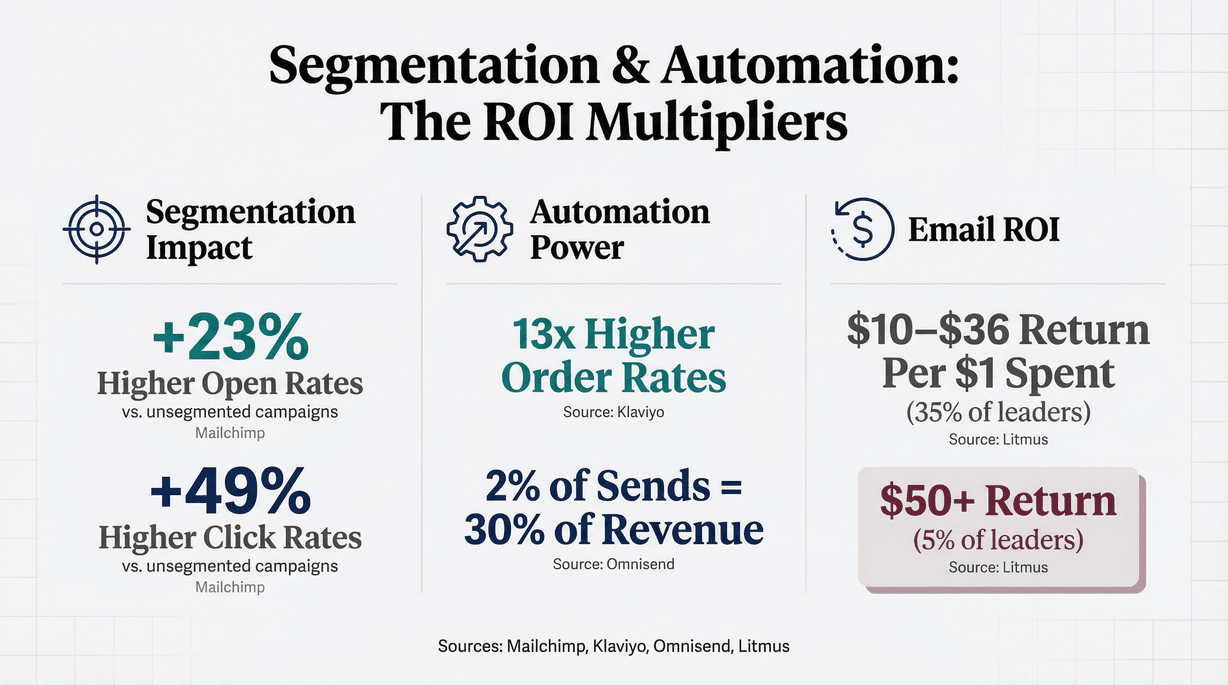
- Segmentation lift: Segmented campaigns see 23% higher open rates and 49% higher click rates than unsegmented.
- Email ROI: 35% of leaders report $10–$36 return per $1 spent; 5% see $50+.
Understanding Email Newsletter Open Rates: What Do They Really Mean?
Let’s clear up a common misconception: open rate isn’t as simple as “how many people read your email.” It’s usually measured as opens ÷ delivered emails, where an “open” is tracked when a tiny, invisible image loads in the recipient’s email client (Mailchimp). But here’s the catch: privacy changes—especially Apple Mail Privacy Protection (MPP)—mean a huge chunk of opens are now “fake” (triggered by Apple, not a real human).
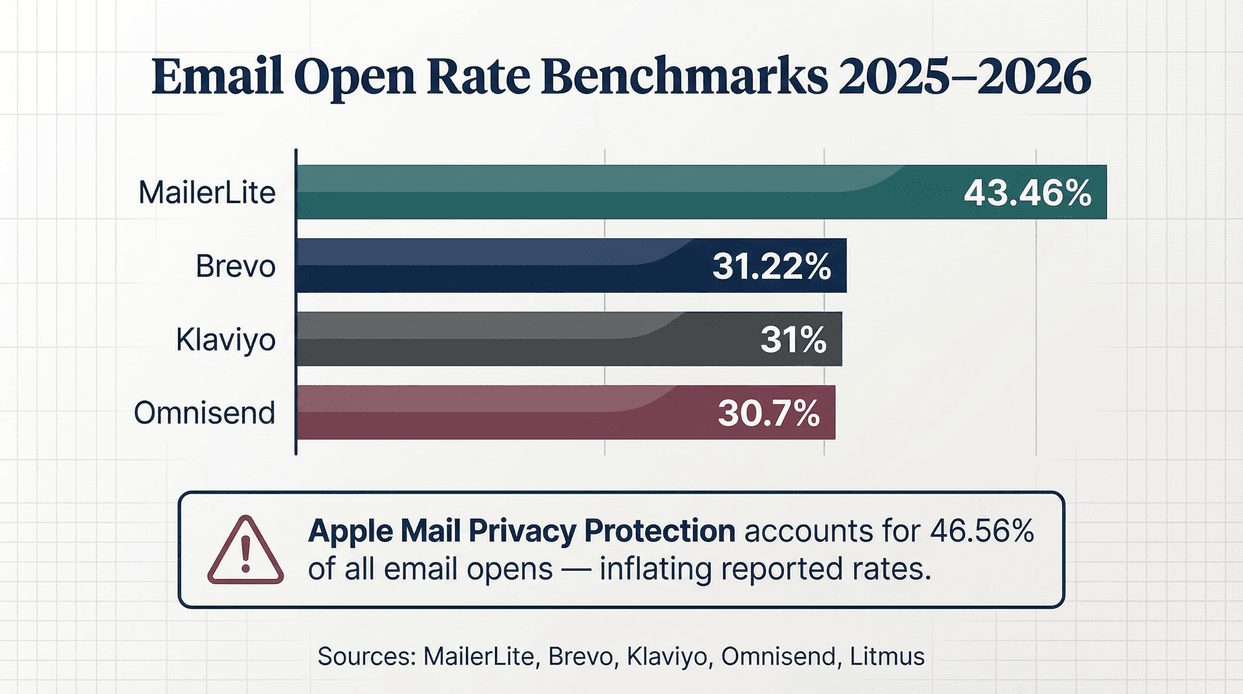
In fact, Apple accounts for 46.56% of all email opens, and most of those are artificially inflated. So, while open rate is still widely reported, it’s more of a “directional” metric these days—great for spotting trends, not so great for measuring true engagement.
Industry Benchmarks (2025–2026):
- MailerLite median open rate: 43.46%
- Brevo overall open rate: 31.22%
- Klaviyo campaign open rate: 31%
- Omnisend campaign open rate: 30.7%
Regional Standouts:
Australia leads with a 47.7% open rate, while LATAM is at 32%.
Why Email Newsletter Open Rates Matter for Your Business
Even with all the measurement noise, open rates still tell you something important: Is your subject line compelling? Is your list healthy? Are you landing in the inbox or the spam folder? In the marketing funnel, open rate is the first signal that your content is grabbing attention.
But here’s where it gets interesting: open rates are just the start. They reflect:
- Content appeal: Is your subject line worth clicking?
- Audience interest: Are you sending the right content to the right people?
- List quality: Are your subscribers engaged, or are you sending to a zombie list?
Actionable strategies to boost open rates:
- Test subject lines: A/B test for curiosity, urgency, or personalization.
- Clean your list: Remove inactive subscribers regularly.
- Segment your sends: Tailor content to audience interests—segmented campaigns see 23% higher opens.
- Optimize send times: Experiment with timing to catch your audience when they’re most likely to check email.
And always keep an eye on deliverability—if your open rate drops below 15%, check your inbox placement rate (Litmus).
Newsletter Engagement Metrics: Beyond the Open Rate
Open rates are just the tip of the iceberg. The real magic happens when subscribers actually interact with your content. Here are the metrics that matter in 2026:
- Click-Through Rate (CTR): Unique clickers ÷ delivered emails. The gold standard for engagement (MailerLite).
- Click-to-Open Rate (CTOR): Unique clickers ÷ unique openers. Shows how well your content converts interest into action (Campaign Monitor).
- Conversion Rate: Clickers who complete a desired action (purchase, signup, etc.).
- Unsubscribe Rate: The percentage of recipients who opt out—especially relevant now that Gmail and Yahoo have made unsubscribing a one-click affair (Google).
Industry Benchmarks (2025–2026):
| Industry Example | Open Rate | Click Rate | CTOR |
|---|---|---|---|
| Travel & Transportation | 30.10% | 1.12% | 3.72% |
| Religion | 55.71% | 3.13% | 6.98% |
| Politics | 33.20% | 0.83% | 2.96% |
| Legal | 43.92% | 4.90% | 11.16% |
| Manufacturing | 44.24% | 4.16% | 14.82% |
(Source: MailerLite)
What drives engagement?
- Content relevance: The closer your content matches subscriber interests, the higher your CTR and CTOR.
- Call-to-action (CTA) design: Clear, compelling CTAs drive clicks.
- Segmentation: Highly segmented campaigns outperform generic blasts—by a lot.
Newsletter Click-Through Rate: The Real Engagement Indicator
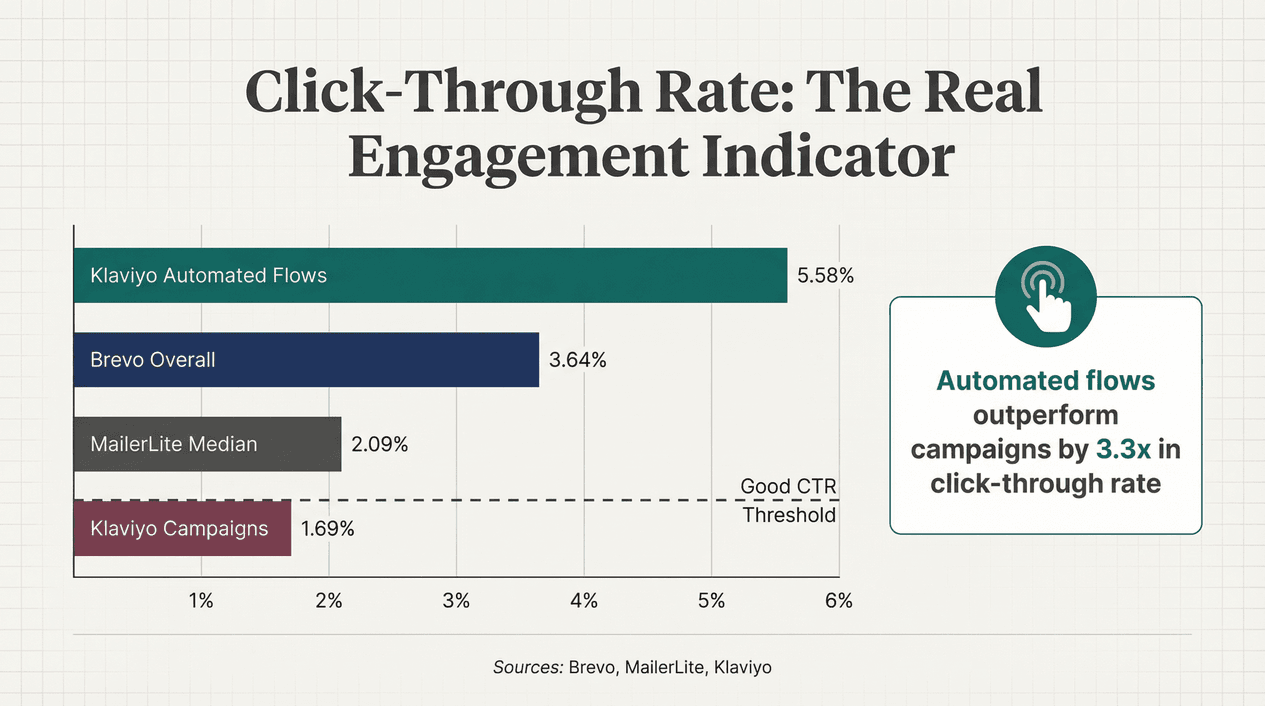
Let’s be real: clicks are where the action is. CTR is now the most accurate measure of newsletter engagement, especially with open rates getting fuzzier every year (MailerLite).
How is CTR calculated?
CTR = (Unique clickers ÷ delivered emails) × 100
Why does CTR matter?
- It’s a direct measure of interest: Did your content inspire action?
- It correlates with conversions: Higher CTR usually means more sales, signups, or whatever your goal is.
- It’s less affected by privacy changes: Clicks are harder to fake than opens.
Benchmarks:
- Brevo overall CTR: 3.64%
- MailerLite median CTR: 2.09%
- Klaviyo campaign CTR: 1.69%
- Klaviyo automated flow CTR: 5.58%
What’s a “good” CTR?
It depends on your industry, but anything above 2% is solid. Automated flows (like abandoned cart emails) can hit 5%+.
Measuring and Optimizing Newsletter Engagement: Practical Tips
Tracking newsletter metrics is easier than ever, but making sense of the data—and acting on it—is where the real value lies. Here’s my go-to workflow:
- Track the right metrics: Focus on delivered rate, CTR, CTOR, conversion rate, unsubscribe/spam complaint rate, and revenue per email.
- Benchmark against your industry: Use sources like MailerLite and Brevo to see where you stand.
- A/B test everything: Subject lines, content, CTAs, send times—let the data guide you.
- Segment and personalize: The more relevant your content, the better your engagement (Mailchimp).
- Monitor deliverability: If your engagement drops, check your inbox placement and authentication (Google, Yahoo).
Tools I recommend:
- Your ESP’s built-in analytics (Mailchimp, Klaviyo, etc.)
- Thunderbit for scraping and benchmarking competitor newsletters, exporting data to Google Sheets, Airtable, or Notion for deeper analysis
- Google Analytics for tracking conversions from newsletter traffic
Thunderbit: Enhancing Newsletter Data Analysis & Strategy
Analyze newsletter data with Thunderbit Get Started Free
Here’s where Thunderbit comes in. As someone who’s obsessed with making data actionable, I love how Thunderbit lets you:
- Scrape competitor newsletters: Want to know how often your competitors send, what CTAs they use, or how they design their emails? Thunderbit can extract that data in a few clicks.
- Export and analyze: Push newsletter data straight into Excel, Google Sheets, Airtable, or Notion for custom analysis, benchmarking, or trend spotting.
- Benchmark and optimize: Compare your own newsletter metrics against industry averages or specific competitors, then adjust your strategy based on real data.
Thunderbit is trusted by over 100,000 users worldwide, and it’s designed for non-technical teams—so you don’t need to be a data scientist to get actionable insights.
Use cases:
- Sales teams: Analyze which newsletters drive the most leads or meetings.
- Ecommerce ops: Track competitor promo frequency and design trends.
- Marketing: Benchmark your engagement metrics, spot winning content formats, and optimize your editorial calendar.
Real-Time Tracking & ROI: Turning Newsletter Metrics into Results
Learn the basics of data scraping Get Started Free
In 2026, the teams that win are the ones who can turn newsletter metrics into real business outcomes—fast. That means:
- Real-time tracking: Don’t wait for monthly reports. Use tools that update engagement metrics as soon as campaigns go out.
- Agile optimization: If a subject line tanks, pivot for the next send. If a CTA drives clicks, double down.
- ROI focus: Remember, email still delivers some of the highest ROI in digital marketing—35% of leaders report $10–$36 return per $1 spent, and 5% are seeing $50+.
Case in point:
Klaviyo found that automated flows (like abandoned cart emails) drive 13× higher placed order rates than generic campaigns. Omnisend reports that automations account for just 2% of sends but 30% of revenue.
The bottom line? Data-driven newsletter optimization isn’t just a “nice to have”—it’s a direct path to more sales, happier customers, and a healthier bottom line.
Key Takeaways: What the 2026 Newsletter Statistics Mean for You
- Email is still king: With 4.73 billion users and nearly 400 billion emails sent daily, newsletters remain a core marketing channel.
- Open rates are noisy: Privacy changes mean open rates are inflated—use them for trends, not absolute performance.
- Clicks are your best metric: CTR and CTOR are the real indicators of engagement and content quality.
- Segmentation and automation win: Targeted, behavior-driven emails outperform generic blasts by a mile.
- Benchmark, analyze, optimize: Use tools like Thunderbit to gather, compare, and act on newsletter data.
- ROI is still strong—but only if you measure it: Don’t be part of the 21% who don’t track email ROI.
FAQs on Newsletter Statistics & Engagement Metrics
1. How is open rate actually measured?
Open rate is tracked when a tiny, invisible image loads in the recipient’s email client. If images are blocked or privacy features (like Apple MPP) are enabled, opens can be over- or under-counted (Mailchimp).
2. What’s the difference between CTR and CTOR?
CTR (Click-Through Rate) is unique clickers divided by delivered emails. CTOR (Click-to-Open Rate) is unique clickers divided by unique openers—it shows how effective your content is among those who actually opened (Campaign Monitor).
3. Why did our unsubscribe rate spike in 2025–2026?
Gmail and Yahoo have made unsubscribing much easier—users can now opt out with a single click, sometimes without even opening your email. This has led to higher unsubscribe rates across the board (Google, Salesforce).
4. What deliverability rules should I follow to avoid the spam folder?
Authenticate your emails with SPF, DKIM, and DMARC. Support one-click unsubscribe, honor opt-outs within two days, and keep spam complaint rates below 0.3% (Google, Yahoo).
5. Which metric should I focus on in 2026?
Shift your focus from open rates to CTR, conversion rate, unsubscribe rate, and revenue per email. These metrics are more reliable and more closely tied to business outcomes (Litmus).
Further Reading & Resources
- Radicati Email Statistics Report 2022–2026
- MailerLite 2025–2026 Benchmarks
- Brevo Email Marketing Benchmarks
- Klaviyo Email Marketing Benchmarks
- Omnisend Email Marketing Statistics
- Litmus State of Email 2025
- Mailchimp: About Open and Click Rates
- Thunderbit Blog – for more on data-driven marketing and newsletter analytics
If you’re ready to take your newsletter strategy to the next level, download Thunderbit’s Chrome Extension and start benchmarking, analyzing, and optimizing your campaigns today. And if you want more deep dives on data-driven marketing, check out the Thunderbit Blog for the latest guides and insights.
Try Thunderbit for Newsletter Benchmarking Get Started Free