
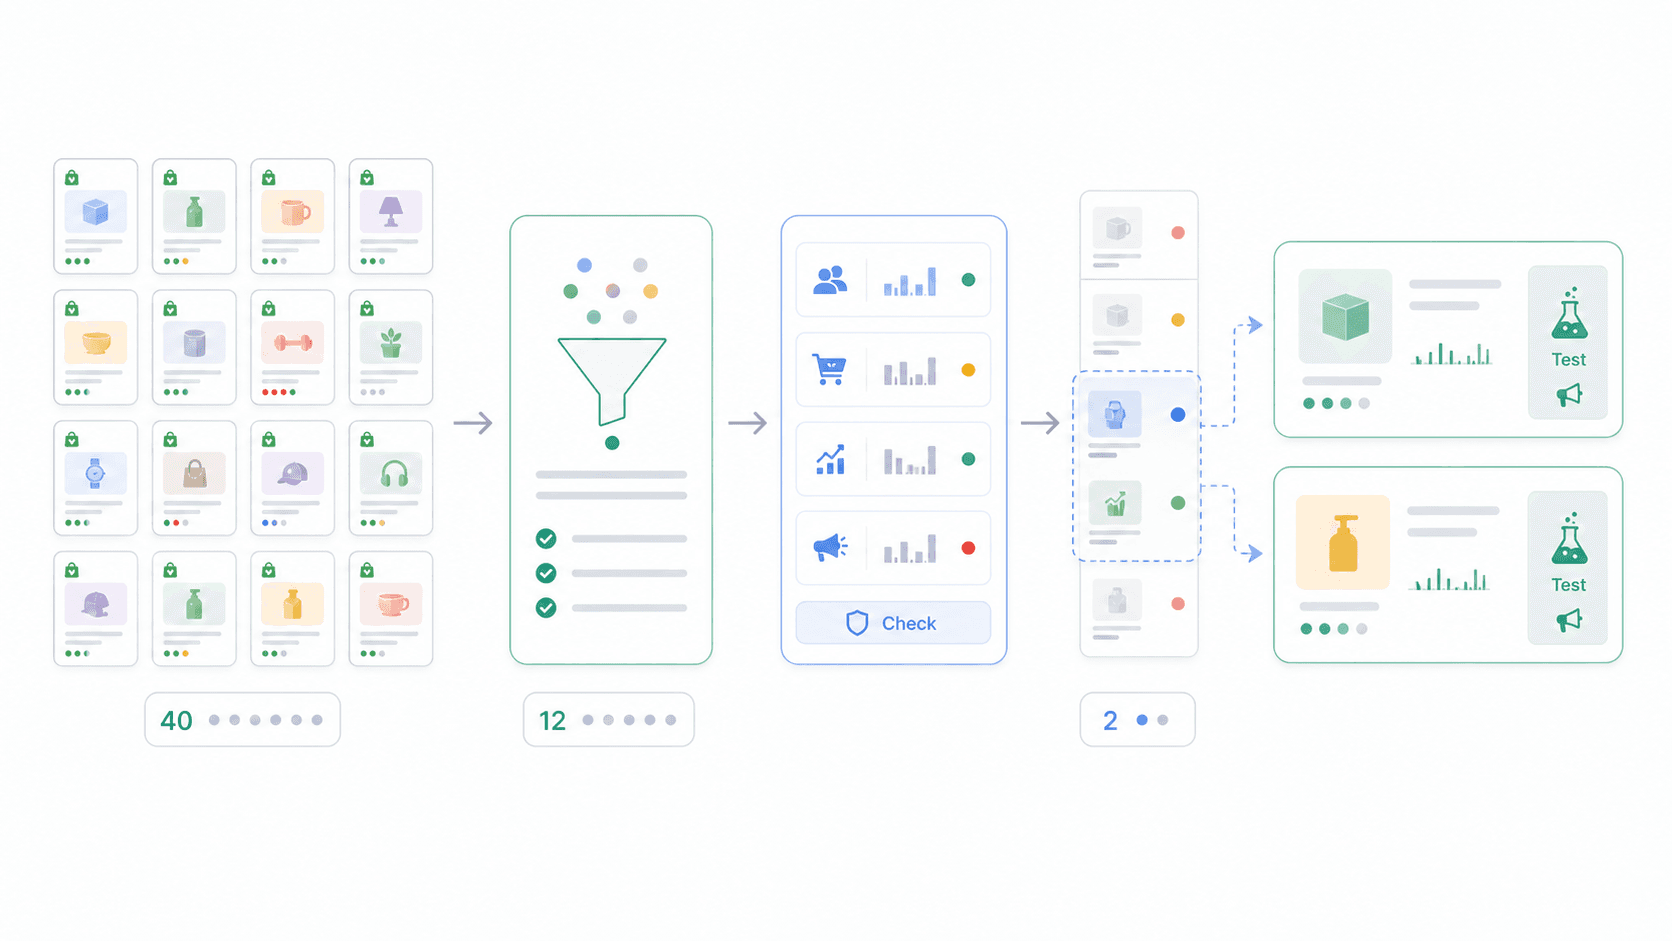
Last week, I scraped 40 competitor Shopify stores, ran saturation checks on 12 product candidates, and killed 10 of them before spending a single dollar on ads. The two survivors are now in testing. That's the workflow I want to walk you through today.
Spend five minutes in any dropshipping community and you'll see the same complaint: "By the time I find a good product, ten other stores are already selling it." Fair enough. as of February 2026, with over 102,000 new stores launched just in the first two months of the year.
The , growing at 22% CAGR. The opportunity is real — so is the noise. The gap between sellers who find winners and sellers who chase saturated leftovers? Process.
Difficulty: Beginner to Intermediate
Time Required: ~30 minutes to set up the full workflow; ~10 minutes per product to validate
What You'll Need: Chrome browser, (free tier works), Google Sheets, access to Meta Ad Library (free), and $50–150 for ad testing per product
What Makes a Winning Dropshipping Product (and What Doesn't)
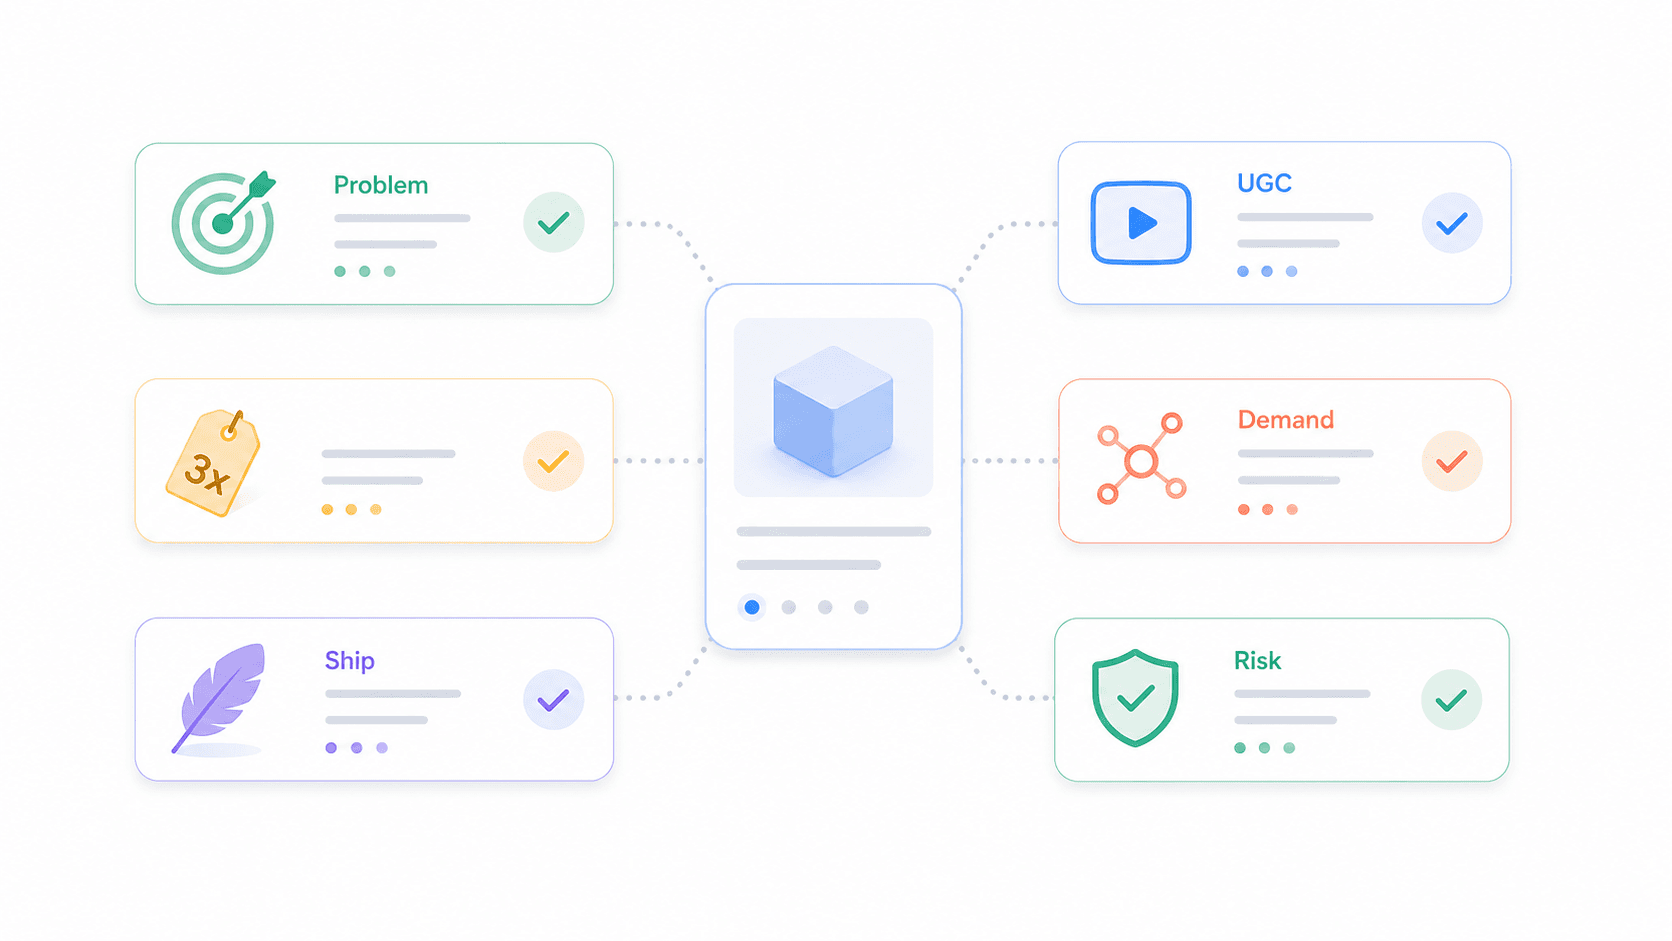
A "winning product" is not just something trending on a spy tool dashboard. It sells consistently, supports enough markup to survive ad costs, ships without constant complaints, and still has room to grow before every competitor copies the same offer.
Checklist I keep pinned to my desk:
- Solves a visible problem or triggers a strong emotional reaction
- Hard to find in local stores or not easily compared by brand name
- Can support 2.5x–4x markup before ad spend
- Small, lightweight, durable — easy to ship
- Not overly technical, regulated, fragile, or size-dependent
- Has clear UGC/video demonstration potential
- Shows demand across at least two independent channels (e.g., TikTok comments plus Amazon movement, or Meta ads plus Google Trends)
- Does not rely on exaggerated health, beauty, or income claims
What does not make a winning product: appearing on a "top 10 products this week" PDF, being recommended by a guru, or going viral on one TikTok. found that problem-solving products accumulate far more reviews and longevity over time than novelty items. A pet hair remover, for example, isn't flashy — but , and for the brand. Boring can be very profitable.
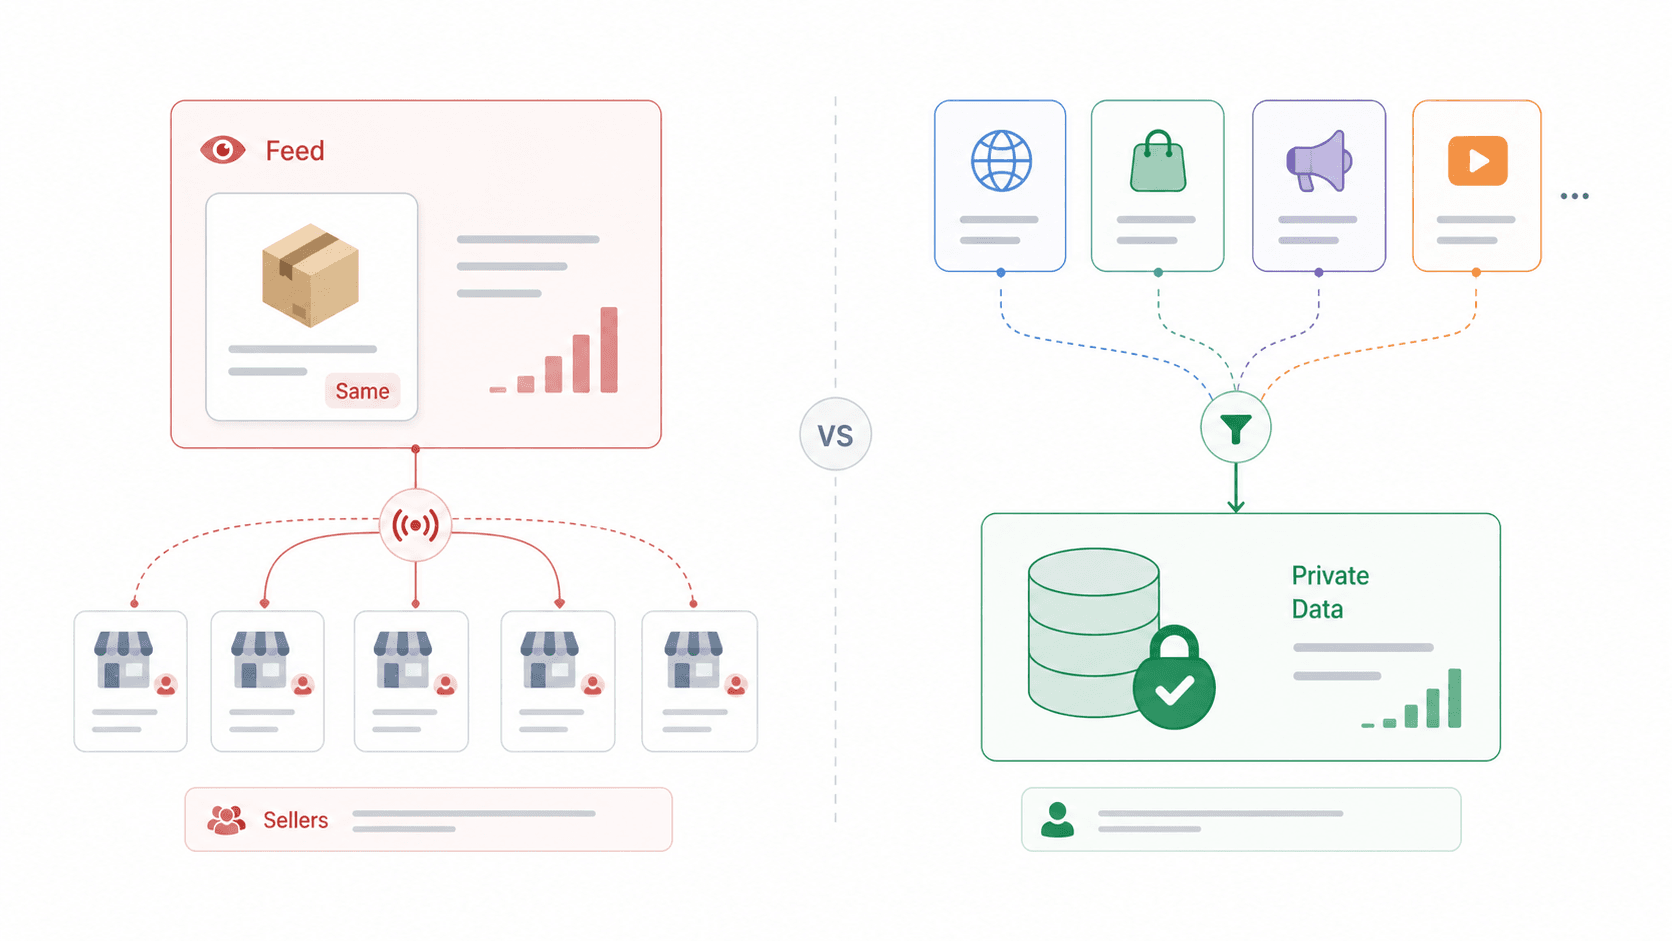
The Spy Tool Paradox: Why Everyone Finds the Same "Winning" Products
Ugh, I really don't want to explain this because it sounds obvious once you hear it — but the more popular a product research tool is, the less exclusive its data becomes.
. . Those are impressive numbers — for the tools. For you, it means every "winning product" surfaced on Monday morning is visible to thousands of other sellers by Monday afternoon.
Reddit has been saying this for years. One put it bluntly: "If you're hoping to copy a winning product and print money, yeah, that's dead." Another summarized the complaint: tools like PiPiADS and AdSpy promise "winning products," but many users say the data is outdated or already saturated by the time they act on it.
I call this the spy tool paradox. The tool works — it just works for everyone simultaneously.
(For what it's worth, the tools themselves aren't bad. The shared-data problem is.)
Here's how different research approaches compare:
| Research Method | Freshness | Exclusivity | Cost | Effort |
|---|---|---|---|---|
| Curated spy tool database | Medium (24–72h lag) | Low (shared with all subscribers) | $50–$100/mo | Low |
| Meta Ad Library (manual) | High (real-time) | Medium (public but requires effort) | Free | Medium |
| TikTok Creative Center | High | Medium-low | Free | Medium |
Shopify ?sort_by=best-selling trick | Store-specific | Higher | Free | Medium |
| AI-powered bulk scraping (e.g., Thunderbit) | As fresh as your target URLs | High (your own dataset) | Free–Low | Low-medium |
The best product research is the research nobody else is doing. Build your own dataset instead of living inside everyone else's feed.
My Product Validation Flowchart: A Repeatable System for Finding Winning Products
Most guides hand you a list of methods and wish you luck. I wanted something different — a sequential, gate-based process where each step feeds the next and each has a clear pass/fail benchmark.
This flowchart is the spine of my entire product research workflow:
Discovery → Trend Verification → Saturation Score → Margin Check → Ad Test → Scale or Kill
Summary table:
| Validation Gate | Metric | Pass Threshold | Tool |
|---|---|---|---|
| Discovery | Candidate count | 20–50 raw products/week | TikTok, Amazon, Meta Ad Library, Shopify stores, eBay Watchcount, Thunderbit |
| Trend Verification | Google Trends 12-month slope | Steady rise or stable; not spike-and-crash | Google Trends + Keyword Planner |
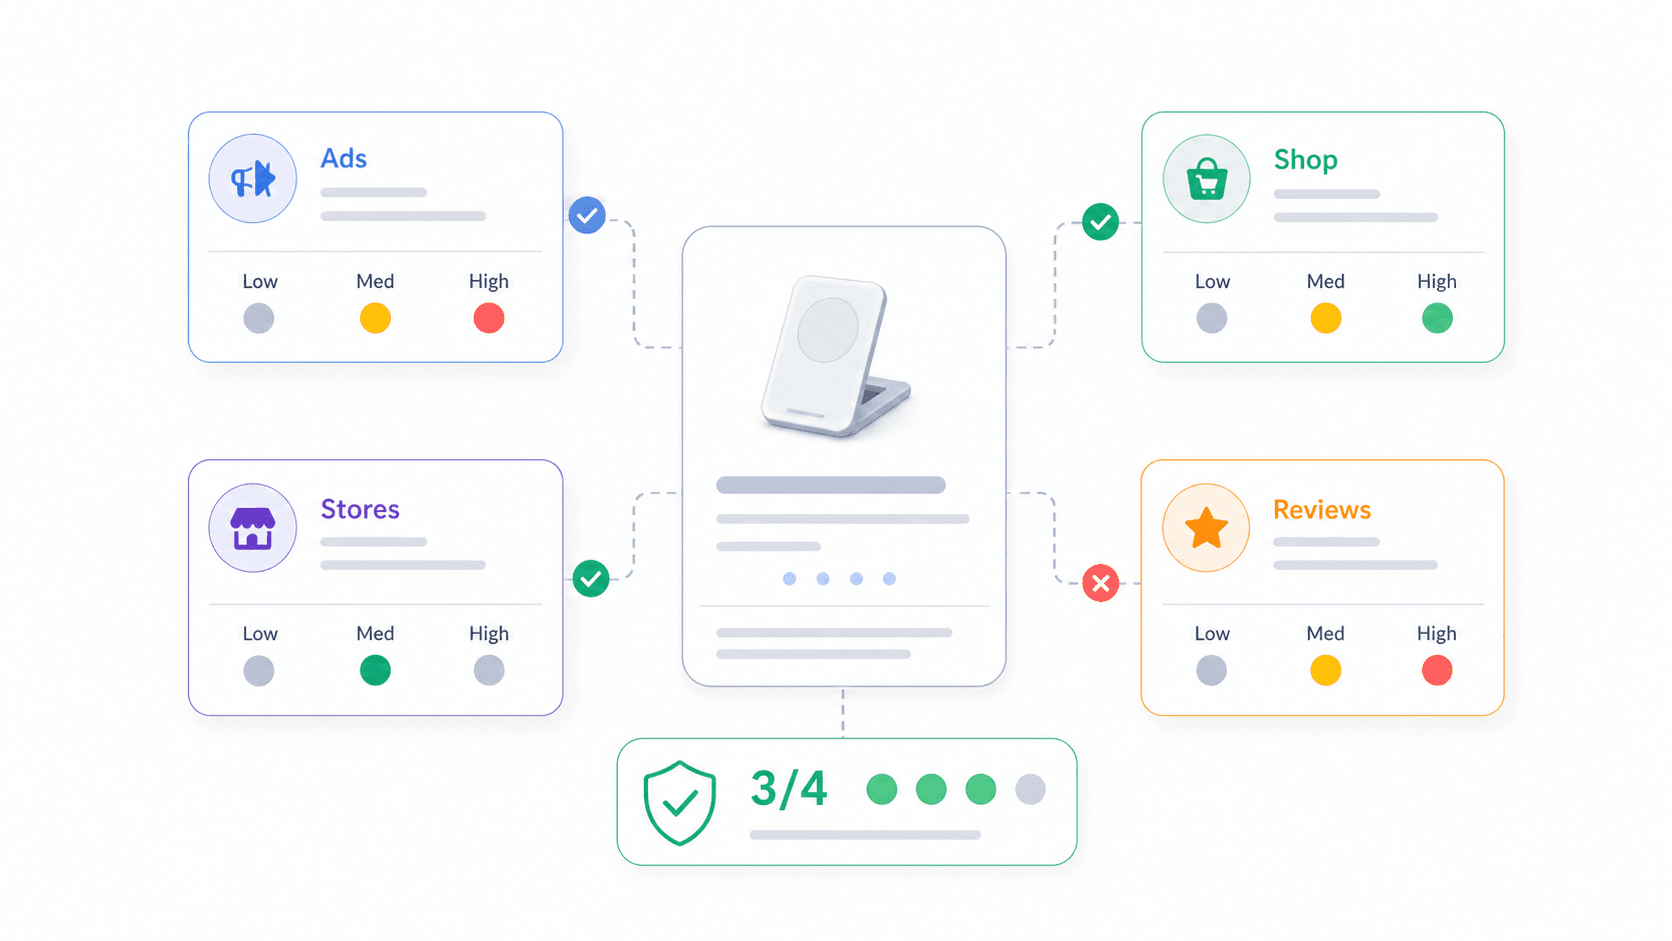
| Saturation Score | Competitor count across 4 signals | Low or Medium on at least 3 of 4 signals | Google Shopping, Meta Ad Library, Google search, AliExpress |
| Margin Check | Net contribution margin | ≥30% before testing | Spreadsheet |
| Ad Test | Link CTR after $50–100 spend | >2% = keep; 1–2% = iterate; <1% = kill | Meta Ads Manager |
| Scale Decision | CPA vs. breakeven | CPA ≤ 60% of gross product margin | Meta + Shopify analytics |
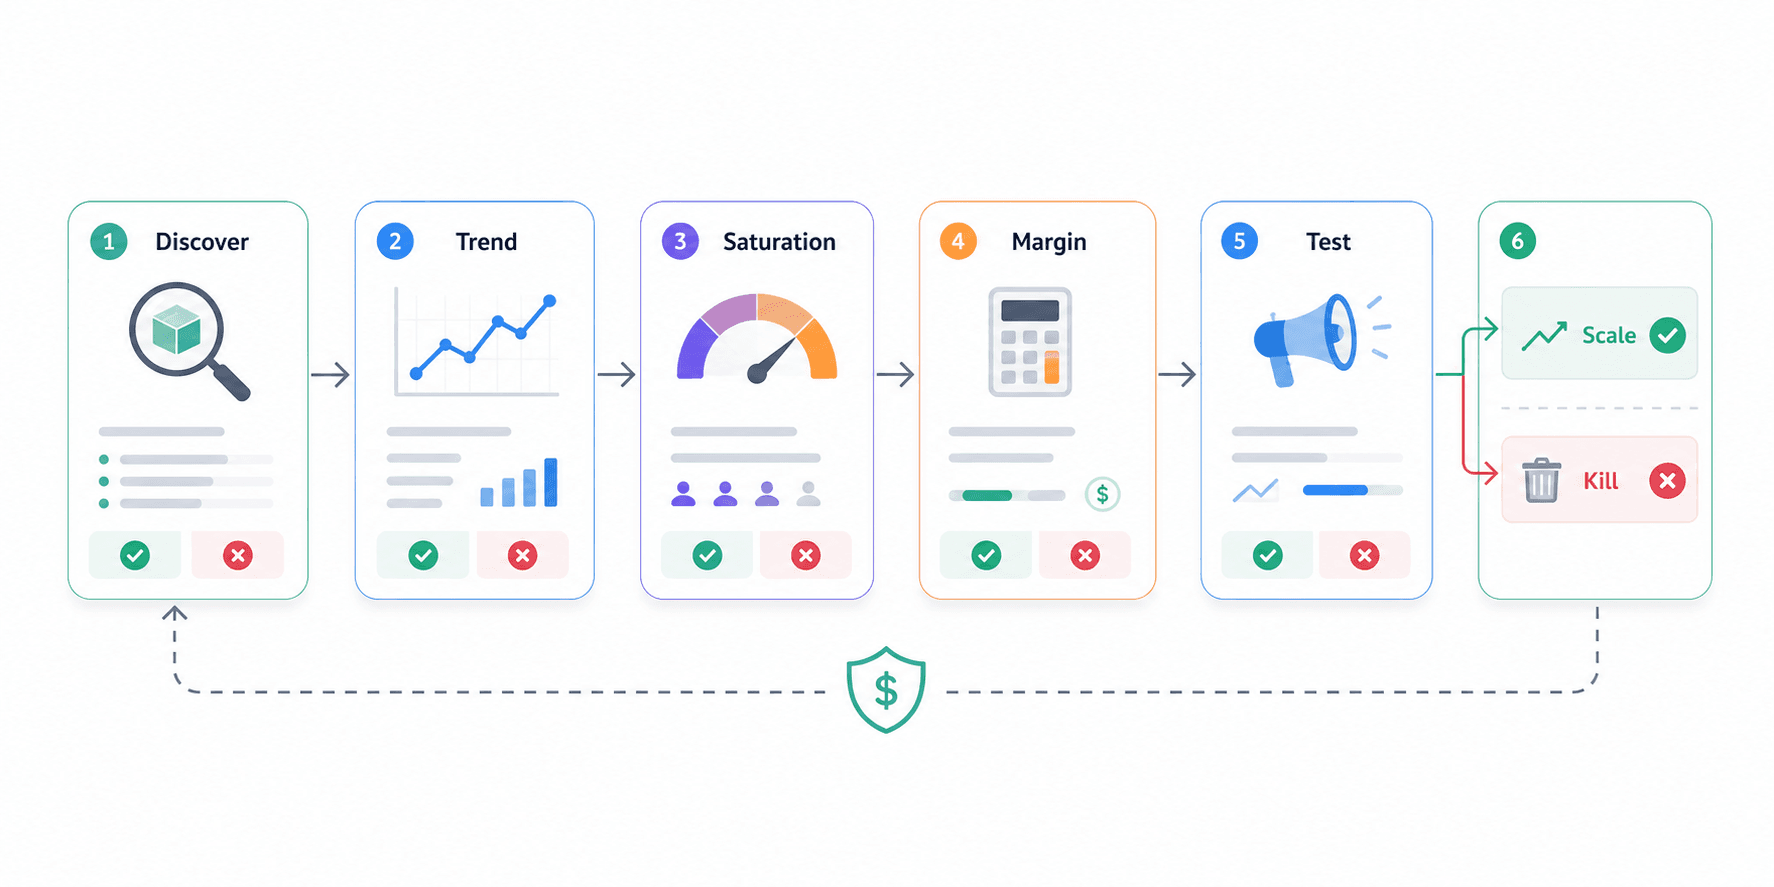
Each gate has a quantitative threshold, and a product must pass each one before moving to the next. I've killed plenty of products I liked at the margin check or saturation score stage — and that's the point.
The system protects your budget.
Discovery: 6 Free and Paid Ways to Find Winning Dropshipping Products
Discovery is the widest part of the funnel. The goal is not to pick a product here — it's to generate 20–50 candidates per week that can survive the filters ahead.
Search TikTok for Products People Actually Want to Buy
TikTok remains one of the fastest surfaces for spotting raw consumer interest. , and the platform's emphasizes "Curiosity Detours" — more intentional, discovery-driven shopping behavior.
My process:
- Search hashtags like
#TikTokMadeMeBuyIt,#amazonfinds,#coolgadgets,#cleaningtok,#petfinds, and niche-specific tags. - Filter mentally for posts from the last 3 months.
- Prioritize videos with 100K+ likes, not just views. Likes signal stronger engagement.
- Read the comments. Look for purchase intent: "Where can I get this?", "link?", "does it work for cats?" If all the comments are jokes, move on.
- Check for structured trend data — trending hashtags, related videos, audience insights, and regional popularity.
One caution: products that blow up on TikTok can saturate fast. Discovery is just the first gate, not the whole process.
Mine Amazon Best Sellers and Movers & Shakers
updates hourly based on recent and historical sales. highlights products with the largest sales rank gains over the past 24 hours — these are products gaining momentum right now.
Focus on categories suited to dropshipping: Home & Kitchen, Pet Supplies, Beauty Tools, Sports & Outdoors, Auto Accessories. Look for fast movers that aren't brand-dependent, then cross-reference with AliExpress or CJ Dropshipping to confirm a workable price gap.
Quick markup logic: if Amazon retail is $34.99 and AliExpress landed cost is $6–$9, there's likely room. If retail is $14.99 and landed cost is $8, paid ads will eat the margin.
Spy on Competitors with the Meta Ads Library (Free)
The lets you search all currently active ads across Meta platforms — for free. This is real-time data, not a pre-filtered list.
How I run it:
- Go to facebook.com/ads/library.
- Set your target country.
- Choose "All ads."
- Search product phrases, competitor brand names, or dropshipping-style terms: "Shop Now," "Free Shipping," "50% Off," niche keywords.
- Look for ads running several weeks — longevity is a weak but useful proxy for profitability.
- Count unique advertisers selling the same product type. This feeds directly into the Saturation Score later.
that some ads don't appear in the library, especially with narrow targeting or dynamic creatives. Imperfect — but for product research, still far better than paying $100/month for a curated list.
Use the Shopify Best-Selling URL Trick
Simple trick, still works in 2026. Append ?sort_by=best-selling to any Shopify store's collection URL to instantly see their top sellers. confirms best-selling as a valid sort parameter, and their lists BEST_SELLING as a sort key.
Steps:
- Find competitor Shopify stores: Google
site:myshopify.com "[niche keyword]". - Navigate to
/collections/all?sort_by=best-selling. - Also try
?sort_by=created-descendingto see what they're testing recently. - Record product name, price, reviews, discount, and creative angle.
Limitations: some headless or custom Shopify stores don't expose this. And "best-selling" is often all-time, not last 7 or 30 days — a product can rank high because it used to sell, not because it's selling now.
Browse eBay Watchcount for High-Intent Products
aggregates the most-watched eBay listings. High watch count signals real purchase intent — people are actively tracking these items.
Search by keyword or category — Home & Garden, Health & Beauty, Pet Supplies, Consumer Electronics accessories, Auto accessories are strong starting points. Use WatchCount as an intent signal, not a sourcing decision.
Use Thunderbit to Scrape Product Data from Any Website in Bulk
This is where I stop copy-pasting. Instead of manually pulling product names, prices, review counts, and images from competitor sites, I use to extract structured product data in a couple of clicks.
What makes it useful for product research:
- AI Suggest Fields reads any product page and auto-generates the right column structure — product name, price, reviews, rating, shipping info.
- Cloud scraping processes up to 50 pages at a time, so checking dozens of products takes minutes, not hours.
- Subpage scraping lets you click into each product to pull detailed specs, review breakdowns, and shipping options without manual copy-paste.
- Export directly to Google Sheets, Excel, Airtable, or Notion for your own private analysis.
This is the "build your own spy tool" alternative. Instead of paying $50–$100/month for a curated database shared with thousands of other subscribers, you create a private product research dataset from any source you choose.
Trend Verification: How to Read Google Trends Without Getting Fooled
Every product that survives discovery gets a check. Google's warns that a spike does not automatically mean a topic is "popular" — it only shows relative search interest. So interpretation matters.
What the Trend Curve Actually Tells You
| Curve Shape | Interpretation | Decision |
|---|---|---|
| Steady rise over 3+ months | Demand is building | Continue to next gate |
| Spike then crash | Viral fad or news event | Usually avoid unless you can move immediately |
| Flat but stable | Evergreen demand | Continue only if saturation and margin are favorable |
| Seasonal peaks | Predictable recurring demand | Time entry before next peak |
| Low-volume noisy spikes | Not enough reliable data | Validate with other signals |
You can and filter by country, region, and time period — I always compare candidates side by side.
Supplement with (free with a Google Ads account) to confirm that Trends interest maps to real search queries. Treat exact volumes as directional — Keyword Planner groups similar keywords and may hide low-volume terms.
Pass threshold: the 12-month slope should show a steady rise or stable demand. If it's a single spike already declining, I kill the product here.
Saturation Scoring: How to Tell If a Dropshipping Product Is Already Oversold
This is the step most guides skip entirely.
It's also the step that saves me the most money.
The goal isn't to find a product nobody sells — it's to find products where demand exists but the same offer hasn't been copied into the ground. Five signals to check:
Count Google Shopping Competitors
Search the exact product name on Google and count how many Shopping ads/listings appear. More than 20 in your target country is a high saturation signal.
Check Facebook Ad Library Volume
Search the product name in the and count active ads from different advertisers — not total ad count. More than 50 unique advertisers is a warning sign.
Search for Shopify Stores Selling the Same Product
Use Google: site:myshopify.com "[product name]". Count results. More than 15 active stores selling the same product is high saturation. Thunderbit can speed this up — scrape the search results page to extract store names, URLs, and counts in bulk.
Cross-Reference AliExpress Order Volume and Review Freshness
High AliExpress orders plus few dropship stores selling it = opportunity. High orders plus many stores = saturated. If most reviews are more than 6 months old and order velocity is declining, the wave has likely passed.
The Saturation Scoring Rubric
| Signal | Low Saturation (✅ Go) | Medium (⚠️ Caution) | High (❌ Avoid) |
|---|---|---|---|
| Active FB ads (unique advertisers) | < 10 | 10–50 | > 50 |
| Google Shopping competitors | < 5 | 5–20 | > 20 |
| Shopify stores selling it | < 5 | 5–15 | > 15 |
| AliExpress review trend | Rising | Stable | Declining |
Pass rule: a product must score Low or Medium on at least 3 of 4 signals to proceed.
I use Thunderbit's cloud scraping (50 pages at a time) to run these checks across Google Shopping results, AliExpress product pages, and Shopify competitor storefronts. What used to take me an afternoon now takes about 15 minutes per product batch.
Important caveat: these thresholds are editorial heuristics, not universal law. A "saturated" product can still work with a better offer, brand, creative, bundle, or niche angle. The score prevents lazy copycat launches — it doesn't prevent smart differentiation.
Margin Check: The Simple Math Behind Every Winning Dropshipping Product
Before spending a dollar on ads, I confirm the unit economics work.
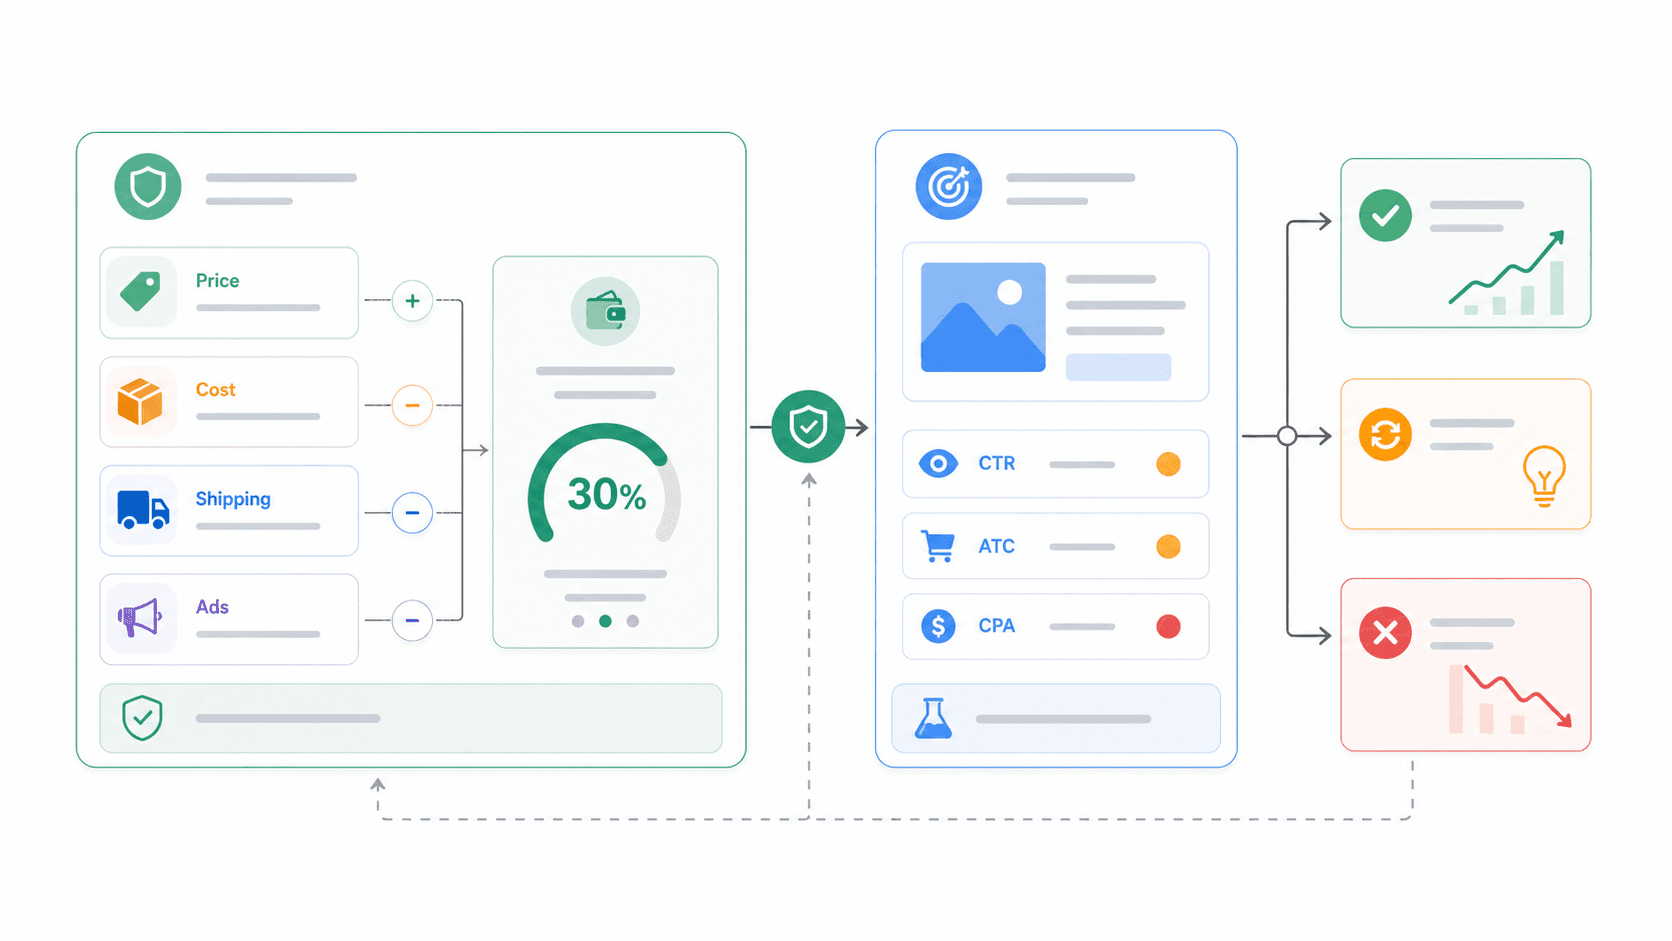
Many beginners skip this step and lose money on products that can't sustain ad costs.
The formula:
1Net Margin = (Sell Price − Product Cost − Shipping − Estimated Ad Cost − Payment Fees − Return Buffer) / Sell PriceWorked example:
| Item | Amount |
|---|---|
| Sell price | $39.99 |
| Product cost (AliExpress/CJ) | $8.00 |
| Shipping | $3.00 |
| Estimated ad cost per purchase | $10.00 |
| Payment processing fees (~3.5%) | $1.46 |
| Refund/return buffer (~5%) | $2.00 |
| Estimated contribution profit | $15.53 |
| Net margin | 38.8% |
Now watch what happens if CPA rises to $18 (which is common as you scale):
| Item | Amount |
|---|---|
| Same COGS/shipping/fees/buffer | $14.46 |
| CPA | $18.00 |
| Estimated contribution profit | $7.53 |
| Net margin | 18.8% |
This is why a product can look profitable in a supplier calculator but fail after ads. confirms that experienced dropshippers typically land around , while beginners often run below 10%.
I target ≥30% net margin in the spreadsheet before testing, because real life compresses it. Common mistakes: forgetting payment processing fees, returns/chargebacks, and the fact that CPA almost always rises after the initial test phase.
Spreadsheet columns I use:
Product | Supplier URL | Supplier Cost | Shipping Cost | Sell Price | Payment Fee | Return Buffer | Breakeven CPA | Target CPA | Net Margin at Target CPA | Notes
Ad Testing: How to Validate a Dropshipping Product Without Burning Your Budget
Most product research guides stop before this section. Which is odd, because this is the part that separates people who find winners from people who just find products.
A common is that you need $3,000 to test. That's scaling budget, not testing budget.
The purpose of a test is to generate enough data to make a decision — not to be profitable on day one.
Minimum Viable Test Setup
- 1 campaign → 3 ad sets (different broad audiences or interests) → 2 creatives per ad set
- Budget: $50–$150 per product test on Meta Ads Manager
- Duration: 3–5 days
- Creative: Start with UGC-style video or a simple problem/solution demo. Don't overbuild before you have signal.
The Kill Criteria Table: When to Keep, Iterate, or Drop a Product
| Metric (after $50–100 spend) | Keep Testing | Iterate Creative | Kill Product |
|---|---|---|---|
| Link CTR | > 2% | 1–2% | < 1% |
| Add-to-Cart Rate | > 5% | 2–5% | < 2% |
| Cost per Purchase | < Breakeven CPA | 1–1.5× breakeven | > 2× breakeven |
| Landing Page Bounce | < 60% | 60–80% | > 80% |
For context, commonly cite CTR around 0.8%–1.5% and CPA around $25–$60. A >2% link CTR is an above-average creative signal. , based on $8.4B in ad spend from 33,000+ brands, found Meta took 68.3% of ecommerce ad spend — so these numbers reflect real-world scale.
One interpreted a 2.23% CTR as meaning "the ad is doing its job," while no sales pointed to product page, trust, or offer problems. That's a useful framing: CTR tells you about the ad. Add-to-cart and purchase rate tell you about the product and the offer.
A common debate: "Is it the product or the creative?" The honest answer is both matter. A great product with bad creative still fails. A great creative on a mediocre product also fails. The test phase isolates which variable is underperforming — and the kill criteria table tells you what to do about it.
The Complete Free Workflow: How to Find Winning Products for Dropshipping on $0
One of the most common complaints in forums: "Every trending product website or software requires you to pay."
Fair. So here's the complete workflow mapped to free methods, with optional paid upgrades:
| Step | Free Method | Optional Paid Upgrade |
|---|---|---|
| Discovery | TikTok Creative Center, Amazon Movers & Shakers, Meta Ad Library, eBay WatchCount | Minea, Sell The Trend |
| Trend Validation | Google Trends, Google Keyword Planner | SEMrush, Ahrefs |
| Competitor Spying | Shopify ?sort_by=best-selling trick (manual) | ShopHunter, SimplyTrends |
| Bulk Data Collection | Thunderbit free tier (6 pages) + manual | Thunderbit paid, NicheScraper |
| Margin Calculation | Spreadsheet + AliExpress manual check | Sell The Trend profit calculator |
| Ad Testing | Meta Ads Manager ($50–100 budget) | — |
The entire research phase — discovery through margin check — can be done for $0. The first unavoidable cost is the $50–$150 per product ad test.
Paid tools save time. They don't replace judgment.
I'll be honest about when paid tools add genuine value: if you're testing 10+ products a week and need to scrape hundreds of pages, Thunderbit's paid tier or a dedicated trend tool will save hours. But if you're starting out and testing 2–3 products a month, the free workflow is more than enough.
How I Use Thunderbit to Speed Up Dropshipping Product Research
Practical walkthrough time. I'm on the marketing team at , so I've watched our users build some creative product research setups — and I've borrowed a few of their tricks.
Scraping Competitor Shopify Stores for Best-Seller Data
- Open a competitor Shopify store's collection page.
- Add
?sort_by=best-sellingto the URL. - Open the Thunderbit Chrome extension.
- Click "AI Suggest Fields." Thunderbit reads the page and auto-generates columns: product name, product URL, price, sale price, image, review count, rating.
- Click "Scrape." For paginated collections, Thunderbit handles multiple pages automatically.
- Export to Google Sheets.
Manually copying 30–50 products from a single store takes 30–60 minutes. With Thunderbit, I get structured data in a few minutes — and I can repeat across 10 stores in the same session.
Bulk-Scraping AliExpress and Amazon for Sourcing and Pricing Data
Same process, different target — AliExpress category pages or Amazon Best Sellers. Columns I pull:
- Product name
- Supplier price
- Shipping cost and delivery time
- Orders/sold count
- Rating and review count
- Main image
- Seller/store name and URL
Cloud scraping processes up to 50 pages at a time. Subpage scraping lets me click into each product for detailed specs, review recency, variant pricing, and shipping options — without opening 50 tabs.
Building Your Own "Spy Tool" Dataset
I combine data from multiple sources into one spreadsheet instead of paying for a curated database:
| Product | Source | Supplier Cost | Store Price | Review Count | Meta Advertisers | Google Shopping Count | Trend Shape | Margin | Decision |
|---|---|---|---|---|---|---|---|---|---|
| Pet hair scraper | Shopify/AliExpress | $5.20 | $34.99 | 3,000 | 12 | 8 | Stable/rising | 32% | Test |
| Neck fan | Amazon/AliExpress | $9.50 | $24.99 | 20,000 | 80 | 35 | Seasonal/spiky | 8% | Avoid |
Thunderbit's can run recurring jobs — set it to "every day at 8am" and auto-export results. That means I can monitor pricing and stock changes over time without manually re-scraping.
The cost comparison:
| Approach | Monthly Cost | Time per 50 Products | Exclusivity |
|---|---|---|---|
| Manual copy-paste | $0 | 3–5 hours | High (your effort) |
| Paid spy tool subscription | $50–$100/mo | Minutes (but shared data) | Low |
| Thunderbit free tier | $0 | 15–30 minutes | High (your own dataset) |
| Thunderbit paid tier | Low | Minutes | High |
For more on , we've written a deeper guide. And if you're curious about in the first place, that's covered too.
Tips and Common Pitfalls
Tip 1: Rotate your discovery sources weekly. If you only use TikTok, you'll only find TikTok-style products. Alternate between Amazon, eBay, Meta Ad Library, and competitor store scraping to diversify your candidate pool.
Tip 2: Don't fall in love with a product before the margin check. I've done this more times than I'd like to admit. The product looks great, the trend is rising, saturation is low — and then the math says 12% margin after ads. Kill it. Move on.
Tip 3: Track your kills, not just your wins. I keep a "graveyard" tab in my spreadsheet. After a few months, patterns emerge — certain product types, price ranges, or niches consistently fail at specific gates. That meta-data is more valuable than any spy tool.
Pitfall: Trusting AliExpress order counts at face value. High order counts can be inflated by bulk B2B orders, coupon promotions, or historical accumulation. Always check review freshness and recent order velocity.
Pitfall: Running ads before checking saturation. If 50 other advertisers are running the same product with the same GIF creative, your CTR will be low and your CPA will be high — and it's not because your ad is bad. It's because the audience has seen it before.
Pitfall: Confusing testing budget with scaling budget. $50–$150 is enough to test. If someone tells you that you need $3,000 before you can know if a product works, they're conflating testing with scaling. Test small, kill fast, scale the survivors.
Alternative Methods
If you prefer coding, Python libraries like BeautifulSoup and Scrapy can scrape product data from most ecommerce sites. The tradeoff is setup time and maintenance — you'll need to write and update scripts as site structures change. For a comparison of approaches, our post on covers the landscape.
Some sellers also use Google Alerts for product-related keywords, Pinterest Trends for visual product discovery, or wholesale marketplace browsing (Faire, Tundra) to find products before they hit the dropshipping mainstream. These are slower but can surface less competitive opportunities.
Conclusion
Winning product research is a process, not a one-time search. The advantage goes to sellers who build their own data and follow a repeatable system — not those who refresh a spy tool dashboard every Monday.
Three mindset shifts that have made the biggest difference for me:
- Stop relying on curated spy tool lists. Build your own dataset. The research nobody else is doing is the research that gives you an edge.
- Use quantitative benchmarks at every step. Trend shape, saturation score, margin math, and ad test kill criteria — each gate has a number, not a feeling.
- Test small before scaling. $50–$150 per product, not $3,000. Kill fast, iterate on the survivors, and scale only what the data supports.
The entire workflow can be started for free. gives you 6 pages of scraping per month — enough to test the process and see if it fits your workflow.
For visual walkthroughs, we post regularly on our .
FAQs
How much does it cost to find winning products for dropshipping?
The research phase — discovery, trend verification, saturation scoring, and margin calculation — can be done entirely for free using TikTok, Amazon, Meta Ad Library, Google Trends, the Shopify URL trick, eBay Watchcount, Google Sheets, and Thunderbit's free tier. The first real cost is the ad test: $50–$150 per product on Meta Ads Manager. Paid spy tools and upgraded scraping plans are optional and save time, but they're not required to find winners.
How many products should I test before finding a winner?
There's no universal benchmark, but a realistic expectation is 5–20 product tests before landing a repeatable winner. The better metric isn't how many products you test — it's how many product-creative-offer combinations you test with clean kill criteria. Some sellers find a winner in their first batch; others take longer. The system matters more than the count.
How long does it take for a winning dropshipping product to saturate?
It depends on the discovery channel and product type. . Products found through original research — especially problem-solvers with less viral appeal — can sell profitably for months or even years when branded well. puts the common practitioner range at 3 weeks to 3 months, but emphasizes that product type matters more than any universal timeline.
Can I find winning dropshipping products without paid spy tools?
Yes. The free workflow in this article covers every stage from discovery through ad testing without a single paid tool subscription. Paid tools like Minea or Sell The Trend save time and can be useful for inspiration, but they also share data with thousands of other subscribers — which is the core of the saturation problem. Building your own dataset with free tools (and Thunderbit's free tier for bulk data collection) gives you both cost savings and exclusivity.
What's the biggest mistake beginners make when looking for winning products?
Skipping the saturation and margin checks. Most beginners find a product that looks exciting — strong TikTok engagement, lots of orders on AliExpress — and immediately start building a store and running ads. By the time they've spent $200–$500, they discover that 30 other stores are selling the same thing with the same creative, or that the margin after ad costs is 8%. The validation flowchart exists to catch these problems before you spend real money.
Learn More