
I’ll never forget the first time I watched an ecommerce ops team try to track Home Depot prices with nothing but a spreadsheet, a pot of coffee, and a lot of wishful thinking. It was like watching someone try to bail out a sinking boat with a teaspoon—heroic, but doomed. In today’s ecommerce world, price monitoring isn’t just a “nice to have.” It’s the difference between winning a sale and losing out to a competitor by a few cents. But here’s the kicker: most ops and sales teams don’t have a developer on speed dial, and the idea of writing a web scraper sounds about as fun as assembling IKEA furniture without instructions.
So, how do you build a Home Depot Price Tracker (and a real price history checker) if you don’t know a single line of code? And what are the traps that catch so many teams trying to do this the old-fashioned way? Let’s dig into why price tracking matters, why traditional approaches fall short, and how new no-code tools like are making it possible for anyone—yes, even the spreadsheet warriors among us—to track Home Depot prices like a pro.
Why Ecommerce Teams Track Home Depot Prices
Let’s set the scene. In the high-stakes world of ecommerce, pricing is everything. Nearly , and . Home Depot, as a giant in home improvement, isn’t just another retailer—it’s often the benchmark. If Home Depot drops the price on a power drill by 5%, you can bet competitors are scrambling to match or beat it.
For ecommerce operations and sales teams, tracking Home Depot prices is about more than just “keeping an eye” on the competition. It’s about:
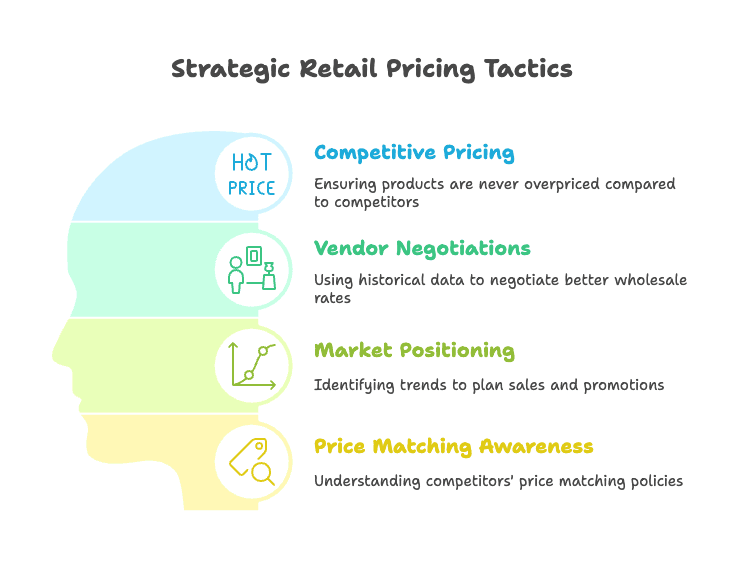
- Competitive Pricing: Ensuring your products are never overpriced compared to Home Depot.
- Vendor Negotiations: Having historical price data to negotiate better wholesale rates or co-op funds.
- Market Positioning: Spotting trends, like seasonal discounts or special promotions, to plan your own sales.
- Answering “Does Home Depot Price Match?”: Home Depot’s means they’ll match any other retailer’s price for an identical in-stock item. If you’re selling against them, you need to know when they’re likely to drop prices to match a rival.
And let’s not forget the value of a price history checker. Home Depot runs frequent sales—“Special Buy of the Day,” seasonal markdowns, clearance events. If you can spot patterns (like, say, they always discount grills in May), you can time your own promotions or stock up before the rush.
Traditional Price Tracking Methods: Why They Fall Short
Now, if you’re like most ecommerce teams, your first instinct might be to assign someone to check every morning and jot down prices in a spreadsheet. I’ve seen this in the wild, and let me tell you, it’s about as scalable as running a marathon in flip-flops.
![]() Let’s break down the usual suspects for price tracking—and why they’re often a dead end for non-technical teams:
Let’s break down the usual suspects for price tracking—and why they’re often a dead end for non-technical teams:
Manual Price Checking
The “old school” way: visit product pages, copy prices, paste into Excel. Works for one or two SKUs, but if you need to track dozens or hundreds? Forget it. It’s , and you’ll miss price changes that happen outside your daily check-in. Building a price history this way? Nearly impossible.
Web Scraping with Code (APIs or Scripting)
If you have a developer handy, you might try writing a Python script or using an unofficial API. But here’s the catch: . That means scraping the website’s HTML, which is a moving target. Home Depot’s site is complex—prices might be loaded dynamically, and the HTML structure can change without warning. One day your script works, the next day it’s broken because they changed a class name. Unless you love debugging code at 2 AM, this isn’t sustainable for most teams.
Traditional Web Scraping Tools (No-Code, but Complex)
There are “no-code” scraping tools out there, but most require you to build workflows, tweak selectors, and handle pagination manually. Tools like Octoparse have a , and their cloud plans can run . For a non-technical user, it’s like being handed the cockpit of a 747 when all you wanted was a bike.
Change Monitoring Tools (Visualping, etc.)
These tools let you highlight the price on a page and get an alert when it changes. Simple, right? But if you want to track 50 products, you need 50 separate monitors. And you’ll get a pile of alerts, not a structured price history. Compiling those alerts into a usable dataset? That’s on you.
Maintenance and Blocking Issues
Let’s not forget: Home Depot (like most big retailers) has anti-scraping measures. Too many requests, and you might get blocked. And every time the site changes, your scraper needs fixing. If you don’t have a developer on standby, you’re stuck.
Bottom line: Traditional methods either demand a ton of manual labor or technical skill. Most business users know what data they need, but can’t get it easily. That’s where no-code, AI-powered solutions come in.
Introducing Thunderbit: The No-Code Home Depot Price Tracker
This is where I get excited. At Thunderbit, we built an because we saw firsthand how much time and energy teams were wasting on manual tracking or wrestling with complex tools. Thunderbit is designed for business users—people who need data, not a crash course in computer science.
Here’s what makes Thunderbit a game-changer for Home Depot price tracking:
- Truly No-Code: Install the , open a Home Depot page, and let AI do the rest. No selectors, no scripts, no headaches.
- AI-Powered Field Suggestions: Thunderbit’s AI reads the page and suggests the right columns—product name, price, SKU, availability, and more.
- Scheduled Scraper: Set it and forget it. Thunderbit will scrape your chosen Home Depot product URLs on a schedule (daily, weekly, you name it) and build a price history checker automatically.
- Batch Scraping: Track dozens of Home Depot products at once—no need to set up a separate scraper for each SKU.
- Post-Processing with AI: Standardize price units, label discounts, even calculate per-square-foot prices on the fly.
- Export Anywhere: One-click export to Excel, Google Sheets, Airtable, or Notion. Your data, your way.
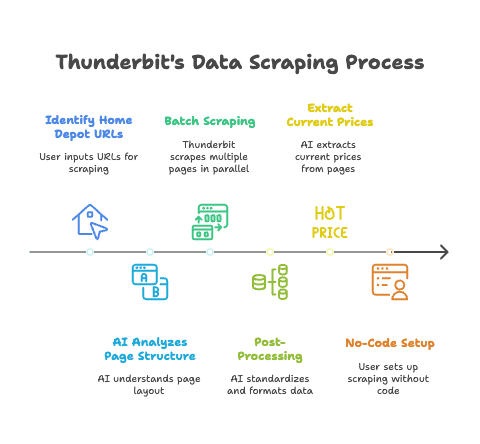
How to Set Up a Home Depot Price Tracker with Thunderbit
Let’s walk through how you’d actually use Thunderbit to track Home Depot prices—no coding, no fuss.
Step 1: Install Thunderbit and Open the Home Depot Page
First, and log in. Open the Home Depot product page you want to track—let’s say the (just as an example).
Step 2: Let AI Suggest the Data Fields
Click the Thunderbit extension and hit “AI Suggest Fields.” Thunderbit’s AI will scan the page and propose columns like Product Name, Price, Model #, Availability, etc. You can rename or remove fields as needed. For price tracking, you’ll want at least Product Name, Price, and Date.
Step 3: (Optional) Customize Fields with AI Prompts
Want to get fancy? Add a Field AI Prompt to standardize price units or add custom labels. For example:
- Standardize Price Format: “Output the price as a number (no currency symbol).”
- Unify Units: “If price is per square foot, calculate price per case using coverage info.”
- Label Discounts: “Output ‘Yes’ if a previous price or discount is shown, otherwise ‘No’.”
- Add Date: Include a “Date” column so every scrape is timestamped.
Thunderbit’s AI can handle these instructions, so your data is clean and ready for analysis.
Step 4: Test the Scrape
Run a one-time scrape to preview the data. Thunderbit will extract the info and show you a table—Product Name, Price, Model #, Date, etc. Make sure everything looks right.
Step 5: Set Up Scheduled Tracking
Here’s where Thunderbit shines. In the Scheduled Scraper, you just:
- Set up the schedule (e.g., “every day at 8am”).
- Enter the Home Depot product URLs you want to track (paste in as many as you like).
- Thunderbit’s AI auto-fills columns and rows, including pricing.
- Thunderbit scrapes all URLs in parallel (up to 50 at a time in cloud mode).
- Data is exported to your chosen destination (Google Sheets, Excel, Airtable, Notion).
Now you’ve got a Home Depot price tracker that runs itself.
Step 6: Receive and Use the Data
Check your Google Sheet (or wherever you exported the data). Each day, you’ll see a new row for each product, building a price history over time. If the RYOBI drill drops from $99 to $89, you’ll spot it instantly.
Customizing Your Price History Checker
Thunderbit isn’t just about grabbing prices—it’s about making the data work for you. Here’s how you can tailor your price tracker for Home Depot:
Choosing the Right Fields
At a minimum, track Product Name, Model #, Price, and Date. Home Depot pages often have multiple identifiers—“Internet #,” “Model #,” etc. Use these as stable IDs for tracking.
Standardizing Price Formats
Home Depot might show prices as “$299.00,” “$1.59/sq.ft,” or “$14.31/case.” Use Field AI Prompts to:
- Output prices as numbers (for calculations).
- Include or exclude currency symbols.
- Ensure all prices have two decimal places for consistency.
Handling Unit Prices
Some products are priced per unit, others per square foot or per case. For example:
- Product A: “$50 per case (covers 20 sq.ft, $2.50/sq.ft)”
- Product B: “$2.70/sq.ft”
Thunderbit can extract both the unit price and the total price, and even calculate missing values if needed. This way, you can compare apples to apples, no matter how Home Depot lists the price.
Adding Custom Labels or Flags
Want to know if an item is on sale? Add a column “On Sale?” and instruct Thunderbit to fill it with “Yes” or “No” based on the presence of a “Was” price or discount label.
Combining Data from Multiple Page Types
Thunderbit can scrape both product detail pages and category/search results pages. Use subpage scraping to gather broad and detailed data in one go.
Thunderbit’s Advantages for Home Depot Price Tracking
Let’s get specific about why Thunderbit is such a good fit for Home Depot price tracking:
No Need to Configure Templates for Each Site
Thunderbit’s AI understands Home Depot’s page structure. You don’t need to build a new scraper for every product or every site. Just paste in the URLs, and Thunderbit figures it out.
Example: You want to track 20 different Home Depot SKUs. Instead of setting up 20 scrapers, you paste all URLs into one Thunderbit schedule. Done.
Batch Scraping: Track Multiple Products at Once
Thunderbit scrapes up to 50 pages in parallel. Whether you’re monitoring 5 products or 100, it’s fast and efficient.
Example: Your ops team wants to track all cordless drills, saws, and sanders. Paste all the URLs into Thunderbit, and you’ll get a unified dataset each day.
Post-Processing: AI Can Label, Translate, or Format Data
Thunderbit’s AI can standardize price units, add discount labels, or even calculate per-square-foot prices.
Example: Flooring products list prices as “$1.59/sq.ft” or “$14.31/case.” Thunderbit can extract both and calculate the unit price for comparison.
Handles Inconsistent Field Names or Formats
Home Depot might label prices as “Now,” “Sale,” “Special Buy,” or just show a single price. Thunderbit’s AI understands the context and extracts the right value.
Example: One product shows “Was $150, Now $120.” Another just shows “$89.99.” Thunderbit captures the current price in both cases, and can also extract the “Was” price if you want to track discounts.
No-Code Setup: Just Two Inputs, No Selectors or Scripts
You don’t need to write a single line of code. Set the schedule, enter the URLs, and Thunderbit does the rest.
Example: Your ecommerce team sets up a Home Depot price tracker in under five minutes—no IT help required.
Example: Unifying Price Units Across Home Depot Listings
Suppose you’re tracking two flooring products:
- Product A: “$50 per case (covers 20 sq.ft, $2.50/sq.ft)”
- Product B: “$2.70/sq.ft”
With Thunderbit, you can set up fields for Unit Price and Total Price. The AI will extract “$2.50” for Product A and “$2.70” for Product B, so you can compare unit prices directly—even if Home Depot lists them differently.
Example: Handling Inconsistent Field Names
Home Depot sometimes shows prices as “Now,” “Sale,” “Special Buy,” or just a plain price. Thunderbit’s AI recognizes these patterns and extracts the current price every time. If you want to track the “Was” price for sale items, just add a field—Thunderbit will fill it in when present and leave it blank otherwise.
Comparing Thunderbit to Other Home Depot Price Trackers
Let’s put Thunderbit side-by-side with other popular tools:
| Feature | Thunderbit (AI Scraper) | Octoparse (Visual Scraper) | Visualping (Change Monitor) |
|---|---|---|---|
| Ease of Use | Very easy (AI-driven, minimal setup; 2-click scraping) | Moderate (point-and-click interface but can be complex) | Very easy (simple highlight-to-monitor) |
| No-Code Required | Yes, completely no-code (AI suggests everything) | Yes, but requires learning the tool | Yes, no coding (just visual selection) |
| Batch Tracking | Yes, scrape multiple URLs in one job (50+ concurrently) | Yes, but requires task setup | Limited (one page per monitor) |
| Scheduled Runs | Yes, built-in scheduler with plain English setup | Yes, scheduler on cloud plans | Yes, can check at intervals |
| Data Output | Structured data (tables), export to Sheets/Excel/DB | Structured data, export after run | Change logs/alerts (not in one table) |
| Historical Data | Easily accumulated via scheduled scraping | Possible, but must aggregate manually | Only via notifications |
| Adaptability | High—AI adapts to site layout or label changes | Medium—workflows need updates | Medium—can misfire if layout changes |
| Post-Processing | Yes—AI can clean/transform data (units, labels, etc.) | Minimal—user must post-process | None—just reports raw page changes |
| Technical Skill | None (suitable for any business user) | Some (understand scraping concepts) | None (anyone can set an alert) |
| Cost for Use Case | Low—free tier for small use; ~$9/mo for moderate use | Higher—~$119/mo for cloud | Low/Medium—small number of checks cheap; large scale expensive |
Thunderbit is built for business users who want quick, actionable data without technical fuss. Octoparse is for power users who don’t mind spending time configuring scrapers (and paying more for advanced features), and Visualping is best for simple alerts on a small scale.
Best Practices for Using a Home Depot Price Tracker
Having the right tool is only half the battle. Here’s how to get the most out of your Home Depot price tracker:
1. Choose the Right Products to Monitor
- Direct Competitor Products: Track Home Depot SKUs that compete with your own.
- Your Own Products on Home Depot: If you’re a vendor, monitor your listings for price changes or errors.
- Market Benchmark Products: Track flagship items to spot market trends.
Remember, Home Depot’s means they’re watching competitors too—so you should, as well.
2. Set an Appropriate Frequency
- Daily: Good for most products—captures all but the fastest price changes.
- Twice Daily or Hourly: For volatile categories or during major sales events.
- Weekly: For stable categories or long-term trends.
Start with daily, then adjust based on how often prices actually change.
3. Leverage Alerts for Big Changes
While Thunderbit doesn’t send alerts by default, you can set up conditional formatting or scripts in Google Sheets to flag big price drops. Or use Thunderbit’s AI to add a “Price Change” flag when today’s price differs from yesterday’s.
4. Analyze the Price History Data
- Plot price trends: See if Home Depot discounts at certain times of year.
- Calculate lowest/average prices: Useful for negotiations and promotions.
- Compare across retailers: If you track Lowe’s or Amazon too, see who leads on price changes.
- Answer “does Home Depot price match”: If you see Home Depot drop prices to match a competitor, you have the data to back it up.
5. Integrate with Team Workflows
- Google Sheets: Share dashboards with your team.
- Airtable/Notion: Build custom workspaces or trigger notifications.
- Sales Teams: Use price history in negotiations or customer conversations.
6. Maintain Your Setup
Thunderbit’s AI adapts to most site changes, but it’s smart to check your setup every few weeks. Re-run “AI Suggest Fields” if Home Depot does a major redesign.
7. Stay Within Ethical and Legal Bounds
Scraping public pricing data is standard practice, but don’t overload Home Depot’s servers. Thunderbit’s polite scheduling helps you stay within reasonable limits.
Conclusion: Smarter Price Tracking for Non-Technical Teams
In ecommerce, knowledge really is power. With nearly all shoppers comparing prices and retailers like Home Depot ready to match any competitor, having up-to-date price data isn’t optional—it’s essential. For too long, only teams with coding skills or big budgets could build a real Home Depot price tracker or price history checker.
Thunderbit changes that. With its no-code, AI-powered approach, anyone—from a seasoned analyst to a marketing coordinator—can set up a robust Home Depot price tracker in minutes. You get:
- Simplicity: No-code setup, AI does the heavy lifting.
- Comprehensiveness: Track multiple products, multiple data points, all in one place.
- Consistency and Accuracy: AI adapts to site changes, so your data stays reliable.
- Automation: Scheduled scraping builds your price history automatically.
- Actionability: Export to your favorite tools, analyze trends, and make smarter decisions.
For ecommerce teams without a developer on staff, Thunderbit is like having a secret weapon. It levels the playing field, letting you compete with bigger teams and deeper pockets.
If you’re ready to stop guessing and start knowing, today. Set up your Home Depot price tracker, and let data—not guesswork—drive your pricing strategy. You’ll wonder how you ever managed without it.
Want to dive deeper? Check out more tips and guides on the , including and .
Ready to build your own Home Depot price tracker?
FAQs
1. Why should ecommerce teams track Home Depot prices?
Because Home Depot is often used as a pricing benchmark, tracking their prices helps teams stay competitive, time promotions, negotiate better vendor terms, and respond to price match policies. Nearly 90% of shoppers compare prices before buying—missing a price drop can cost sales.
2. What are the downsides of traditional price tracking methods?
Manual tracking is time-consuming and error-prone. Code-based scraping requires technical skills and constant maintenance. Visual tools like Octoparse or Visualping either have steep learning curves or lack structured data output. None of them are ideal for non-technical business users tracking multiple SKUs.
3. How does Thunderbit simplify Home Depot price tracking?
Thunderbit is an AI-powered, no-code web scraper. It automatically detects and extracts product data, handles dynamic pages, and lets you track dozens of SKUs in parallel. It builds a price history over time with scheduled scraping and outputs clean, structured data to your tool of choice.
4. Can Thunderbit track both product and category pages?
Yes. Thunderbit can scrape both product detail pages and category/search result pages. This enables you to monitor individual SKUs as well as broad product groups, all within a single scraping schedule.
5. What makes Thunderbit better than other Home Depot price trackers?
Thunderbit offers true no-code setup, AI field detection, batch URL tracking, built-in scheduling, and AI-powered data cleanup. Compared to tools like Octoparse or Visualping, it’s faster to set up, easier to use, and delivers cleaner, structured outputs—perfect for business teams without developers.