
Picture this: you’re sipping your morning coffee, scrolling through your phone, and you see a post from a friend in another country, a meme from your favorite brand, and—oh look—your neighbor selling a couch on Marketplace. Welcome to Facebook in 2025, where nearly 40% of Earth’s population is doing the exact same thing, every single month (). Whether you’re a marketer, a business owner, or just someone trying to keep up with your family group chat, Facebook’s reach is so massive it’s almost hard to wrap your head around.
But here’s the thing: with over 3 billion monthly active users and more than 2 billion daily logins (), Facebook isn’t just a social network—it’s the digital town square, the world’s largest marketplace, and arguably the most important platform for anyone in digital marketing, sales, or e-commerce. If you’re not paying attention to the latest Facebook statistics, you’re missing out on insights that could shape your entire strategy. So, let’s dive into the numbers that matter most in 2025 and 2026.
Key Statistics Overview:
Facebook by the Numbers: How Many Users Does Facebook Have?
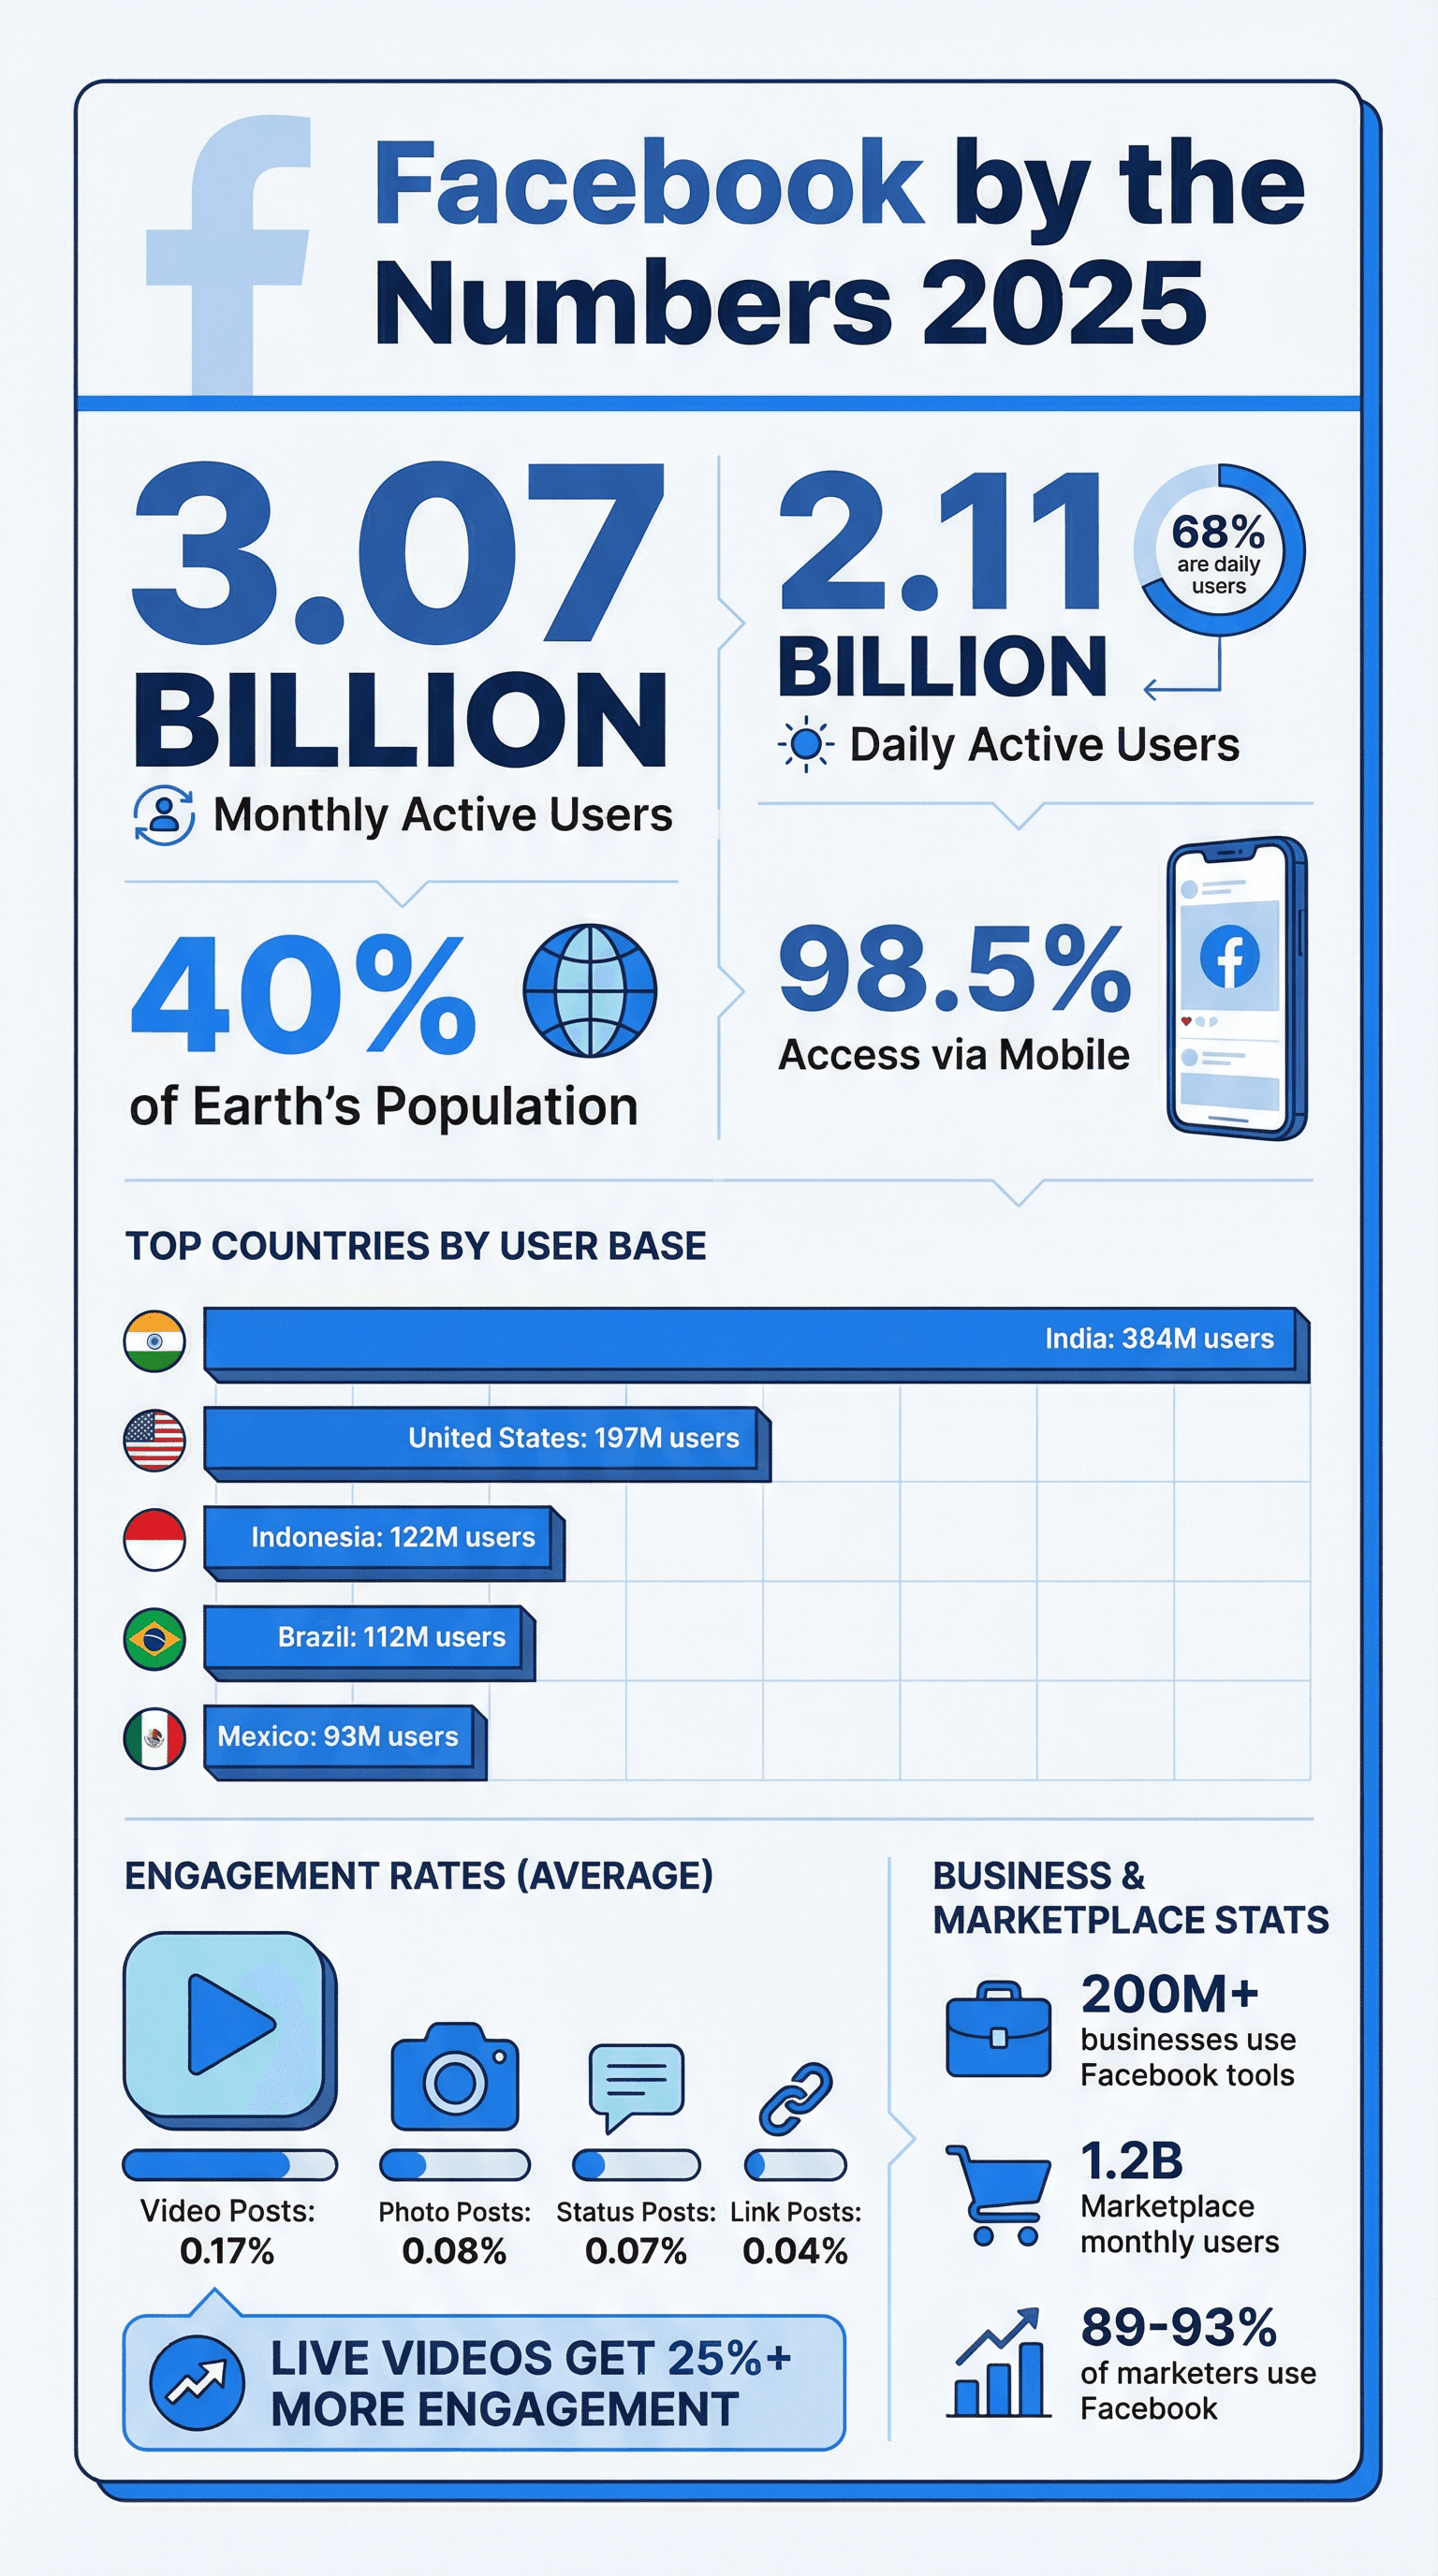
Let’s start with the headline: Facebook has 3.07 billion monthly active users (MAUs) as of 2025, growing about 3% year-over-year (). That’s not just a big number—it’s a number so big, it’s almost comical. Imagine the entire populations of the Americas, Europe, and Africa combined, and you’re still not quite there.
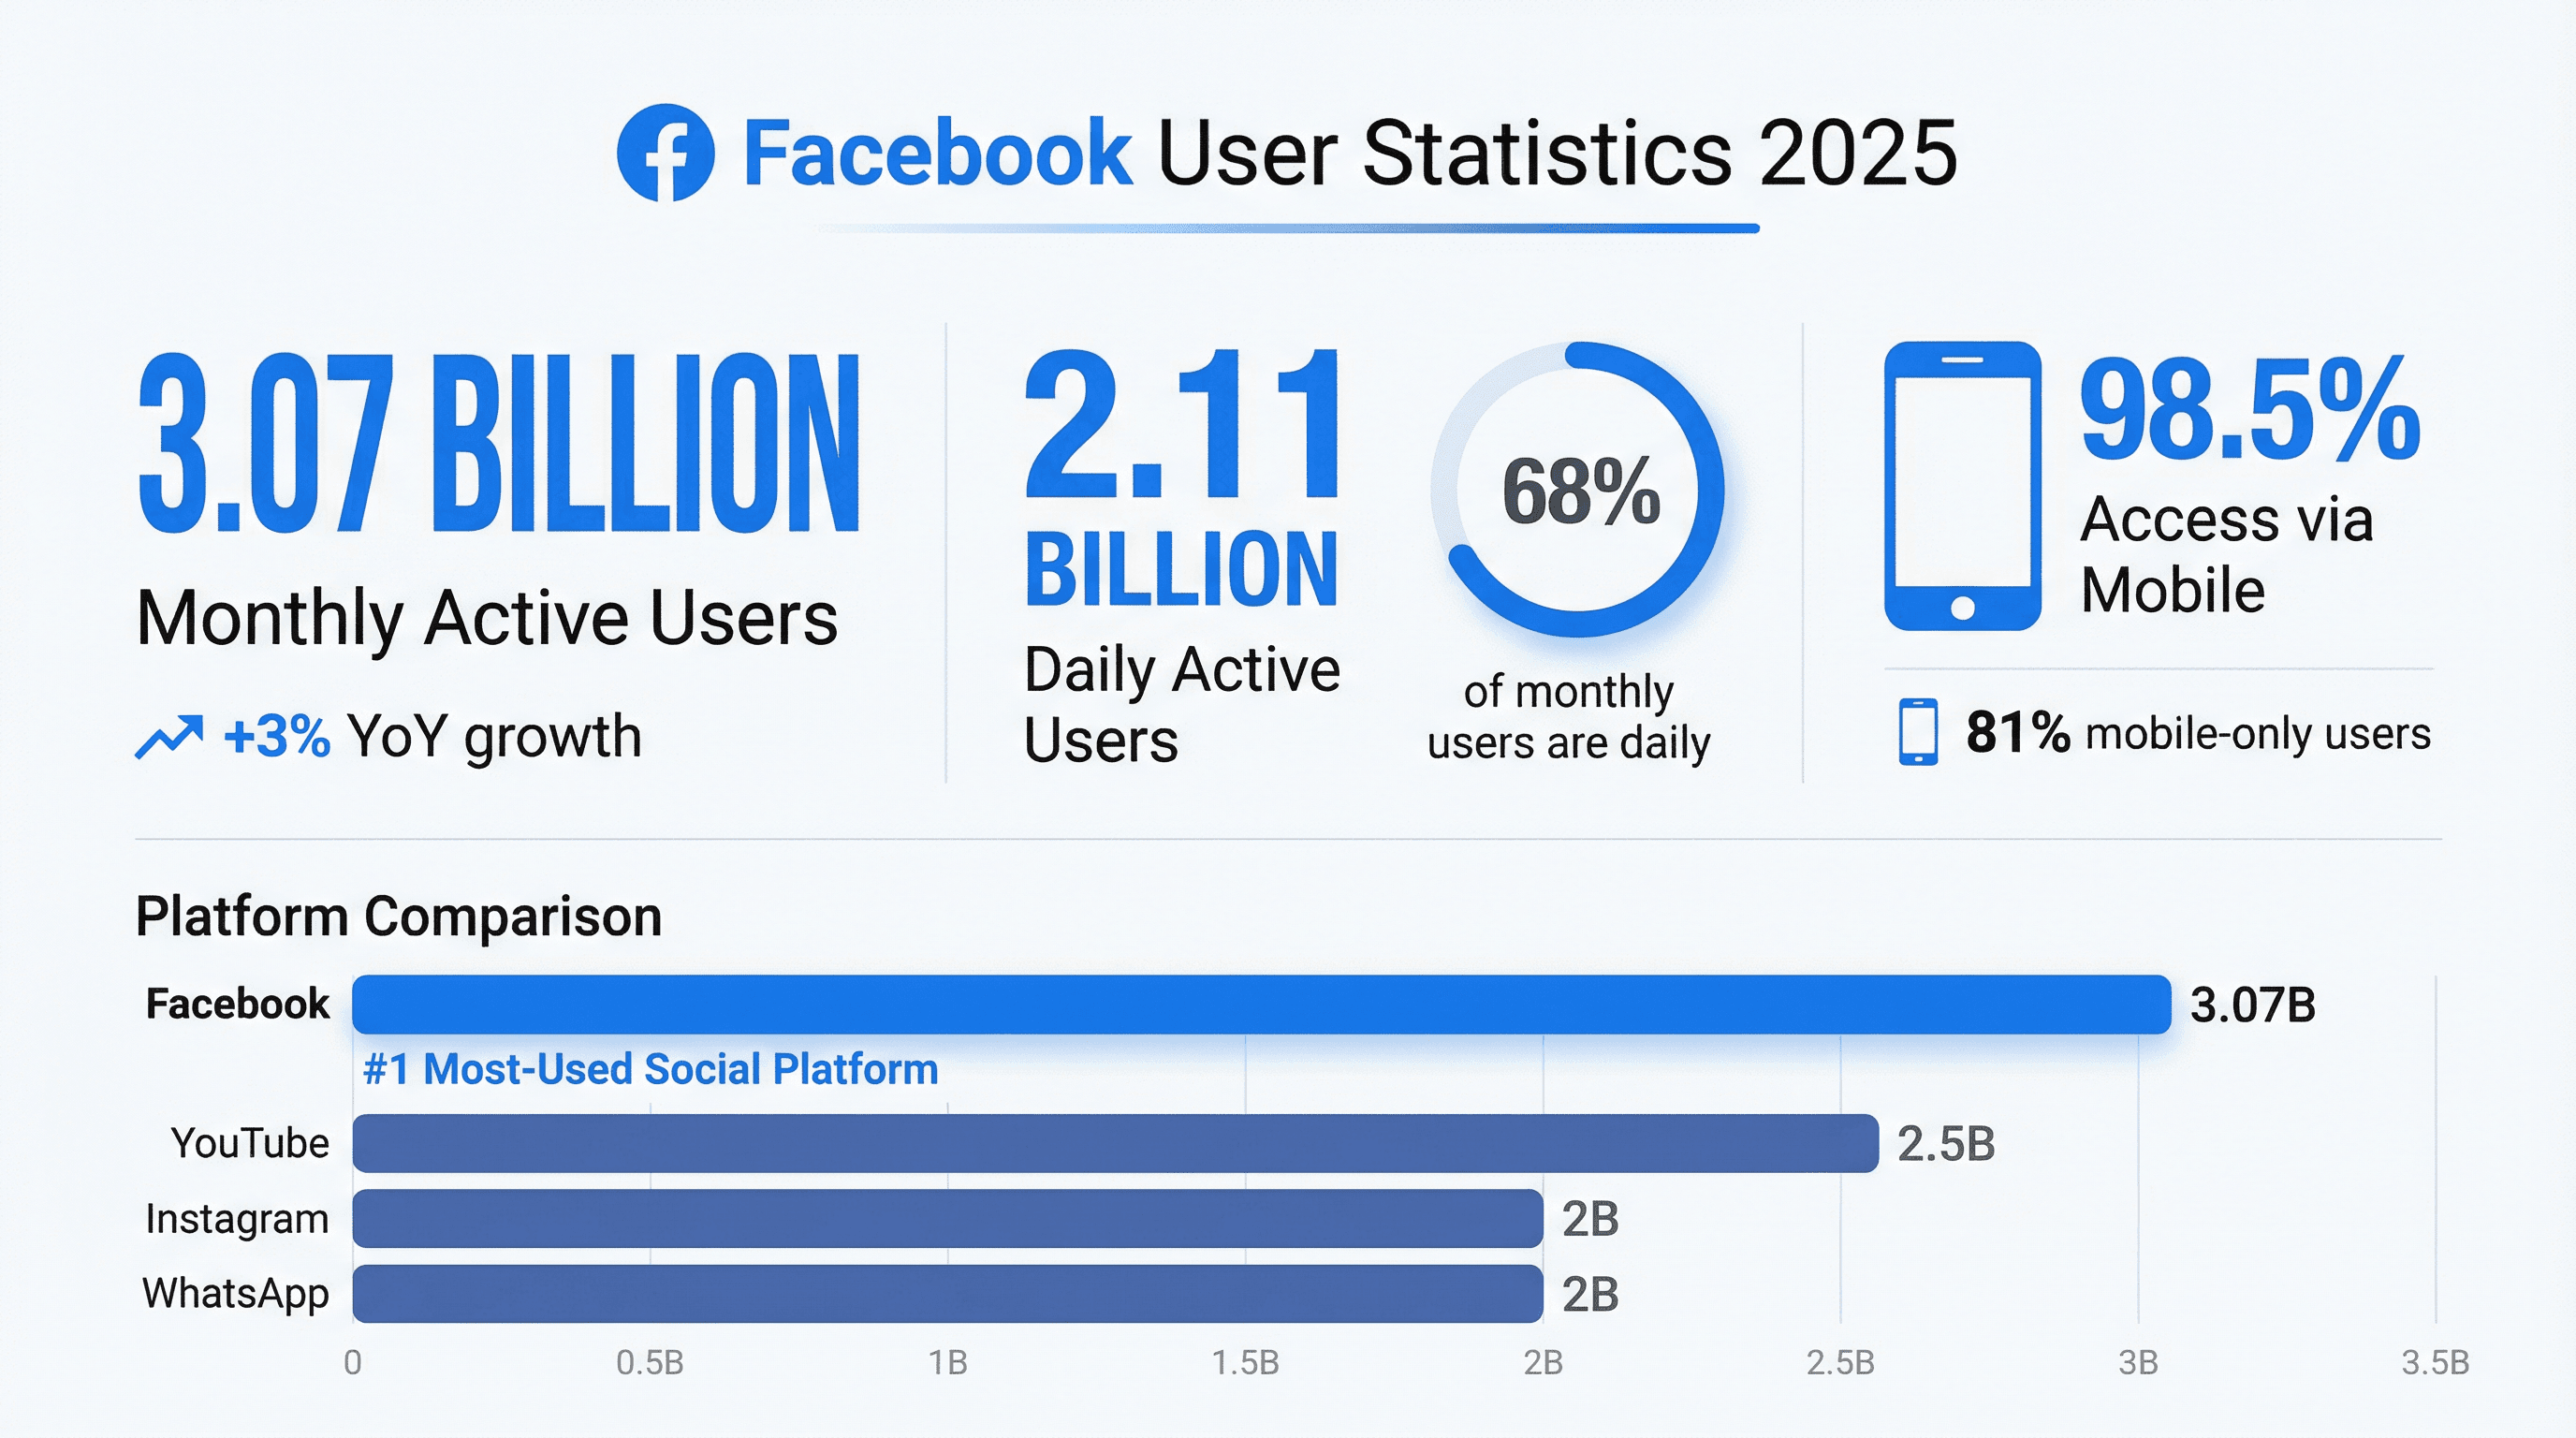
- Daily Active Users (DAUs): 2.11 billion people log in every single day (), which means about 68% of Facebook’s monthly users are daily users. That’s a level of stickiness most apps can only dream of.
- Year-over-Year Growth: Despite being two decades old, Facebook’s user base is still growing—especially in emerging markets.
- How does Facebook stack up? The next closest competitor is YouTube, with about 2.5 billion MAUs, followed by Instagram and WhatsApp (each around 2 billion) (). Facebook is still the #1 most-used social platform worldwide, by a wide margin.
And don’t forget device usage: 98.5% of users access Facebook via mobile (), and over 81% are mobile-only. If you’re still designing Facebook content for desktop first, it’s time to join us in the 2020s.
Global Facebook Users: Where in the World is Facebook Most Popular?
Facebook’s reach is truly global, but some countries stand out as Facebook superpowers:
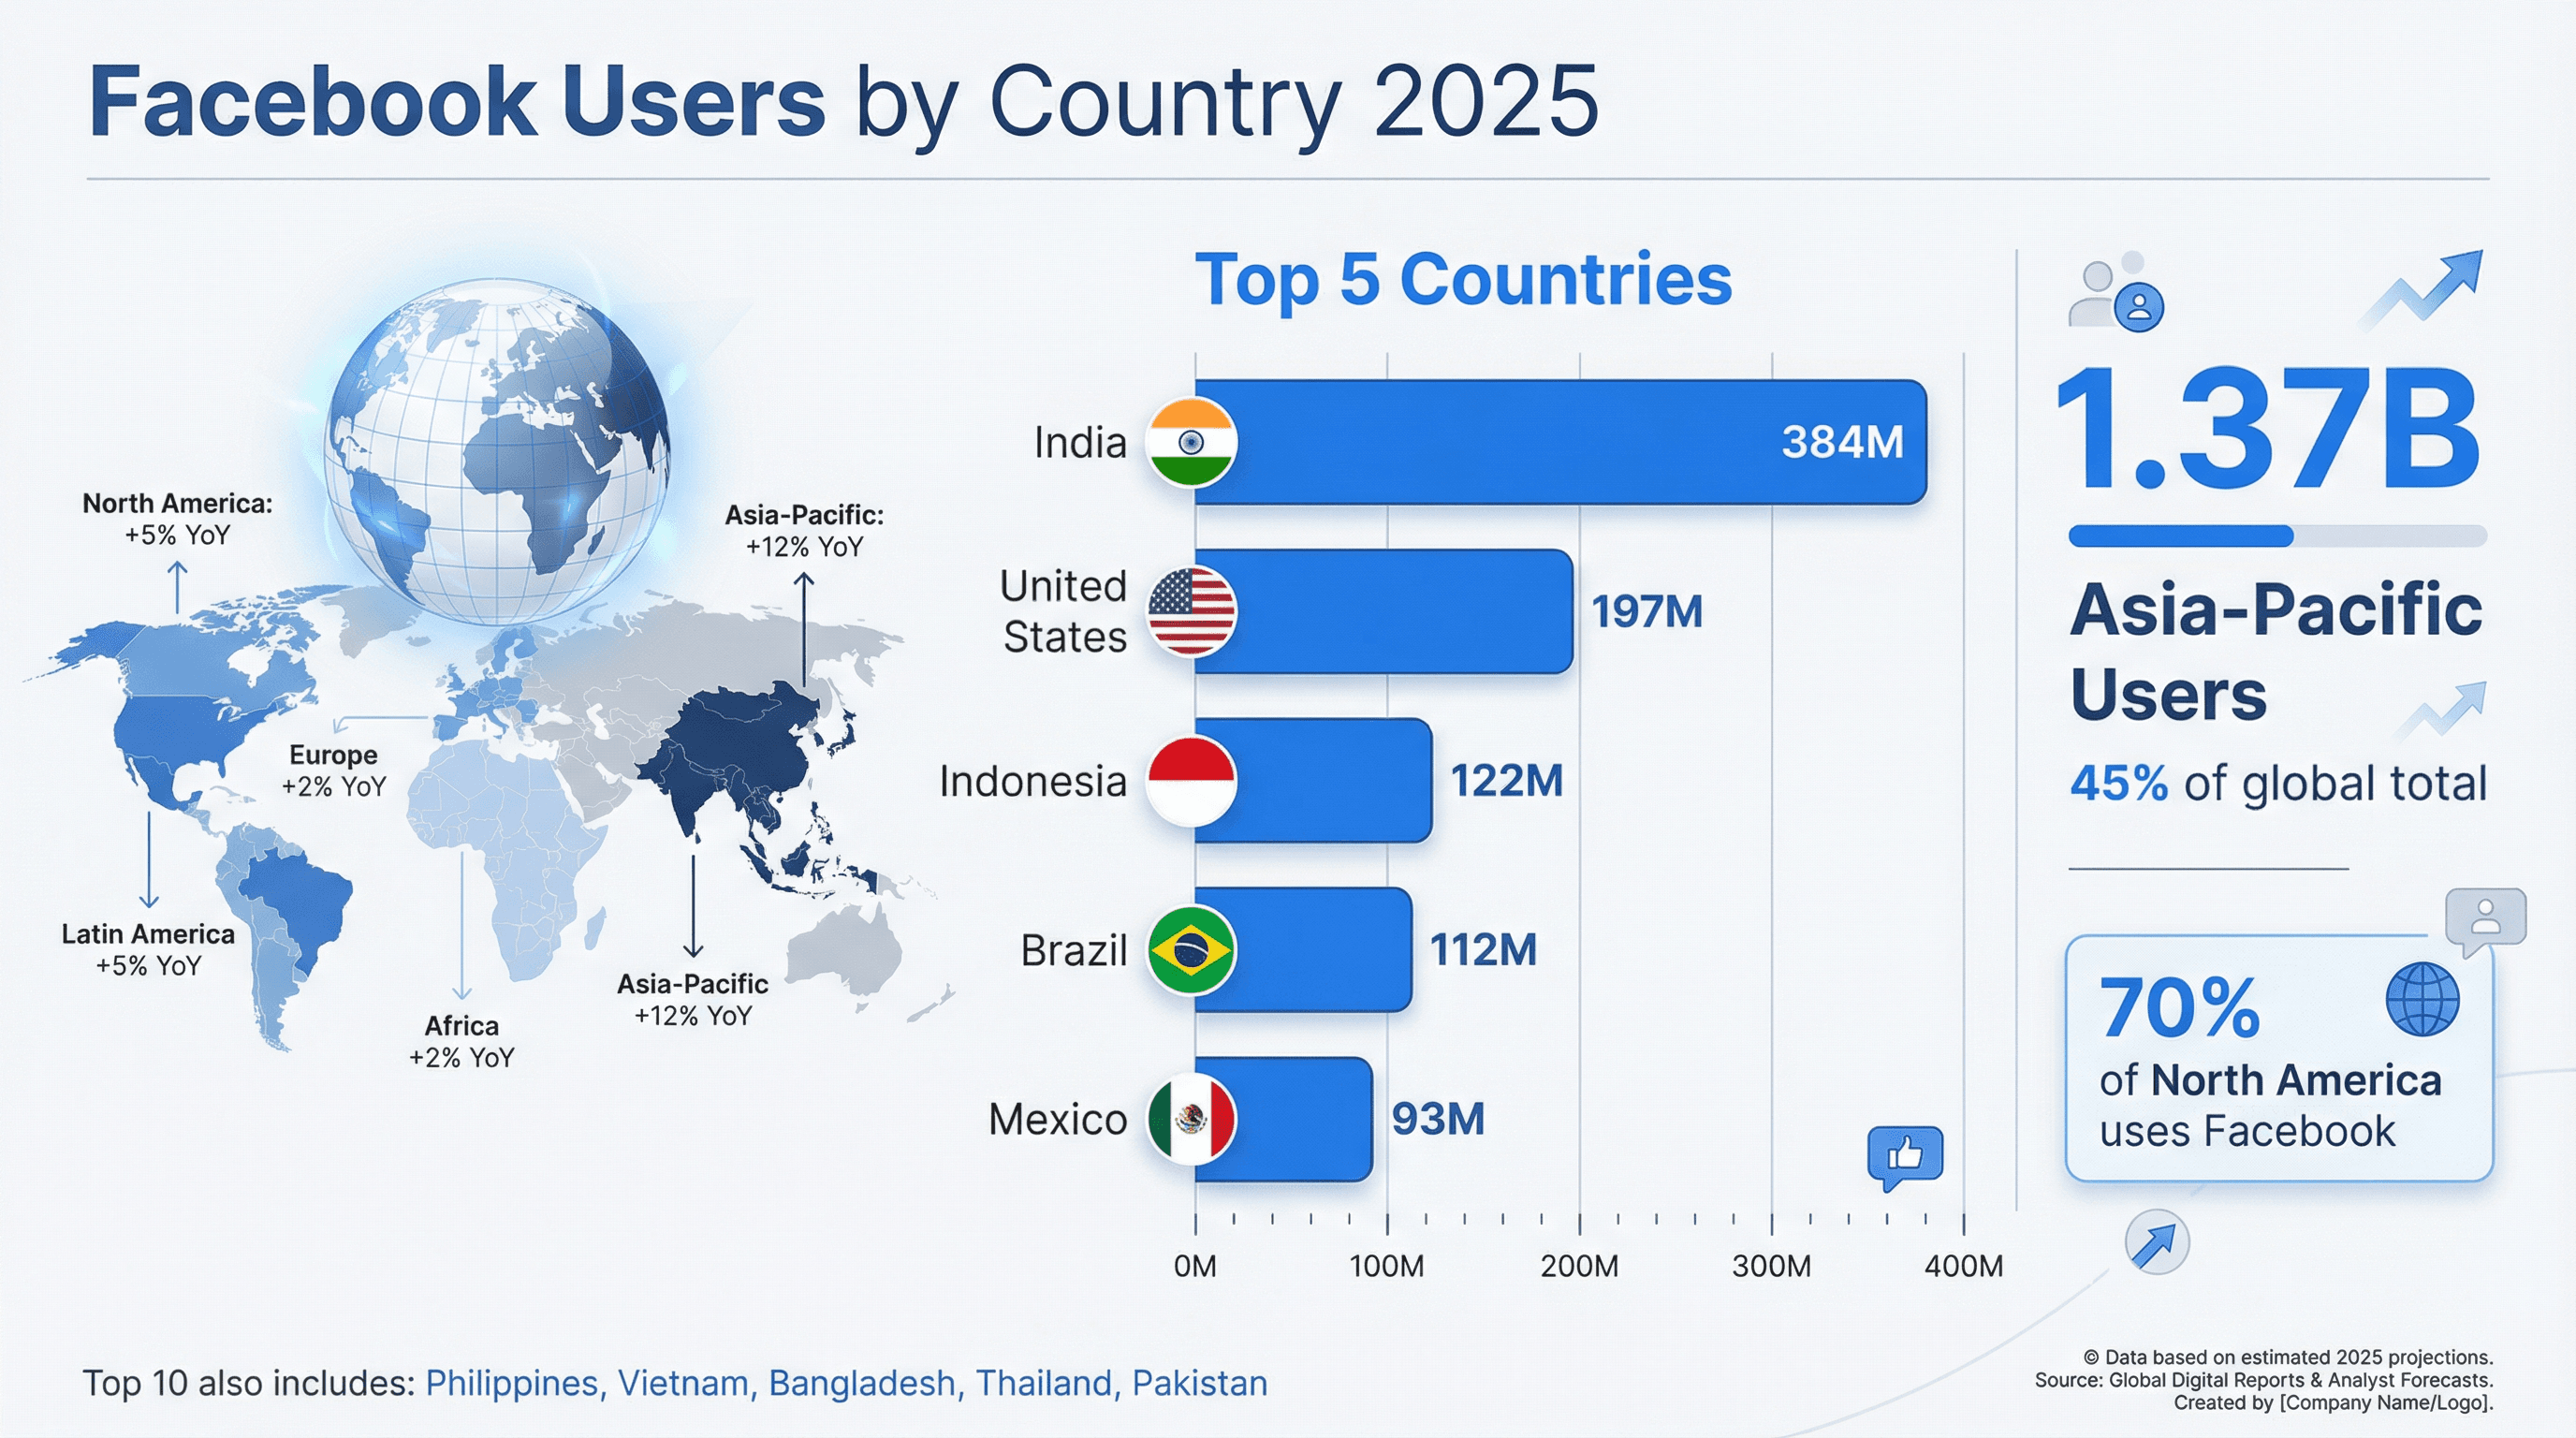
- India is the largest Facebook market with an estimated 383–384 million users—that’s more than the entire U.S. population ().
- United States: About 197 million users ().
- Indonesia: ~122 million
- Brazil: ~112 million
- Mexico: ~93 million
Rounding out the top ten are the Philippines, Vietnam, Bangladesh, Thailand, and Pakistan. In fact, Asia-Pacific is Facebook’s fastest-growing region, with about 1.37 billion MAUs—nearly 45% of the global total ().
In North America and Western Europe, growth has plateaued, but usage remains sky-high: about 70% of North America’s population uses Facebook (). In many developing markets, Facebook is the internet for millions of people—a primary source for news, communication, and even shopping.
Facebook Demographics: Who’s Really Using Facebook?
Facebook’s audience is as diverse as it gets, but there are some clear demographic trends:
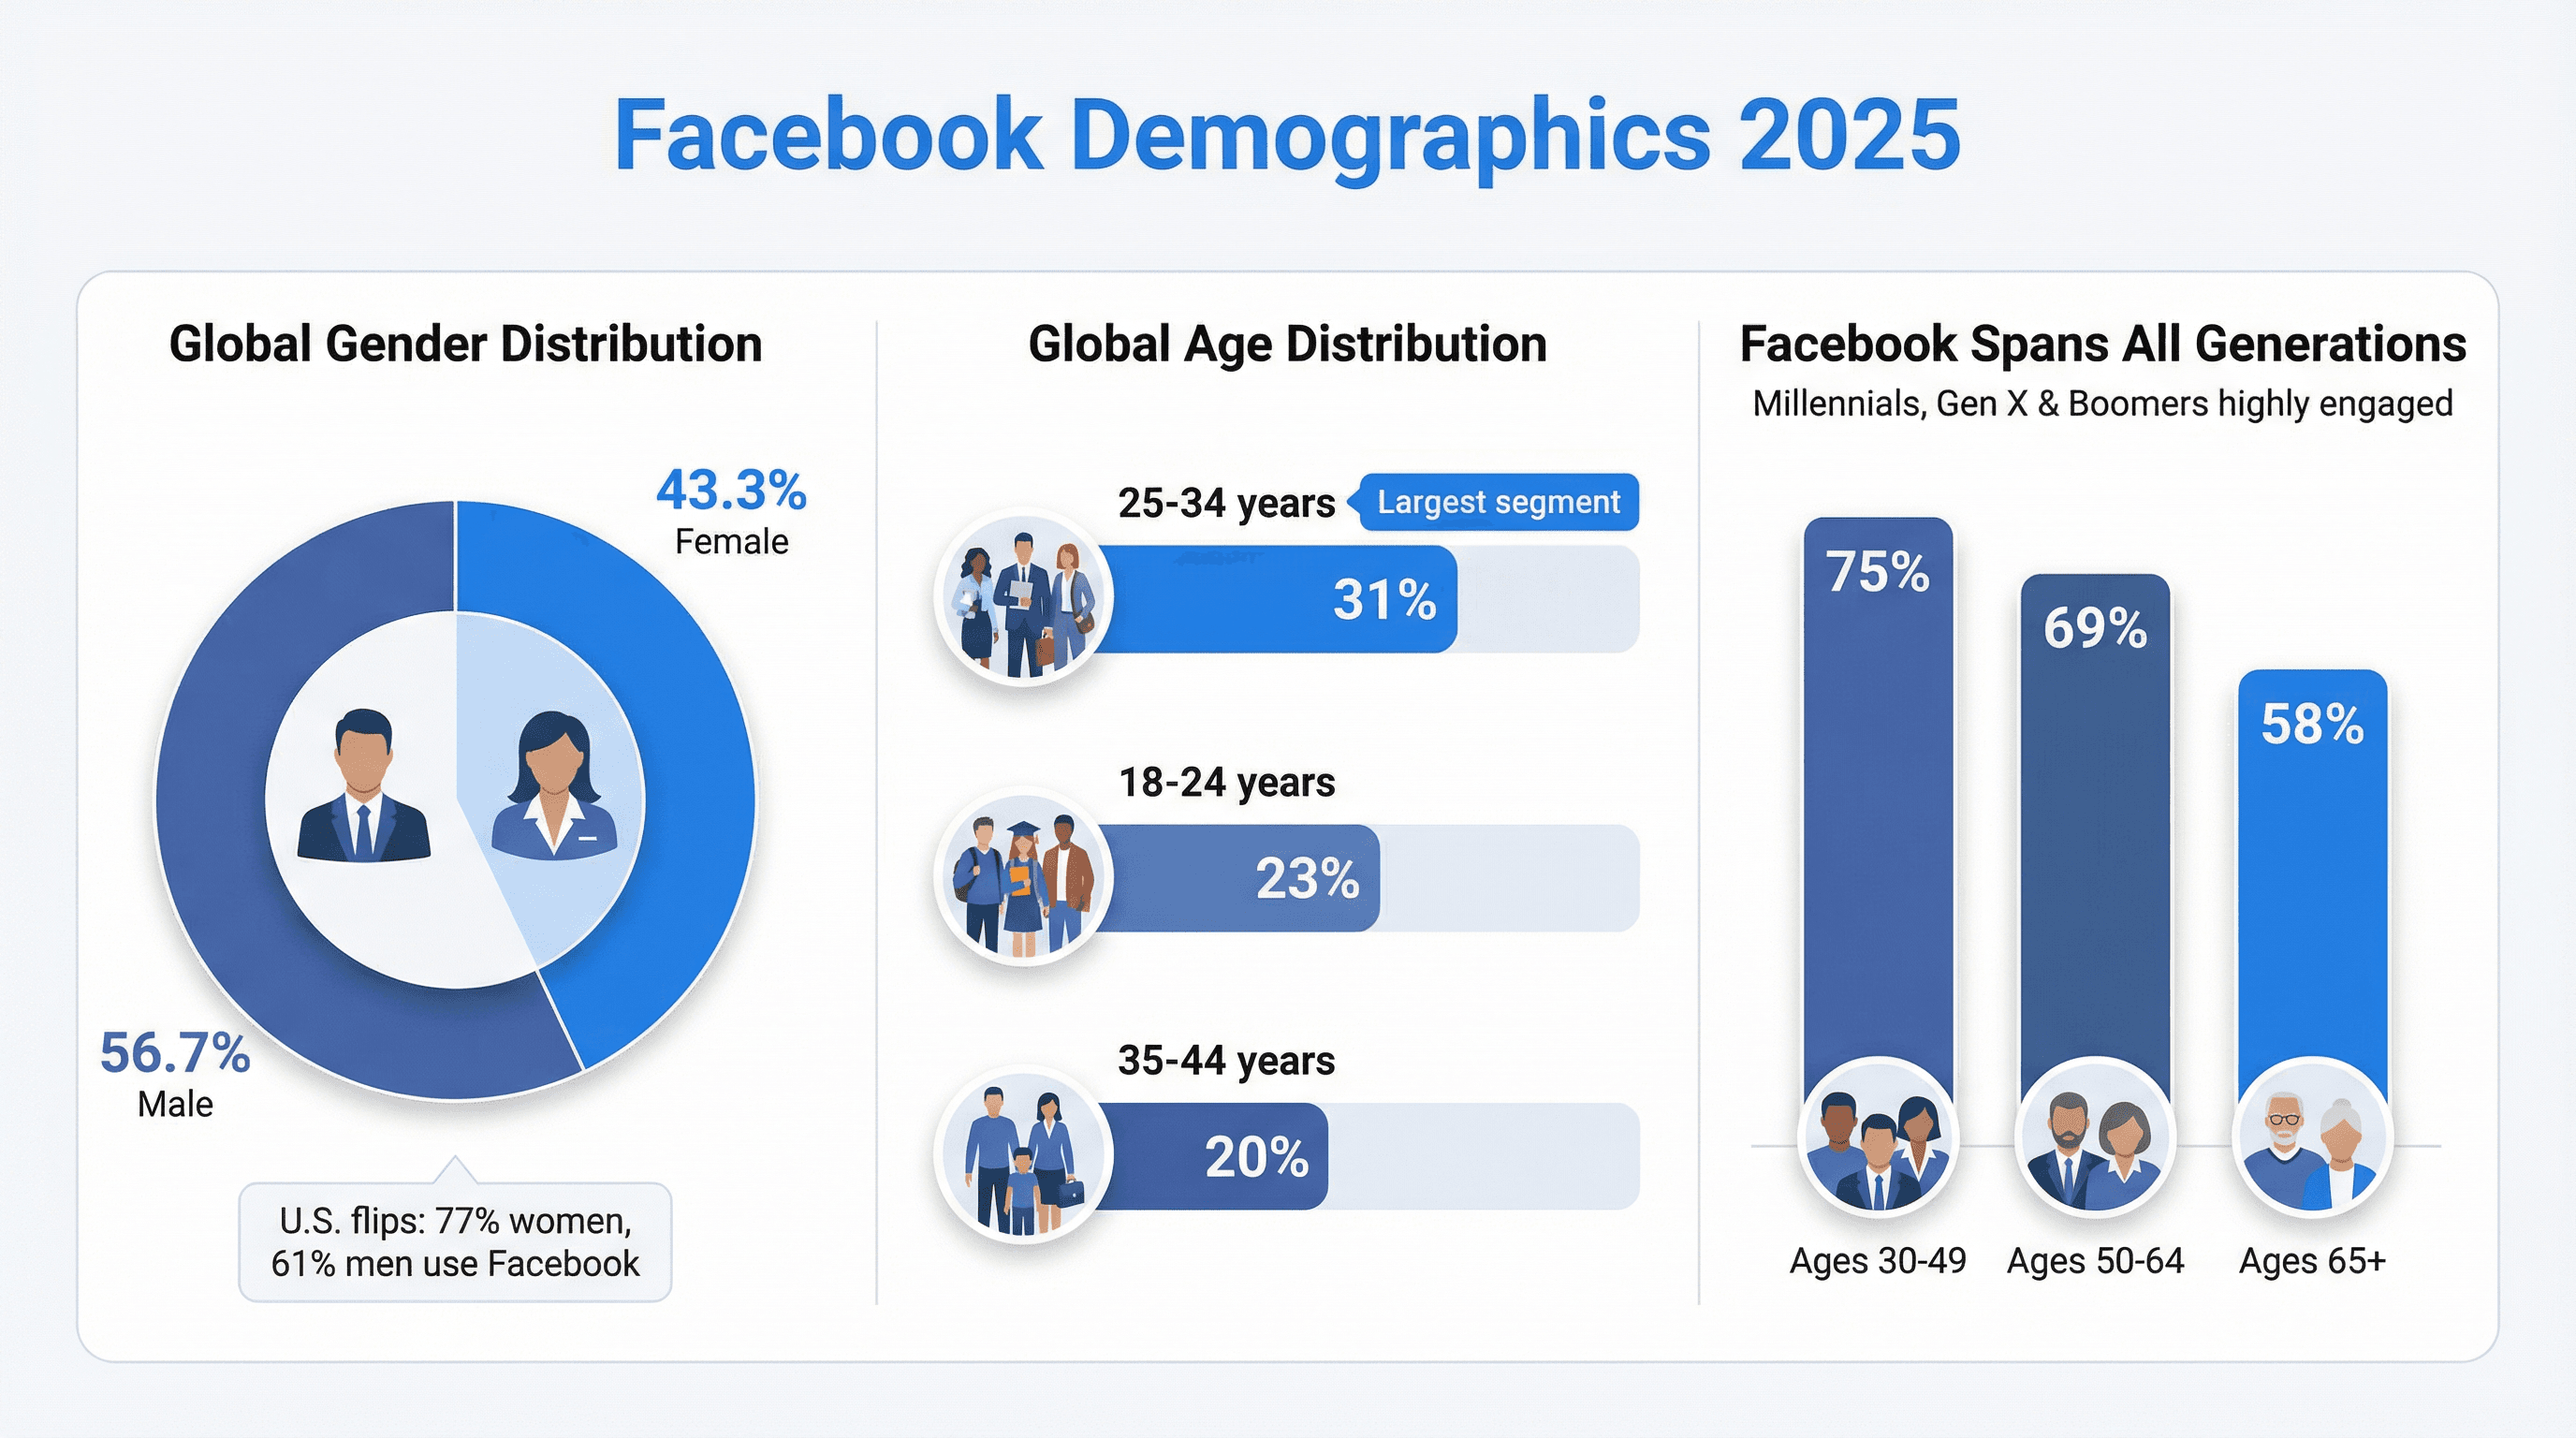
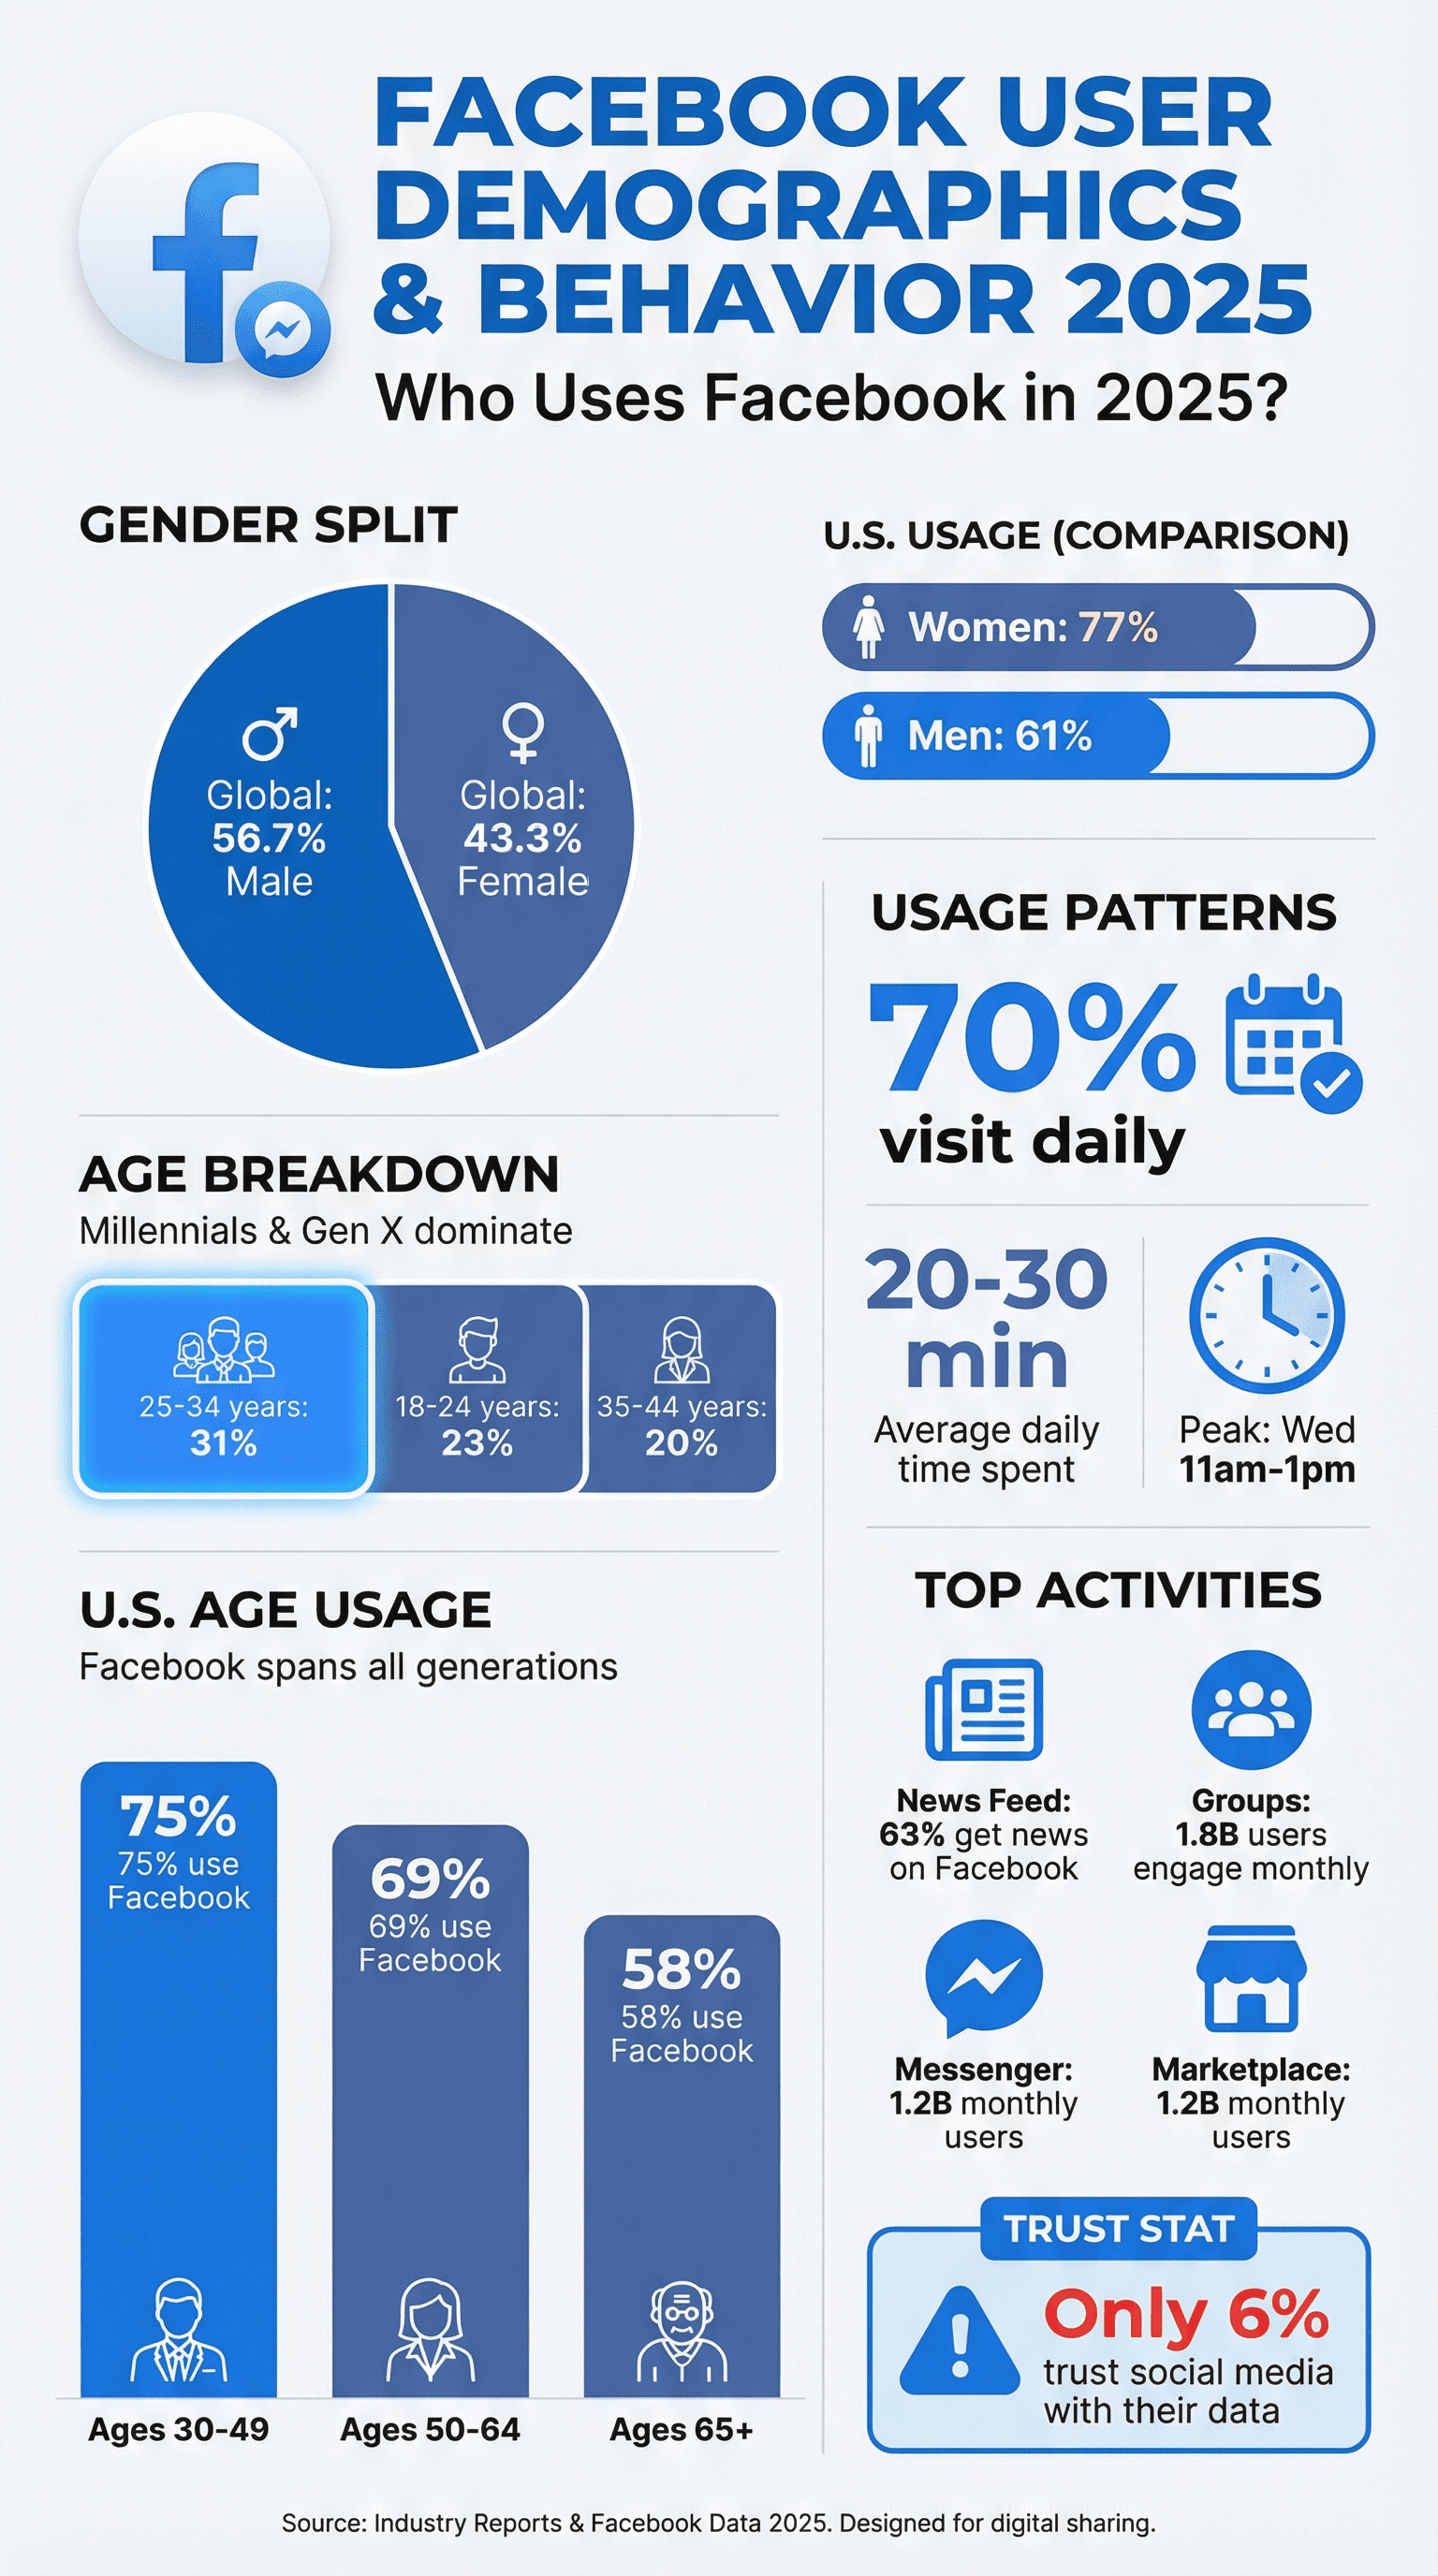
- Gender Split (Global): About 56.7% male, 43.3% female (). In the U.S., it flips: 54% of users are women.
- Age Breakdown (Global):
- 25–34: 31% of users ()
- 18–24: 23%
- 35–44: 20%
- U.S. Age Trends:
- 75% of people aged 30–49 use Facebook
- 69% of those 50–64
- 58% of seniors 65+ ()
Younger teens and Gen Z are less active on Facebook compared to platforms like TikTok or Snapchat, but Millennials, Gen X, and Boomers are still highly engaged. In the U.S., 77% of women and 61% of men report using Facebook (). Usage is also consistent across education and income levels—Facebook really is for everyone.
Facebook Usage Patterns: How, When, and Why People Use Facebook
So, what are all these billions of people actually doing on Facebook?
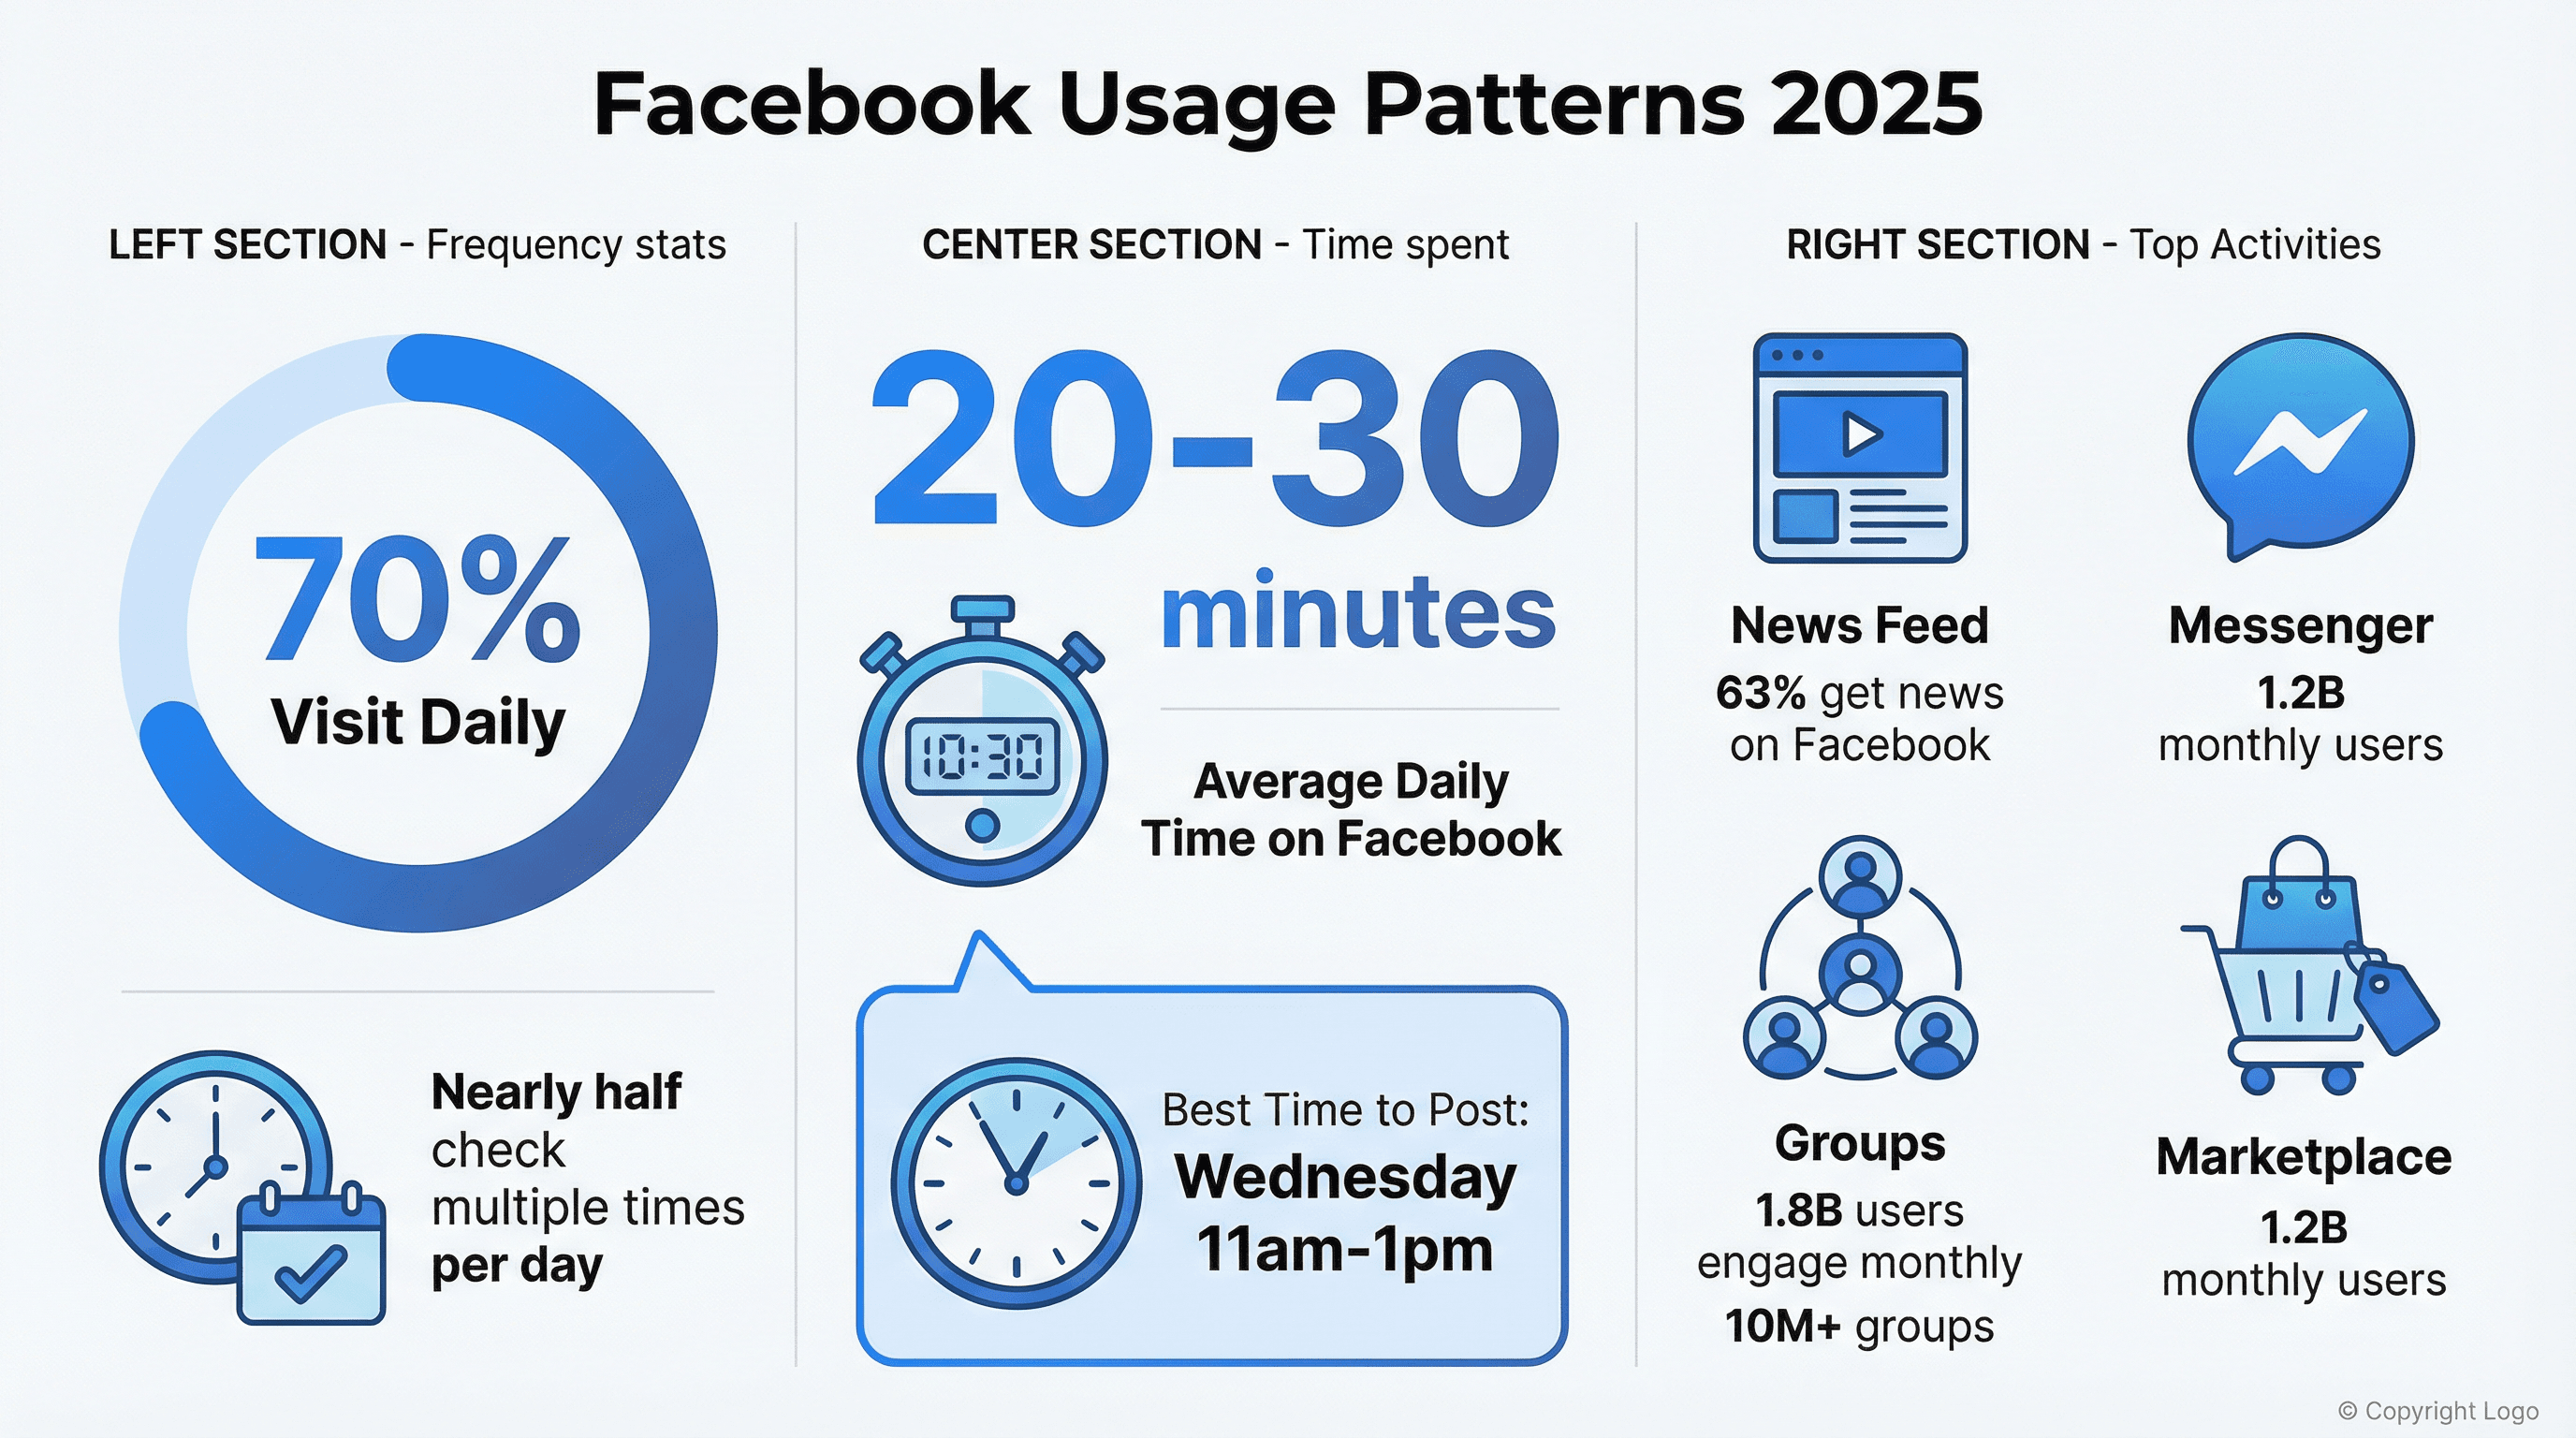
- Frequency: About 70% of users visit Facebook at least once daily, and nearly half check in several times a day ().
- Time Spent: U.S. adults spend about 20–30 minutes per day on Facebook (), with some estimates showing a slight decline as users split time with other apps.
- Peak Times: Engagement spikes mid-week, late morning to early afternoon—especially Wednesdays between 11am–1pm (). Weekends and late nights? Not so much.
Top Activities:
- News Feed Browsing: 63% of users get news on Facebook ().
- Groups: Over 10 million groups exist, and 1.8 billion users engage with groups each month ().
- Video & Stories: Video content is huge, with Facebook Live and Stories driving engagement.
- Messenger: Over 1.2 billion monthly users ().
- Marketplace: 1.2 billion monthly users are buying and selling ().
Why do people use Facebook? To stay connected, get news, find entertainment, shop, and participate in communities. And let’s be honest—sometimes just to procrastinate.
Facebook Engagement: What Content Gets the Most Attention?
Not all posts are created equal. Here’s what the numbers say about engagement:
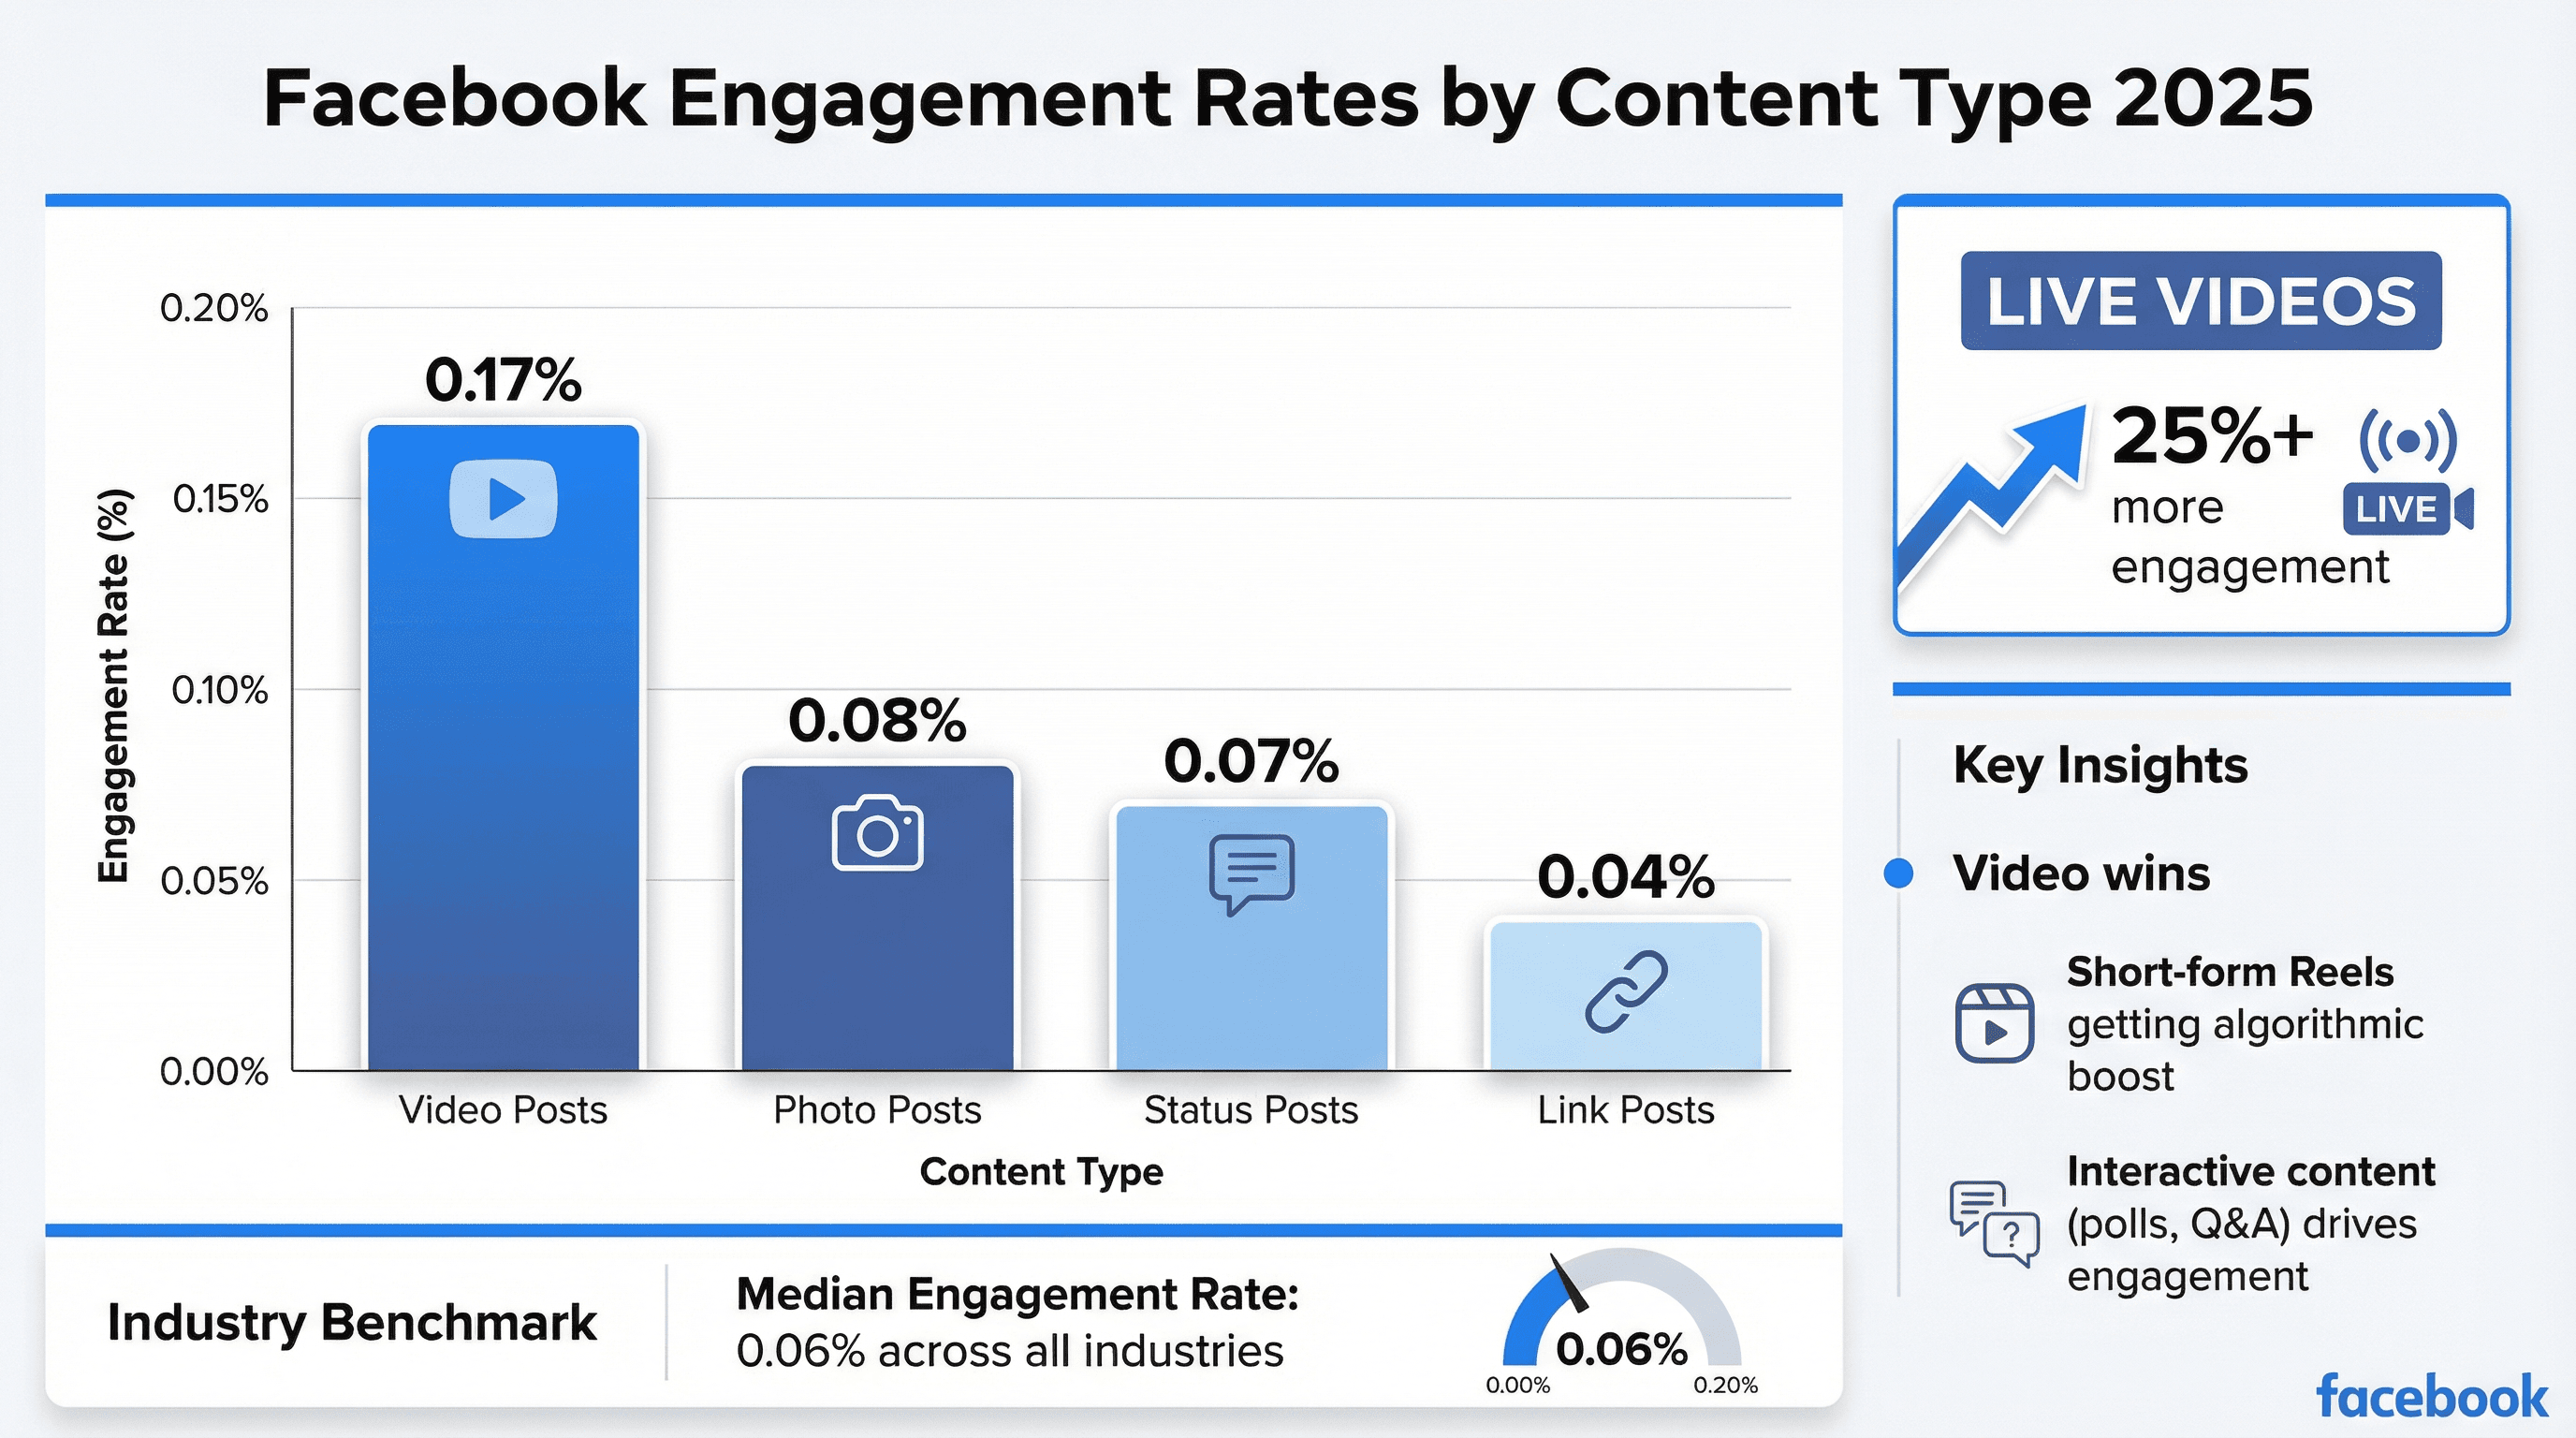
- Video Posts: Highest engagement, averaging 0.17% per post (). Live videos do even better—at least 25% more engagement than regular posts.
- Photo Posts: About 0.08% engagement ().
- Status (Text) Posts: Around 0.07%.
- Link Posts: The lowest, at 0.04% ().
Industry Benchmarks: The median engagement rate across all industries is a mere 0.06% (). But remember, with billions of users, even a tiny percentage can mean massive reach.
Trends to Watch:
- Short-form video (Reels) is getting algorithmic love.
- Stories are used by hundreds of millions daily.
- Interactive content (polls, quizzes, Q&A) spurs more engagement.
The bottom line? If you want attention, go visual, go video, and spark conversations.
Facebook for Business: Key Statistics for Marketers and Brands
Facebook isn’t just for memes and baby photos—it’s a business powerhouse:
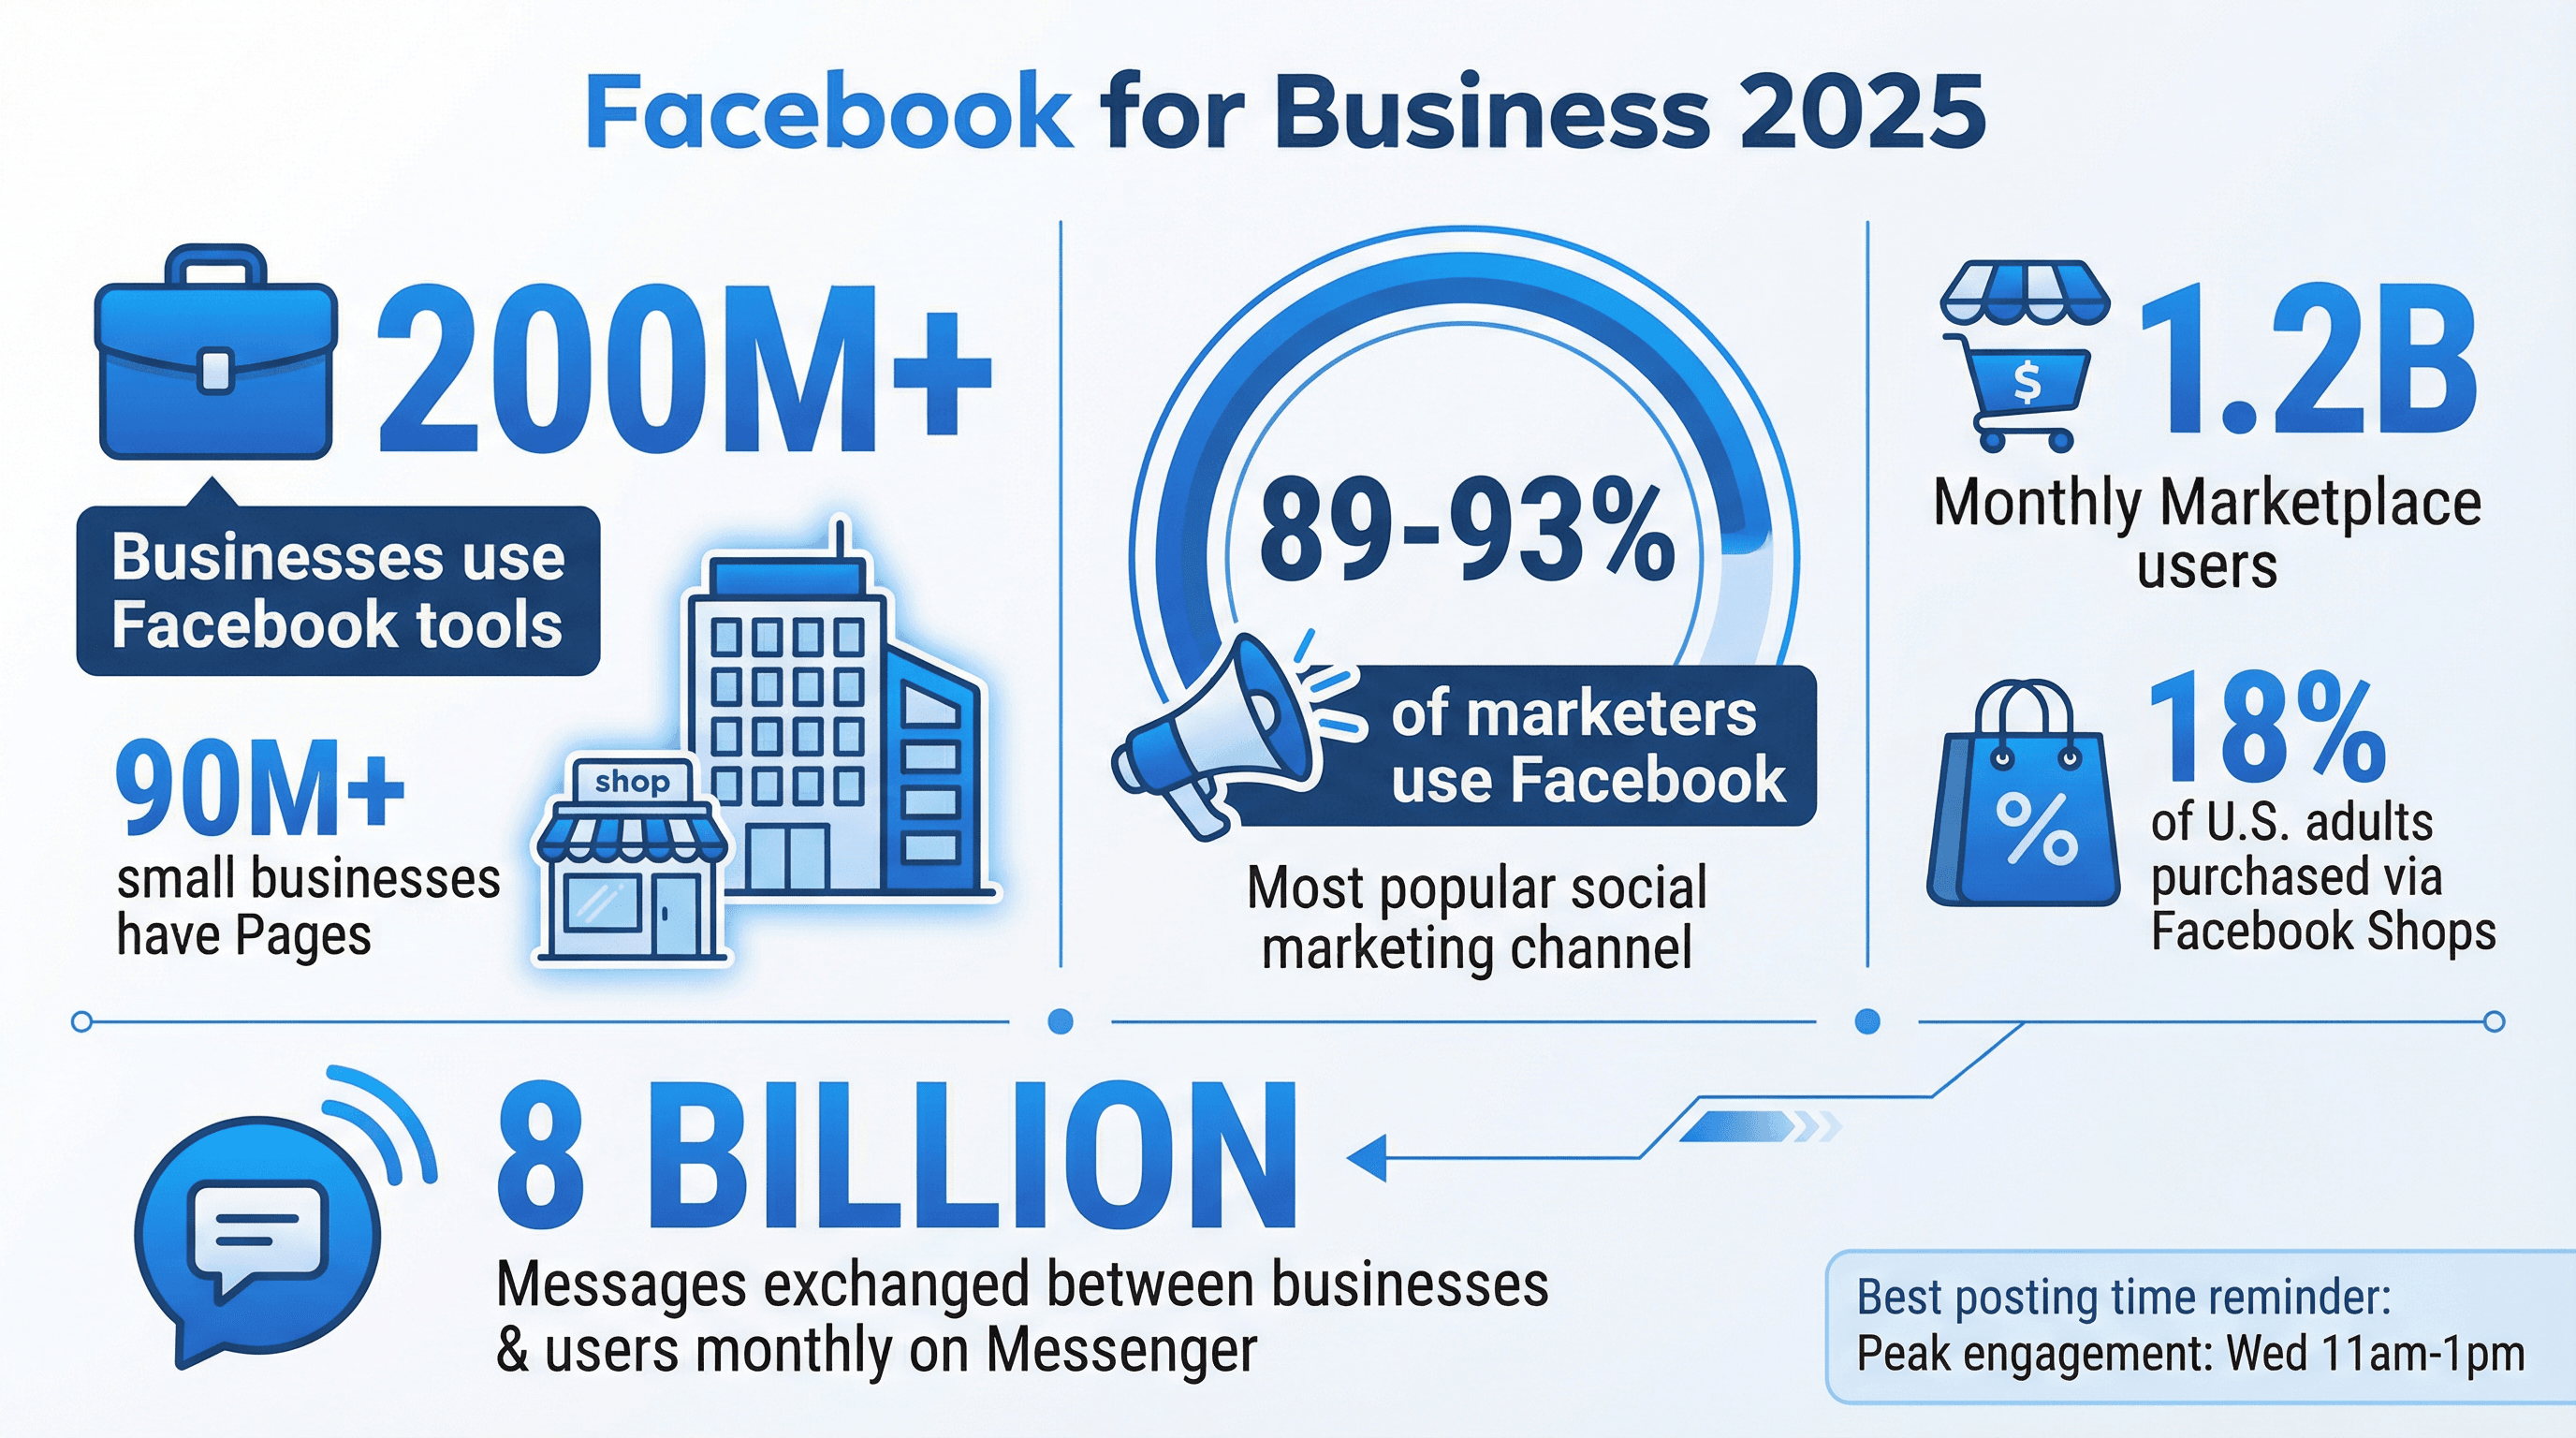
- Over 200 million businesses use Facebook’s free tools (), and 90 million+ small businesses have official Pages ().
- 89–93% of marketers use Facebook for marketing ().
- Marketplace: 1.2 billion monthly users ().
- Facebook Shops: 18% of U.S. adults made a purchase through Shops in 2020 (), and that number is rising.
Customer Service: Over 8 billion messages are exchanged between businesses and users on Messenger each month ().
Best Times to Post: Mid-week, late morning to early afternoon—Wednesdays at 11am–1pm are prime time ().
Facebook Advertising: Reach, Revenue, and ROI
Facebook’s ad platform is a juggernaut:
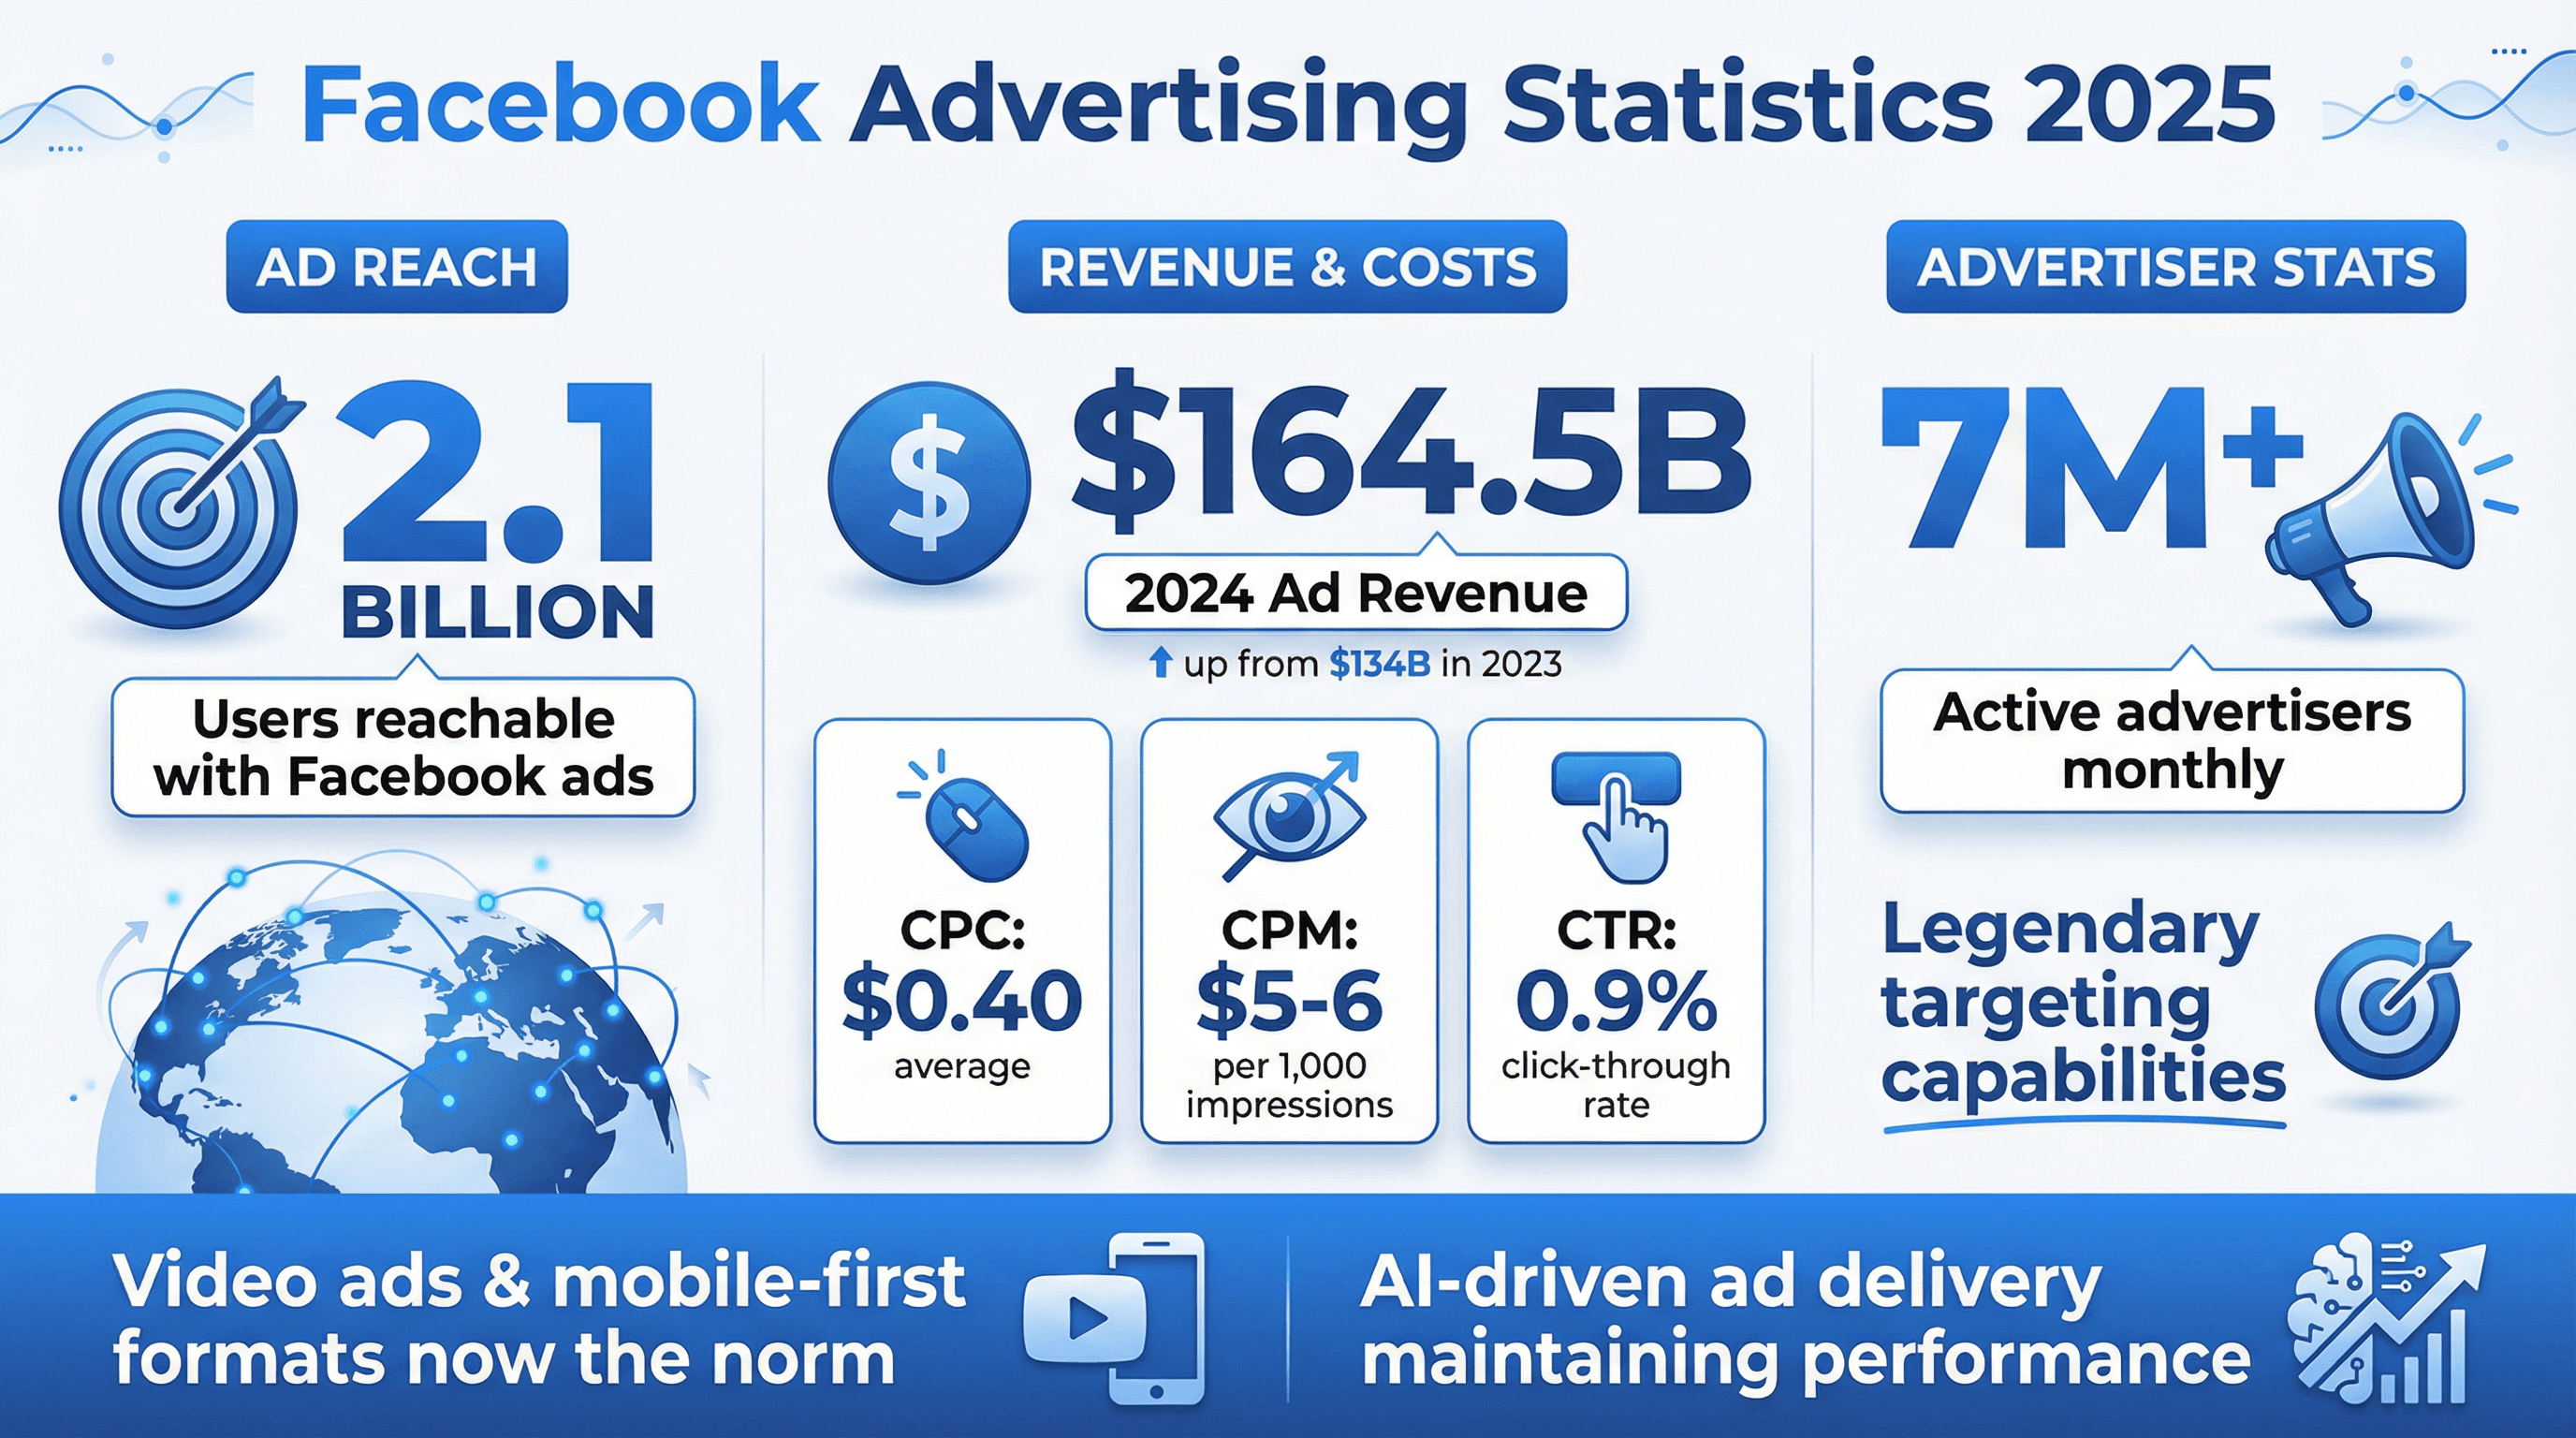
- Ad Audience: Over 2.1 billion users can be reached with Facebook ads ().
- Ad Revenue: $164.5 billion in 2024 (), up from $134 billion in 2023.
- Cost Per Click (CPC): Average of $0.40 (), but varies by industry.
- Cost Per Mille (CPM): About $5–6 per 1,000 impressions ().
- Click-Through Rate (CTR): Around 0.9% ().
7+ million advertisers are active on Facebook each month (), and the platform’s targeting capabilities are legendary. You can slice and dice audiences by demographics, interests, behaviors, and more.
Video ads and mobile-first formats are now the norm, and Facebook’s AI-driven ad delivery is helping marketers maintain performance even as privacy regulations evolve.
Facebook Analytics: What Marketers Need to Track in 2026
If you’re not measuring, you’re guessing. Here’s what matters most in Facebook analytics:
- Reach & Impressions: How many unique users saw your content? How many total views?
- Engagement Rate: Likes, comments, shares, clicks—engagement rate is the key indicator of content resonance ().
- Audience Demographics: Age, gender, location—make sure you’re reaching your target.
- Referral Traffic & Conversions: Link clicks, landing page views, and conversion events (purchases, sign-ups).
- Ad Performance: CPM, CPC, CTR, Cost per Action, ROAS, and Facebook’s own Quality/Engagement/Conversion Rate Rankings ().
- Video Analytics: 3-second views, 10-second views, average watch time, retention graphs.
- Stories & Reels Metrics: Opens, skips, exits, plays, likes, shares.
Meta Business Suite is now the go-to dashboard for all analytics, combining Facebook and Instagram insights (). The key? Focus on actionable insights, not vanity metrics.
Facebook Data Requests and Policy Enforcement: Safety and Transparency Stats
With great scale comes great responsibility (and a lot of spam to clean up):
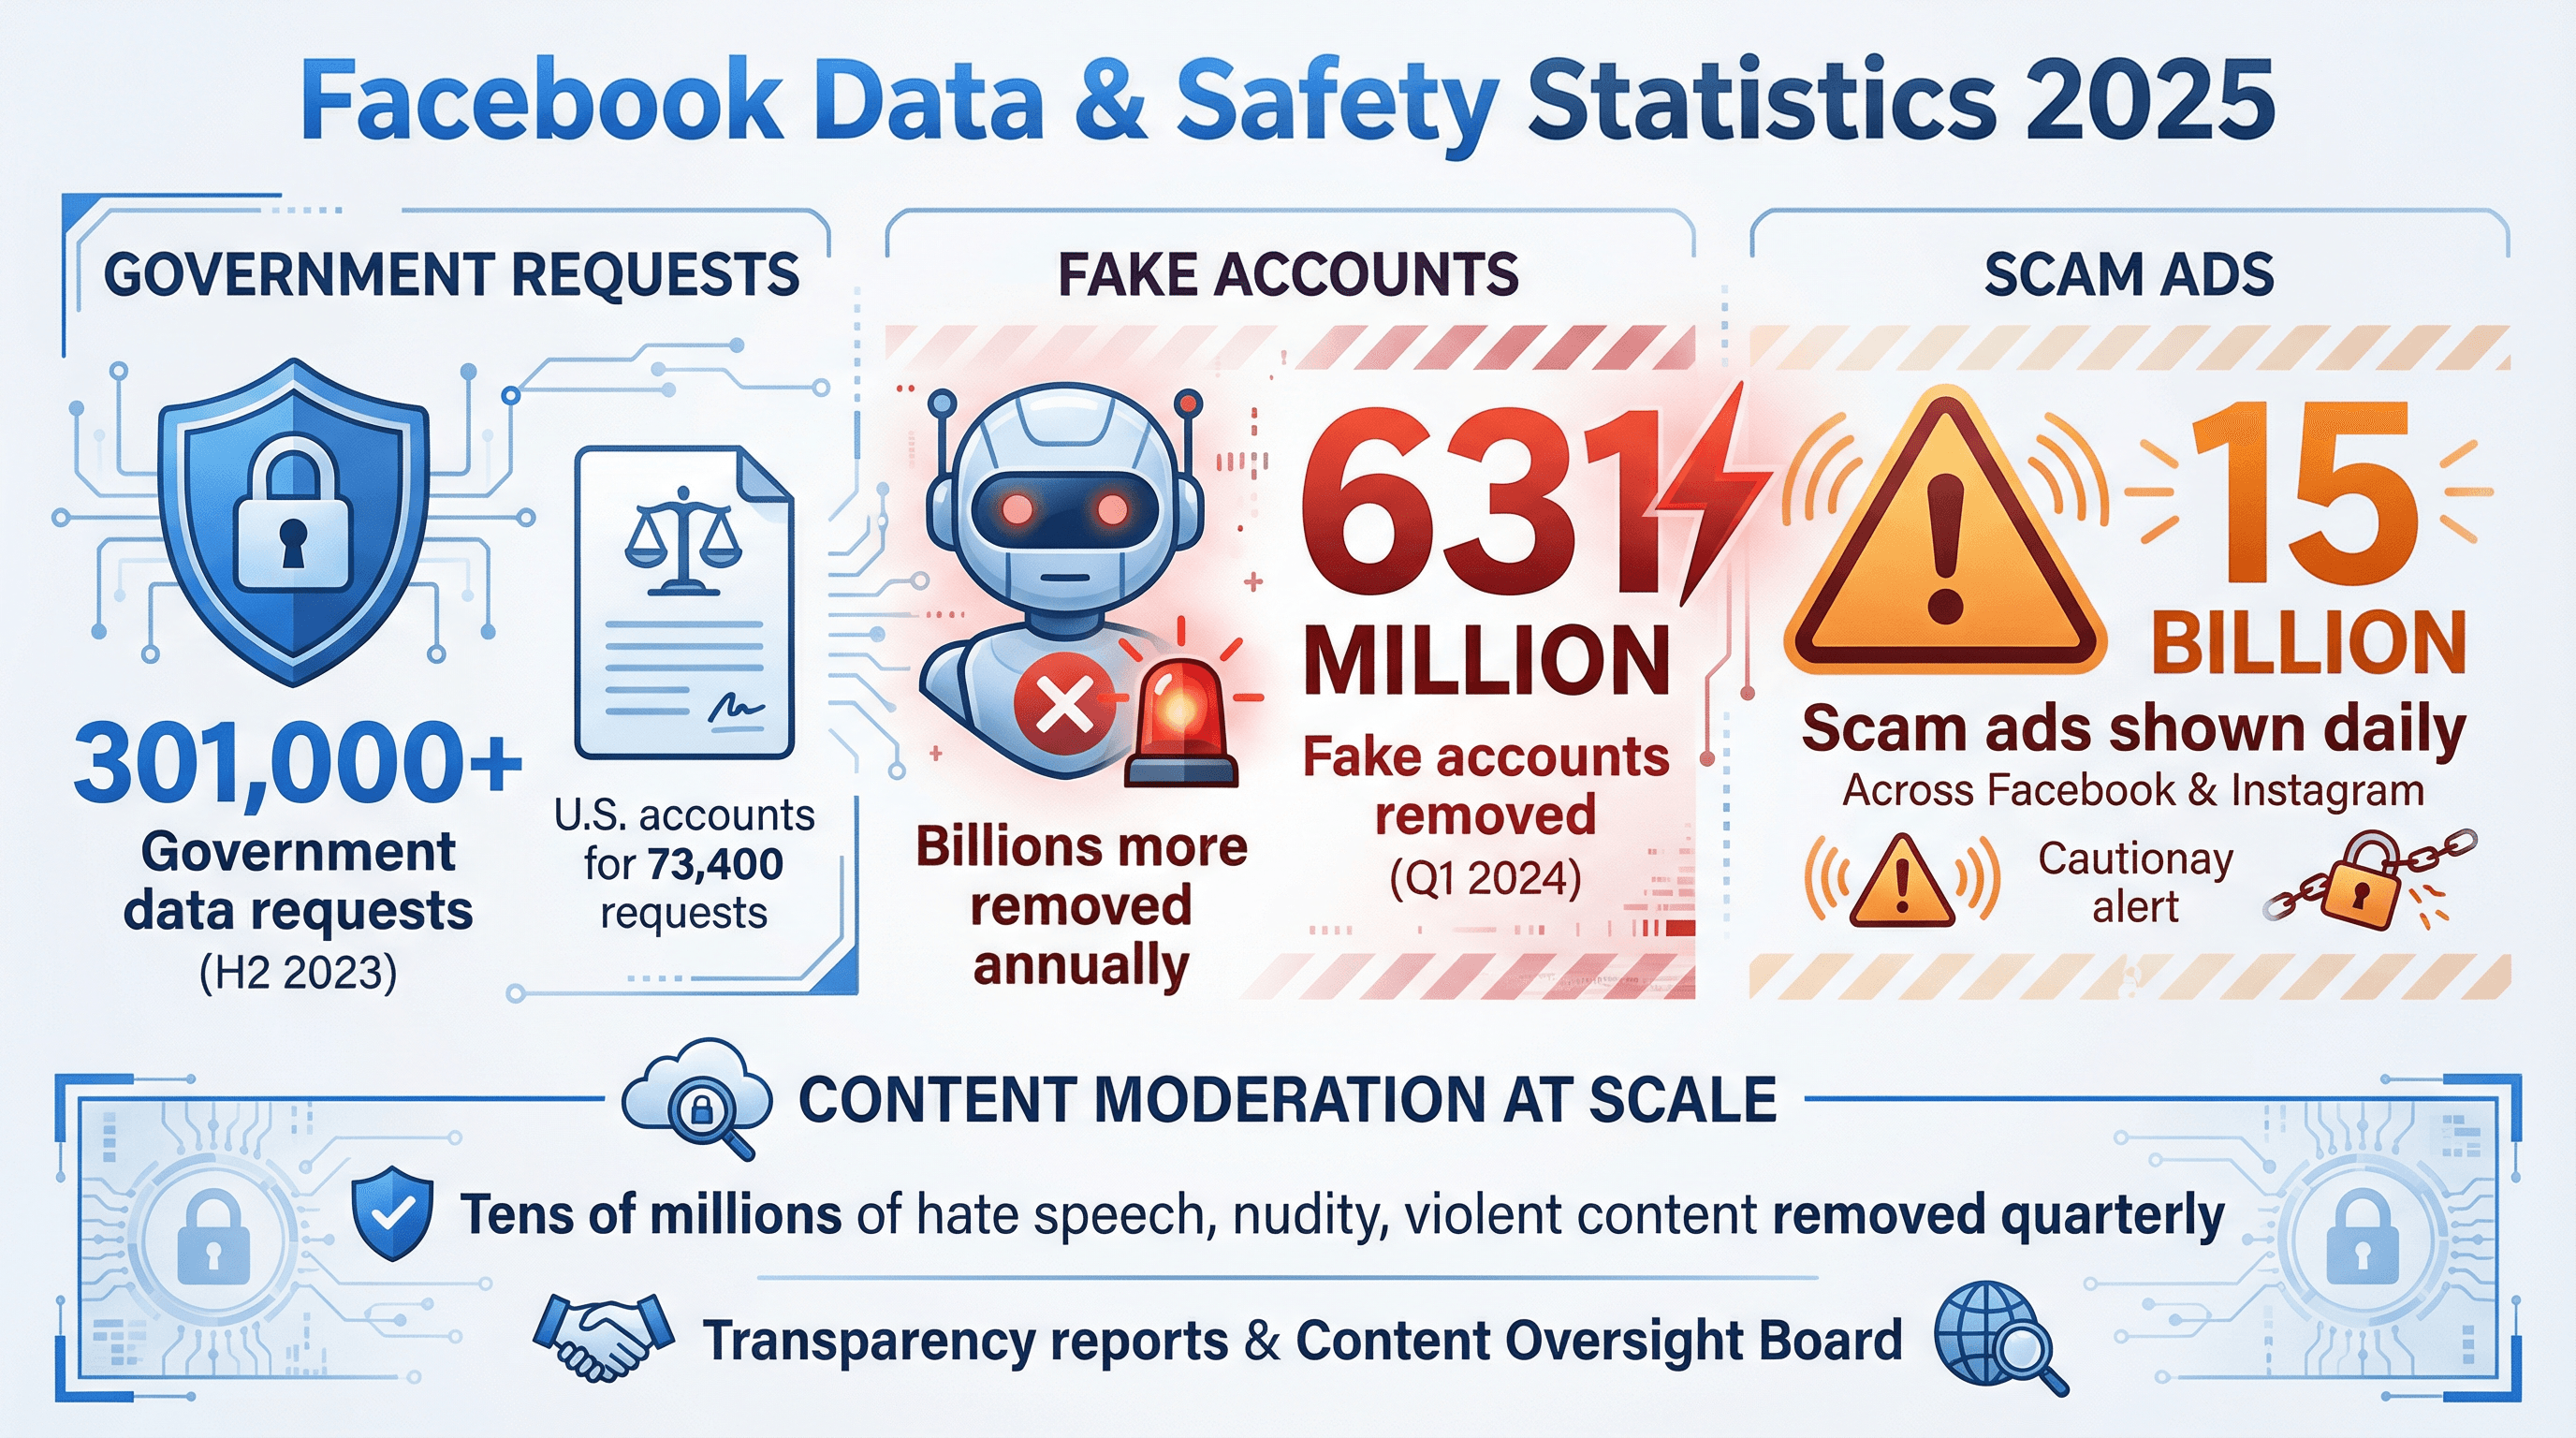
- Government Data Requests: Over 301,000 requests in H2 2023 (), with the U.S. accounting for 73,400.
- Fake Accounts: 631 million fake accounts removed in Q1 2024 (), and billions more each year.
- Content Moderation: Tens of millions of pieces of hate speech, nudity, and violent content removed each quarter.
- Spam & Scam Ads: An estimated 15 billion scam ads shown per day across Facebook and Instagram ().
Facebook’s transparency reports and the Content Oversight Board are steps toward rebuilding trust, but the scale of moderation is staggering.
Facebook and E-Commerce: Social Shopping on the Rise
Facebook is now a shopping destination as much as a social network:
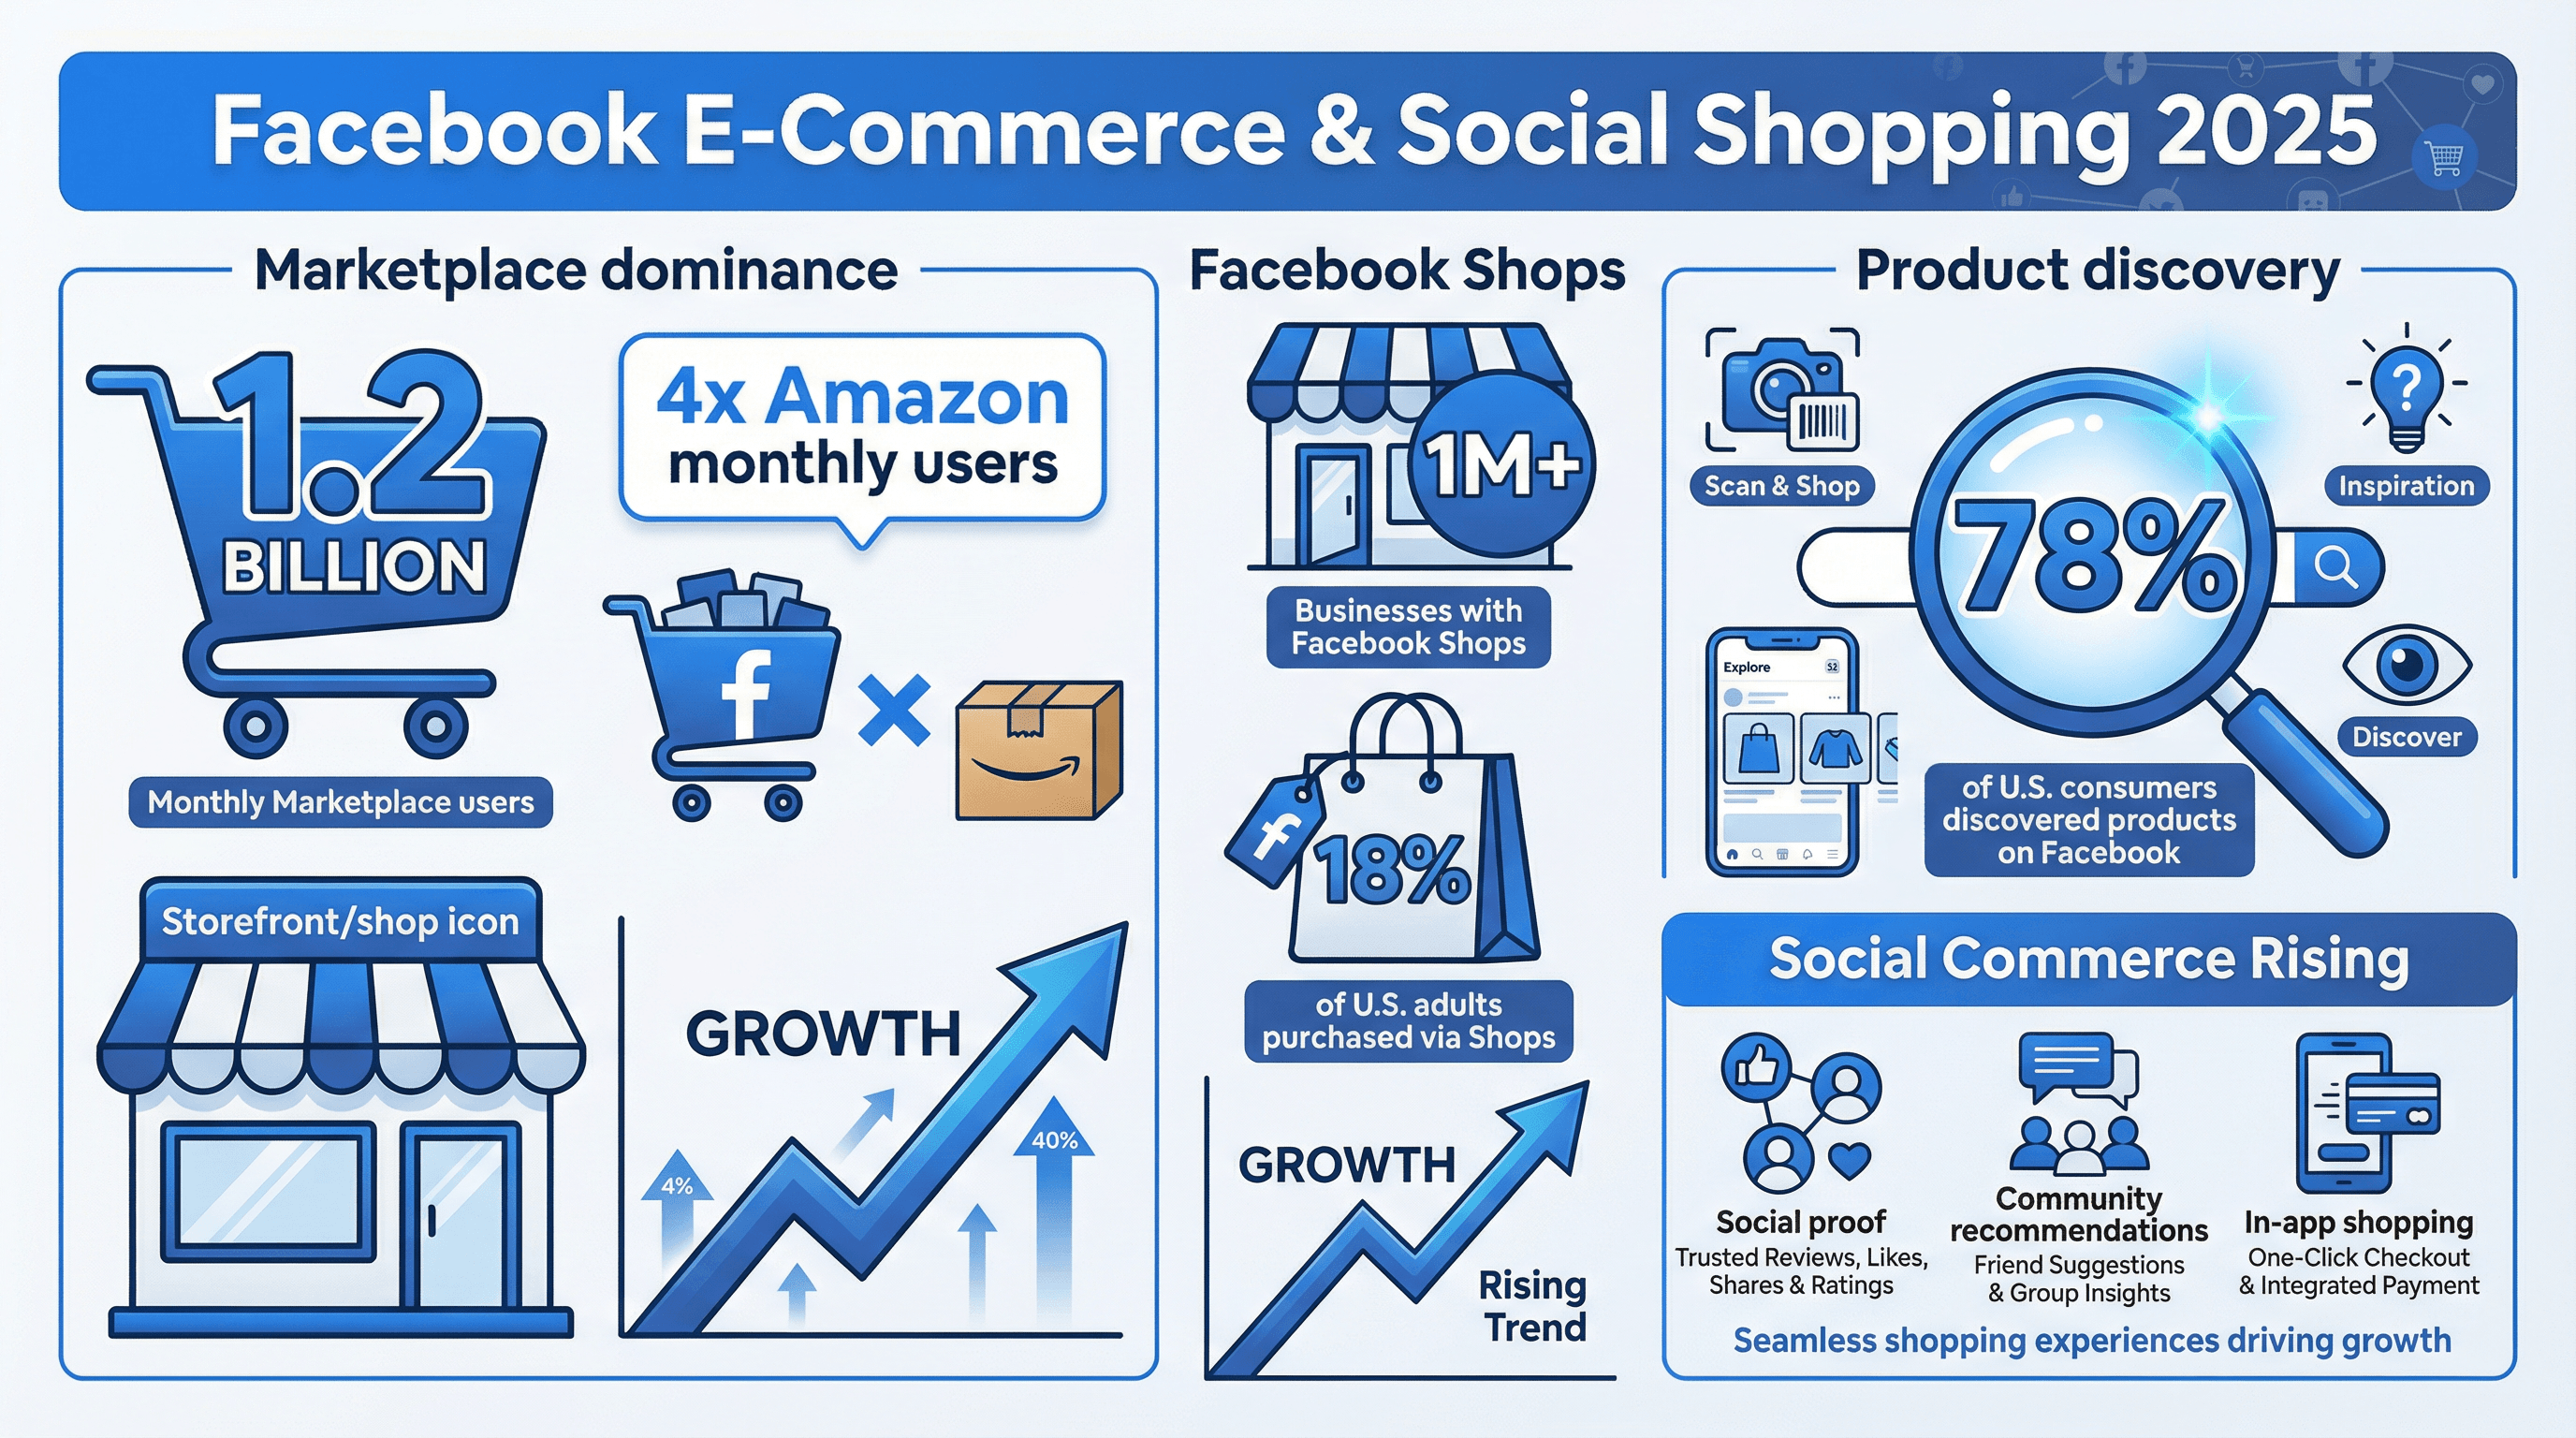
- Marketplace: 1.2 billion monthly users—that’s four times Amazon’s monthly user base ().
- Facebook Shops: Over 1 million businesses have set up Shops, and 18% of U.S. adults have made a purchase via Shops ().
- Product Discovery: 78% of U.S. consumers have discovered products on Facebook ().
Social proof, community recommendations, and seamless in-app shopping experiences are fueling the rise of social commerce on Facebook.
Facebook User Sentiment: Trust, Privacy, and Public Perception
Here’s the plot twist: while Facebook’s usage is sky-high, trust is at rock bottom.
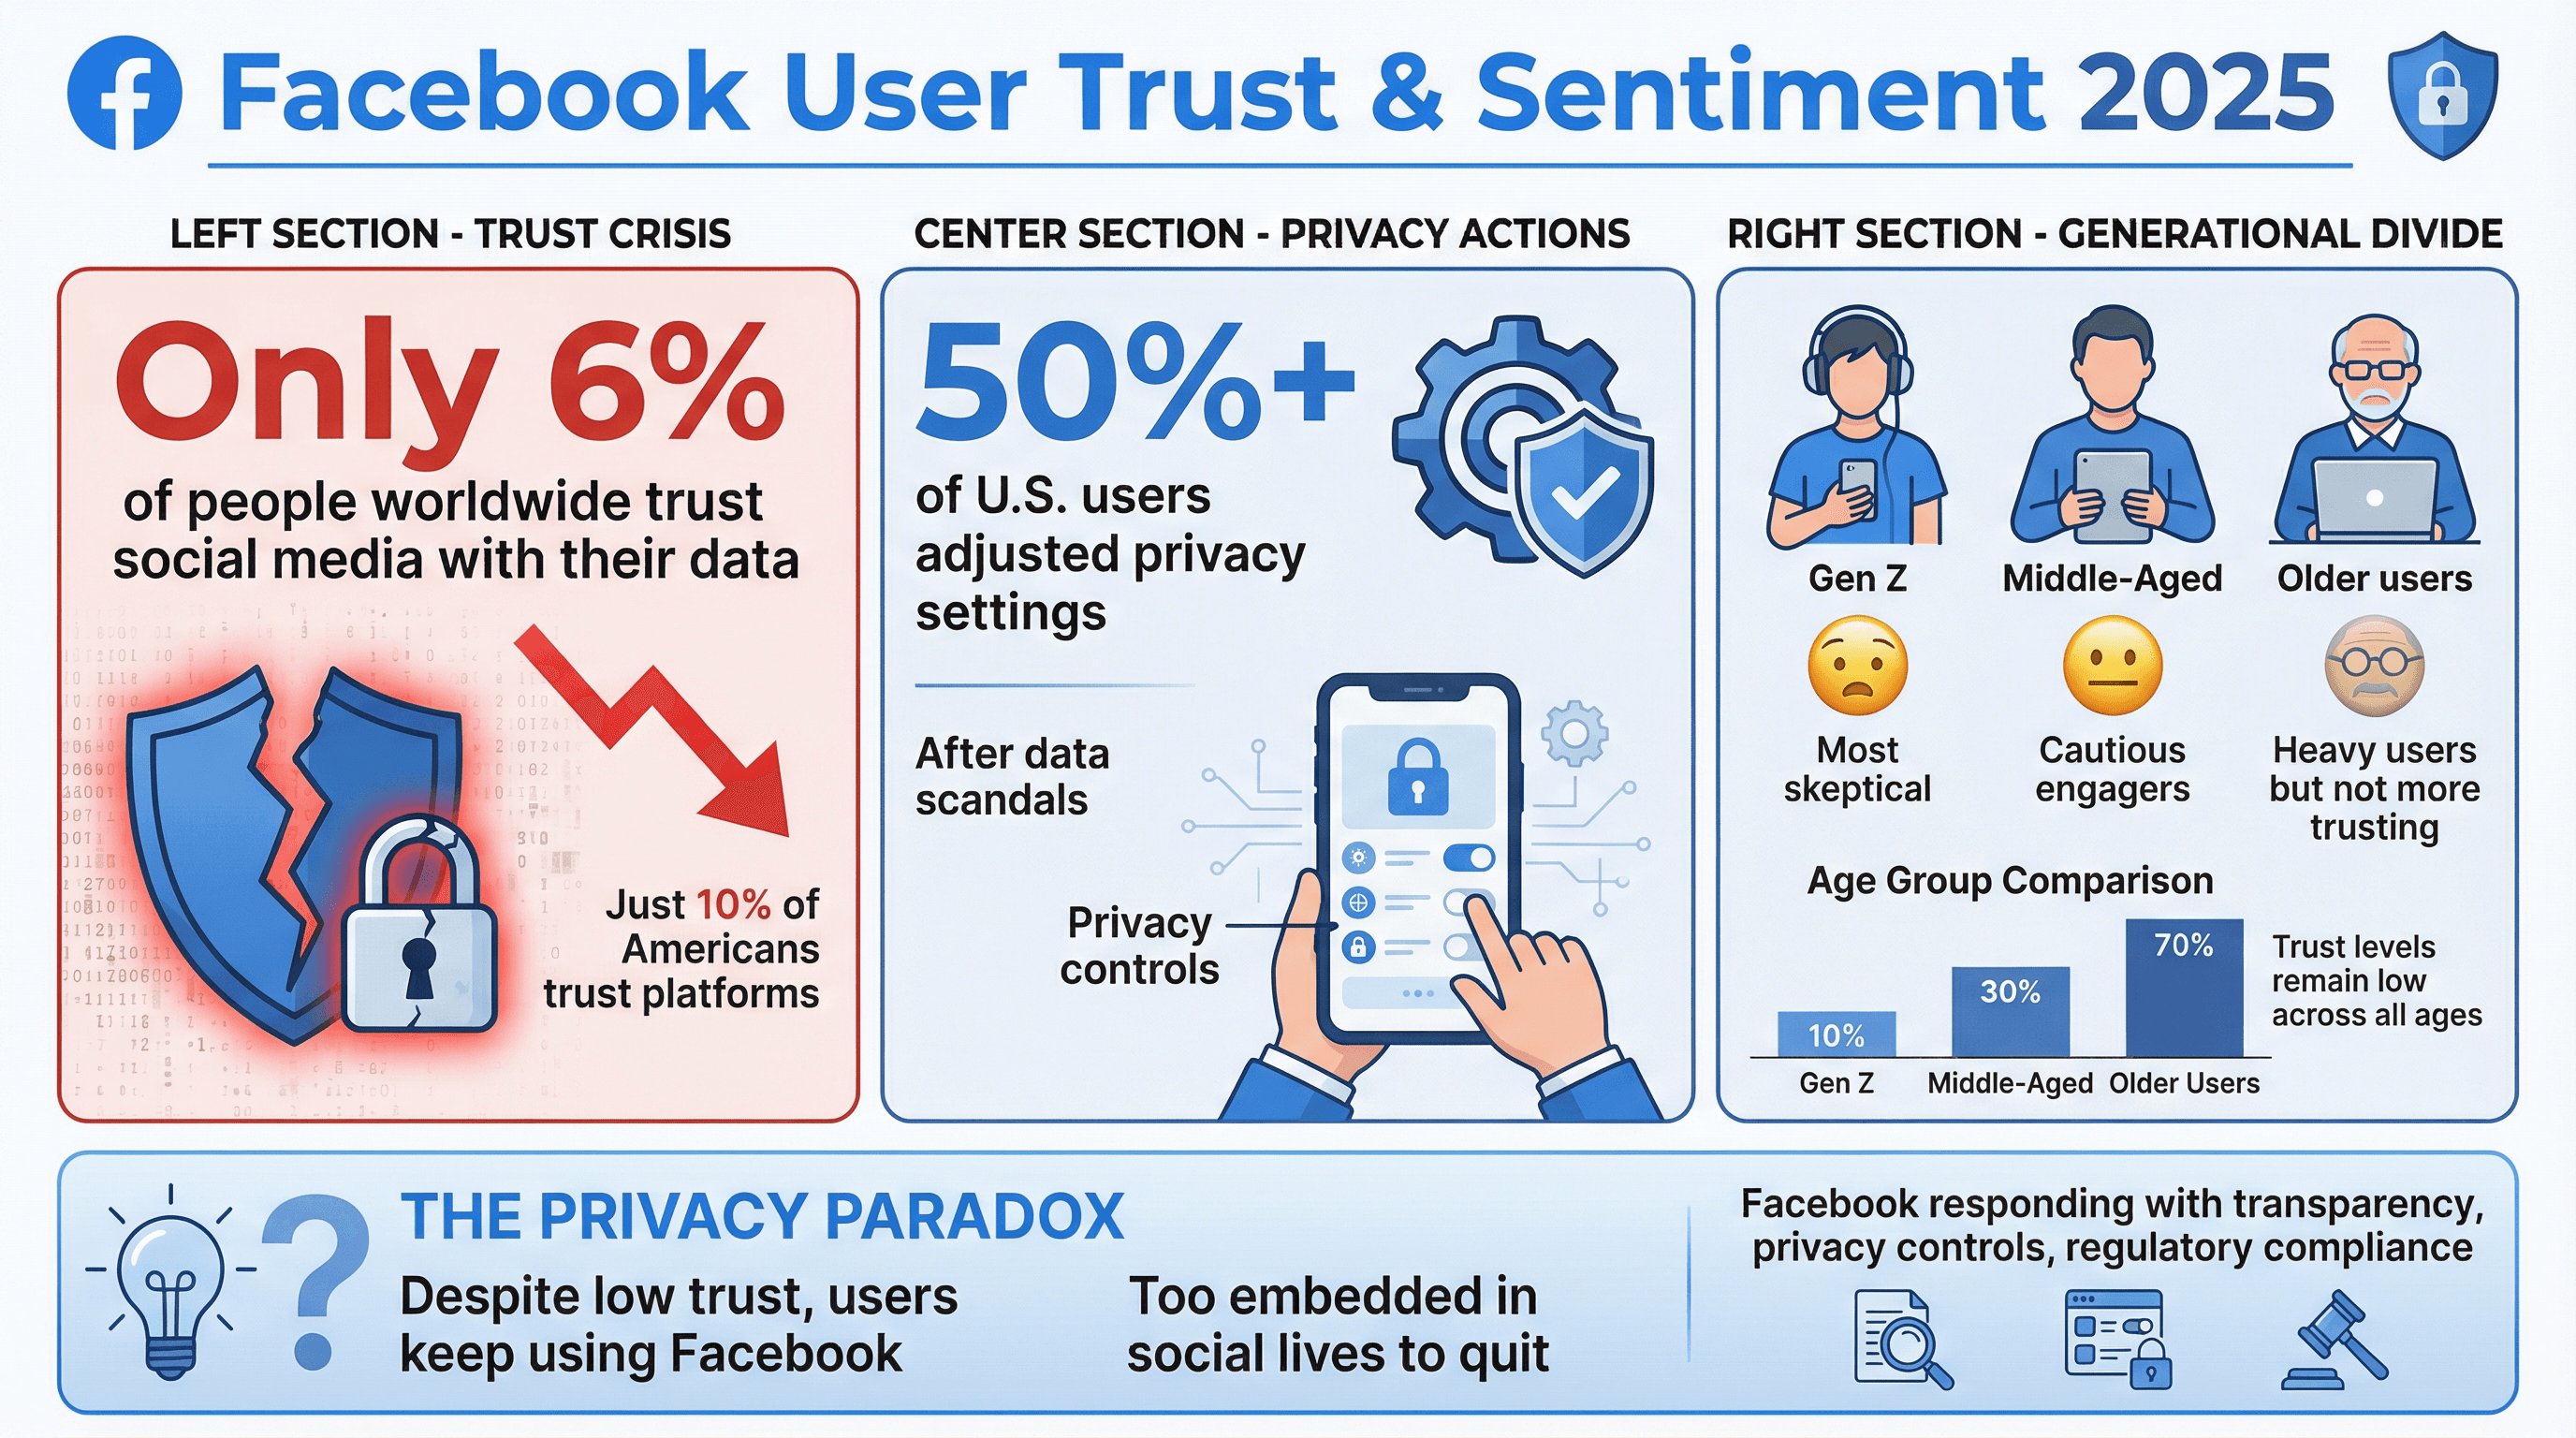
- Only 6% of people worldwide trust social media platforms with their data (), and just 10% of Americans do.
- Over 50% of U.S. users have adjusted privacy settings after scandals.
- Generational Divide: Gen Z is especially skeptical, while older users are heavy users but not necessarily more trusting.
Despite low trust, Facebook’s “privacy paradox” means people keep using it—often because it’s too embedded in their social lives to quit. Facebook is responding with more transparency, privacy controls, and regulatory compliance, but sentiment remains a challenge.
Key Takeaways: What These Facebook Statistics Mean for Marketers
So, what does all this mean for your Facebook strategy in 2025 and beyond?
- Facebook is still the king of reach—with 3+ billion MAUs, you can find any audience here ().
- Growth is in emerging markets; engagement is the name of the game in mature ones ().
- Mobile-first, video-first content wins—optimize for mobile, invest in video, and encourage conversation ().
- Post during peak times (mid-week, late morning/early afternoon) and focus on content that sparks shares and comments ().
- Leverage Facebook’s business tools—Pages, Shops, Marketplace, Messenger—for a full-funnel approach ().
- Track what matters: Reach, engagement, conversions, and ad performance. Use Meta Business Suite for insights ().
- Be transparent and compliant—user trust is low, so handle data and content responsibly ().
- Stay agile: Facebook is always evolving—keep up with new features, algorithm changes, and user trends.
And if you’re in e-commerce, don’t sleep on Marketplace or Shops. The numbers show Facebook is a powerhouse for social shopping and product discovery.
Sources and Further Reading
For those who want to dig deeper, here are some of the best sources for up-to-date Facebook statistics and analysis: