
Amazon’s marketplace is a beast—one that keeps getting bigger, faster, and, frankly, a little more intimidating every year. In 2025, Amazon’s net sales soared to , and more than 60% of those sales came from independent sellers. That’s a lot of competition, a lot of opportunity, and—if you’re still relying on basic sales reports—a lot of missed signals.
I’ve spent years helping brands and sellers move beyond the surface-level metrics like traffic and rank. The real magic? It’s in the Amazon sales data you’re probably overlooking. With the right analytics (and a little automation), you can spot trends before they go mainstream, optimize inventory before you run out (or overstock), and turn raw data into a strategic growth engine. Let’s dig into how to actually do it—no data science PhD, no endless CSV downloads, and no more flying blind.
Why Amazon Sales Data Is Your Growth Engine (Not Just a Scorecard)
If you’re like most Amazon sellers, your first stop in the morning is Seller Central’s dashboard: yesterday’s sales, today’s traffic, maybe a quick look at your rankings. But here’s the thing—those numbers are just the tip of the iceberg. Amazon sales data, when used right, is a multidimensional map of your business: it shows not just what happened, but why, and what’s likely to happen next.
Traditional monitoring is like checking your car’s speedometer; you know how fast you’re going, but not whether you’re about to run out of gas, hit a pothole, or take a wrong turn. True Amazon sales analytics is more like having a GPS with live traffic, weather, and alternate route suggestions.
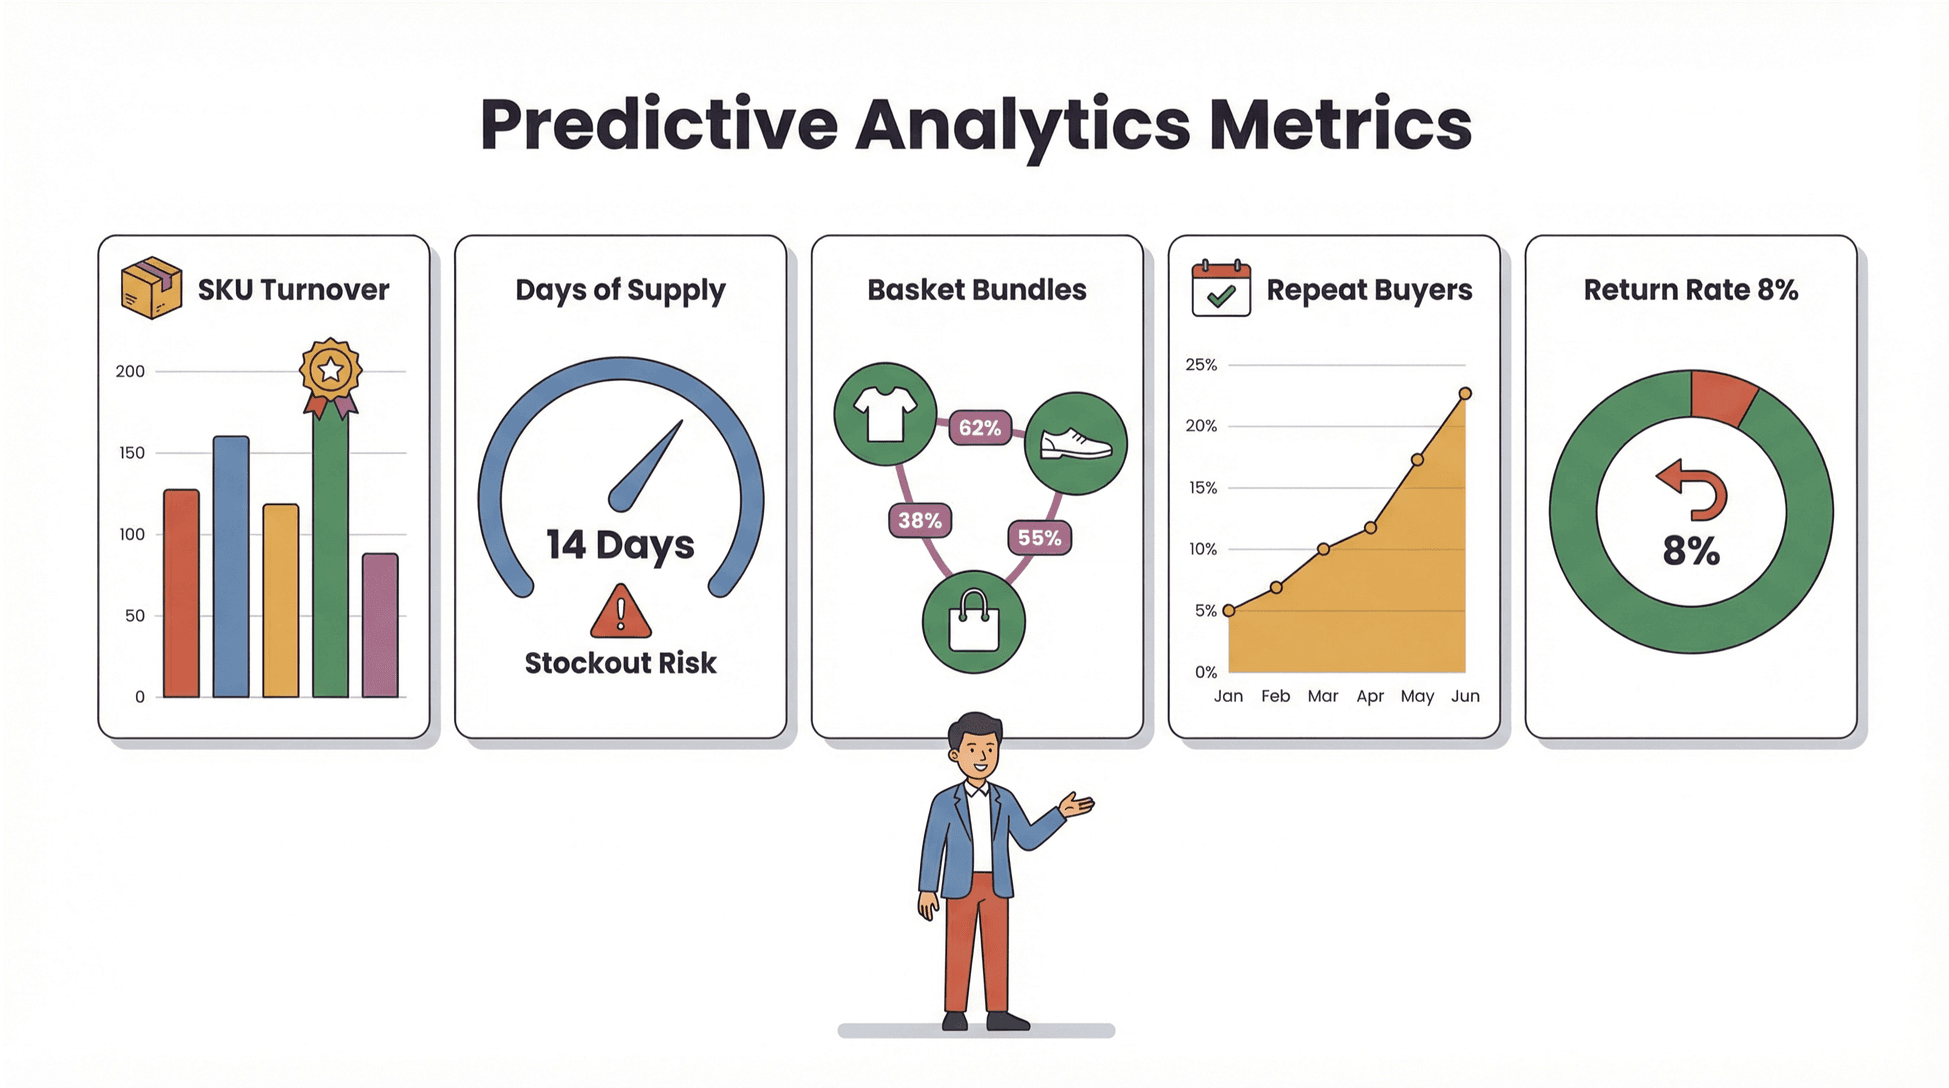
Let’s break down some of the key Amazon sales data points and what they actually mean for your business:
| Metric | What It Tells You | Business Impact |
|---|---|---|
| Sales Velocity | How fast each SKU is selling | Forecast demand, plan restocks, spot winners |
| Inventory Turnover | How quickly inventory is sold & replaced | Optimize cash flow, avoid overstock/stockouts |
| Repeat Purchase Rate | % of customers who buy again | Measure loyalty, identify retention levers |
| Days of Supply | How long current stock will last | Predict stockouts, plan reorder timing |
| Return Rate | % of units returned | Spot quality issues, reduce future returns |
| Market Basket Analysis | What products are bought together | Bundle opportunities, cross-sell strategies |
| Search Impressions | How often your products are seen | Early demand signals, keyword optimization |
The difference between brands that grow and those that stall? The winners are the ones who move from single-metric snapshots to holistic, predictive analytics. They don’t just react—they anticipate.
Unlocking Customer Intent and Market Trends with Amazon Sales Analytics
Here’s where things get interesting. Amazon sales analytics isn’t just about counting orders—it’s about understanding why customers buy, when they buy, and what might make them buy more.
For example, Amazon’s let you see repeat purchase behavior and market basket trends. Maybe you notice that customers who buy your protein powder often buy a certain shaker bottle at the same time. That’s a cross-sell opportunity waiting to happen.
Or maybe your sales spike every October, but only for certain SKUs. With the right analytics, you can spot these seasonal patterns, plan inventory, and even launch targeted promotions before your competitors catch on.
Visualization tip: I love using heatmaps to spot seasonality—rows for SKUs, columns for weeks or months, and color intensity for sales volume. It’s like watching your business “breathe” over time.
Analytics can also help you identify underperforming SKUs. Maybe one product is getting tons of impressions but few conversions. That’s a signal to revisit your listing, pricing, or images.
Real-world example: I’ve seen brands double down on SKUs with high repeat purchase rates, investing in retention campaigns and subscribe-and-save offers. The result? More stable revenue and higher customer lifetime value.
Automating Amazon Sales Reports: Integrate API for Real-Time Insights
Let’s be honest: manual reporting is a productivity killer. Amazon’s own admits that some order reports are only available for 30 days, and generating a full-year report can take hours. If you’re downloading CSVs, merging spreadsheets, and trying to keep up with daily changes, you’re fighting an uphill battle.
That’s where automation comes in. By integrating Amazon’s , you can pull real-time sales data directly into your analytics tools—no more manual downloads, no more stale data.
Here’s how the workflow looks with :
- Connect to Amazon’s API: Thunderbit guides you through the SP-API onboarding (OAuth, permissions, etc.), so you can securely access your sales, orders, and inventory data.
- Automate Data Collection: Set up scheduled pulls—hourly, daily, weekly—so your dashboards are always up to date.
- Analyze in Real Time: Thunderbit pipes the data straight into your preferred tools (Excel, Google Sheets, BI dashboards), so you can spot trends and act fast.
Manual vs. Automated Reporting:
| Workflow | Time Spent | Data Freshness | Risk of Error | Actionability |
|---|---|---|---|---|
| Manual Download | High | Low | High | Delayed |
| API Automation | Low | High | Low | Instant |
Automating your Amazon sales report process isn’t just about saving time—it’s about making sure you never miss a critical signal.
Moving to Granular Data: Predicting Success with Advanced Metrics
If you want to move from “what happened” to “what’s next,” you need to get granular. High-level sales numbers are nice, but the real insights come from SKU-level, customer-level, and even event-level data.
Think about it: If you only look at total sales, you might miss that one SKU is driving all your growth while another is quietly bleeding margin. Or that your return rate is creeping up on a new product line.
Here are some advanced metrics that can supercharge your predictive analytics:
- SKU-Level Inventory Turnover: Which products are moving fastest? Which are at risk of overstock or stockout?
- Customer Return Rate: Are certain products or time periods seeing more returns? Is it a quality issue or a mismatch in expectations?
- Purchase Frequency: How often do your best customers buy? Can you nudge them to buy more often?
- Days of Supply by SKU: How many days until you run out of each product? Are you at risk of missing a sales spike?
- Market Basket Analysis: What products are commonly bought together? Can you bundle or cross-promote?
With Thunderbit, you can extract this level of detail—no coding required. The AI-powered extraction engine can pull granular data from Amazon reports, dashboards, and even subpages, then structure it for analysis.
Predictive analytics in action: By modeling sales velocity and days of supply, you can forecast when to reorder, how much to buy, and where to allocate marketing spend. It’s like having a crystal ball for your Amazon business (minus the fog and questionable fortune-telling).
Thunderbit: The Fastest Path to Deep Amazon Sales Analytics (No Coding Needed)
Let’s talk about the elephant in the room: most sellers don’t have a data team or the time to learn Python just to make sense of their Amazon sales data. That’s exactly why we built .
Thunderbit is an that lets you extract, structure, and analyze Amazon sales data in just a few clicks. No code, no templates, no headaches.
Here’s how it works:
- AI Suggest Fields: Thunderbit reads your Amazon dashboard or report page and suggests the most relevant columns to extract—sales, inventory, repeat purchase rate, you name it.
- Subpage Scraping: Need more detail? Thunderbit can automatically visit each SKU or order subpage and enrich your dataset with granular info.
- Export Anywhere: Once you’ve got your data, export it directly to Excel, Google Sheets, Airtable, or Notion. No more copy-paste marathons.
- Scheduled Scraping: Set up recurring data pulls so your reports are always fresh—perfect for weekly business reviews or daily inventory checks.
- Cloud vs. Browser Scraping: For public pages, use Thunderbit’s cloud mode for speed (up to 50 pages at once). For logged-in Seller Central data, use browser mode for security and access.
Thunderbit is trusted by over , and it’s updated regularly to keep pace with Amazon’s ever-changing interface.
User story: One seller told me they used to spend hours every week downloading and merging reports. With Thunderbit, they set up a scheduled scrape, exported to Google Sheets, and now get a daily dashboard—no manual work required.
Turning Amazon Sales Data into Strategic Business Assets
So you’ve got the data—now what? The real value comes from turning raw numbers into actionable strategy.
Here’s how Thunderbit helps you move from data collection to decision-making:
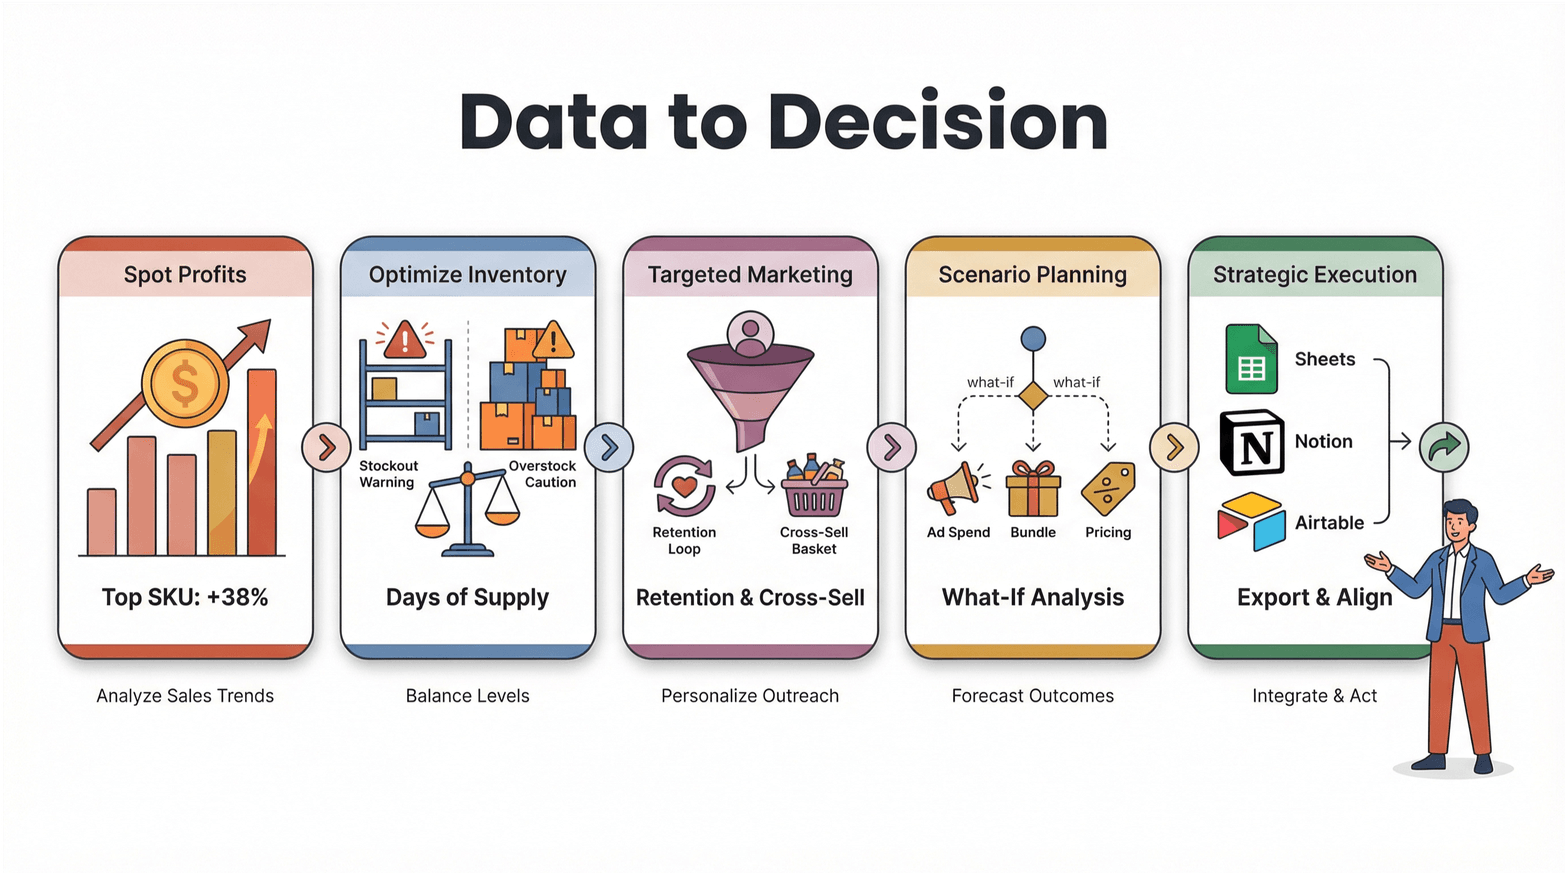
- Spot Profit Opportunities: Use sales velocity and margin data to identify your most profitable SKUs. Double down on winners, trim the dead weight.
- Optimize Inventory: Monitor days of supply and turnover rates to avoid stockouts (lost sales) and overstock (tied-up cash).
- Targeted Marketing: Analyze repeat purchase rates and market basket data to design retention campaigns and cross-sell offers.
- Scenario Planning: With granular data, you can run “what-if” analyses—what happens if you increase ad spend, bundle products, or adjust pricing?
- Strategic Execution: Export your insights to your team’s tools—Sheets, Notion, Airtable—so everyone is on the same page and ready to act.
The bottom line: Amazon sales analytics isn’t just about reporting the past. It’s about building a feedback loop where every data point drives smarter, faster, and more profitable decisions.
Step-by-Step Guide: Mastering Amazon Sales Analytics with Thunderbit
Ready to roll up your sleeves? Here’s a practical walkthrough for using Thunderbit to master Amazon sales analytics—from setup to advanced analysis.
Step 1: Connect Amazon Account and Set Up Thunderbit
- Install Thunderbit: Download the and pin it to your toolbar.
- Log in to Seller Central: Open your Amazon Seller Central or Vendor Central dashboard in Chrome.
- Launch Thunderbit: Click the Thunderbit icon. For logged-in data, use browser mode for secure access.
- Data Security: Thunderbit never stores your credentials—data is processed locally in your browser unless you opt for cloud scraping (for public pages).
Step 2: Extract and Customize Amazon Sales Reports
- AI Suggest Fields: On your target Amazon report or dashboard, click “AI Suggest Fields.” Thunderbit will scan the page and recommend columns (sales, inventory, returns, etc.).
- Customize Columns: Add, remove, or rename columns as needed. You can specify data types (text, number, date, etc.) for cleaner exports.
- Subpage Scraping: For deeper insights, enable subpage scraping to pull data from individual SKU or order pages.
Step 3: Automate Data Collection and Scheduling
- Schedule Scrapes: Set up recurring scrapes—daily, weekly, or custom intervals. Thunderbit uses natural language scheduling (“every Monday at 9am”) for easy setup.
- Cloud vs. Browser: Use cloud mode for public data (fast, up to 50 pages at once). For Seller Central, stick with browser mode for authenticated access.
- Monitor Progress: Thunderbit shows real-time progress and alerts you to any issues (like login timeouts or page changes).
Step 4: Analyze, Visualize, and Act on Insights
- Export Data: Send your structured data directly to Excel, Google Sheets, Airtable, or Notion. You can also download as CSV or JSON.
- Build Dashboards: Use pivot tables, charts, and heatmaps to visualize trends—sales by SKU, seasonality, inventory risk, etc.
- Take Action: Share insights with your team, adjust marketing and inventory strategies, and set up alerts for key metrics (like low stock or rising return rates).
Pro tip: For advanced users, Thunderbit supports custom AI prompts for each field—so you can label, categorize, or even translate data on the fly.
From Data to Predictive Growth: Key Takeaways for Amazon Sellers
Let’s recap the big ideas:
- Amazon sales analytics is your growth engine: Moving beyond traffic and rank unlocks a 360° view of your business—customer intent, inventory health, and market trends.
- Granular data = predictive power: SKU-level, customer-level, and event-level metrics help you forecast demand, optimize inventory, and spot new opportunities.
- Automation is a must: Manual reporting is slow, error-prone, and leaves you flying blind. API integration and tools like Thunderbit keep your data fresh and actionable.
- Thunderbit makes it easy: With AI-powered extraction, subpage scraping, and no-code automation, anyone can master Amazon sales analytics—no technical skills required.
- Turn insights into action: Use your analytics to drive pricing, inventory, and marketing decisions that fuel predictive, data-driven growth.
Brands that treat Amazon sales data as a strategic asset—not just a scorecard—are the ones that win in today’s hyper-competitive marketplace.
Conclusion & Next Steps
Mastering Amazon sales analytics isn’t just for the big brands with data teams and fancy dashboards. With the right tools and mindset, any seller can move from reactive reporting to predictive, strategic growth.
Here’s what I recommend:
- Try Thunderbit’s free trial: and see how easy it is to extract and analyze your Amazon sales data.
- Review your current analytics workflow: Where are you still relying on manual downloads or surface-level metrics?
- Identify a quick win: Maybe it’s automating your weekly sales report, or digging into repeat purchase rates for your top SKUs.
- Explore more resources: Check out the for deep dives on web scraping, analytics, and automation. You may also like: and .
The future of Amazon selling belongs to those who can turn data into action—predicting trends, optimizing operations, and seizing opportunities before the competition. With Thunderbit, that future is within reach.
FAQs
1. What is the difference between Amazon sales data and Amazon sales analytics?
Amazon sales data refers to the raw numbers—orders, revenue, inventory, etc.—while Amazon sales analytics is the process of extracting insights from that data to drive decisions. Analytics helps you move from “what happened” to “why it happened” and “what to do next.”
2. How can I automate Amazon sales report generation?
You can automate Amazon sales report generation by integrating with Amazon’s or using tools like . Thunderbit lets you schedule recurring data pulls, extract granular data, and export it directly to your analysis tools—no manual downloads required.
3. What are some advanced Amazon sales metrics I should track?
Beyond basic sales and traffic, focus on metrics like sales velocity, inventory turnover, repeat purchase rate, days of supply, return rate, and market basket analysis. These metrics help you forecast demand, optimize inventory, and identify growth opportunities.
4. Can I use Thunderbit if I’m not technical?
Absolutely. Thunderbit is designed for business users—no coding required. Just install the Chrome Extension, use AI Suggest Fields to define your report, and export your data in a few clicks. The interface is intuitive, and there’s plenty of documentation and support to help you get started.
5. How do I turn Amazon sales data into actionable business strategies?
Start by extracting granular data (SKU-level, customer-level, etc.), then use analytics to identify trends, bottlenecks, and opportunities. With Thunderbit, you can visualize your data, run scenario analyses, and share insights with your team—turning raw numbers into targeted, profitable actions.
Ready to move beyond basic reports and unlock predictive growth? and start mastering your Amazon sales analytics today. For more tips and tutorials, visit the .
Learn More