
Picture this: You’re scrolling through Instagram while waiting for your coffee, double-tapping a puppy video, voting on a Story poll, and—oops—suddenly you’re shopping for sneakers you didn’t even know you needed. Sound familiar? You’re not alone. Instagram isn’t just a place for #ThrowbackThursdays and avocado toast pics anymore—it’s a global powerhouse shaping everything from pop culture to how we shop, connect, and build brands.
With over and half a billion people logging in every single day (), Instagram’s reach is mind-boggling. But here’s the kicker: understanding Instagram statistics—whether you’re a marketer, creator, or just trying to keep up with your Gen Z cousin—can mean the difference between blending in and standing out. That’s where tools like an or robust Instagram analytics come in. Let’s dive into the numbers that matter most in 2024 and beyond.
Instagram Statistics at a Glance: The Big Numbers
 Let’s kick things off with the headline stats—the ones you’ll want to drop in your next marketing meeting or trivia night:
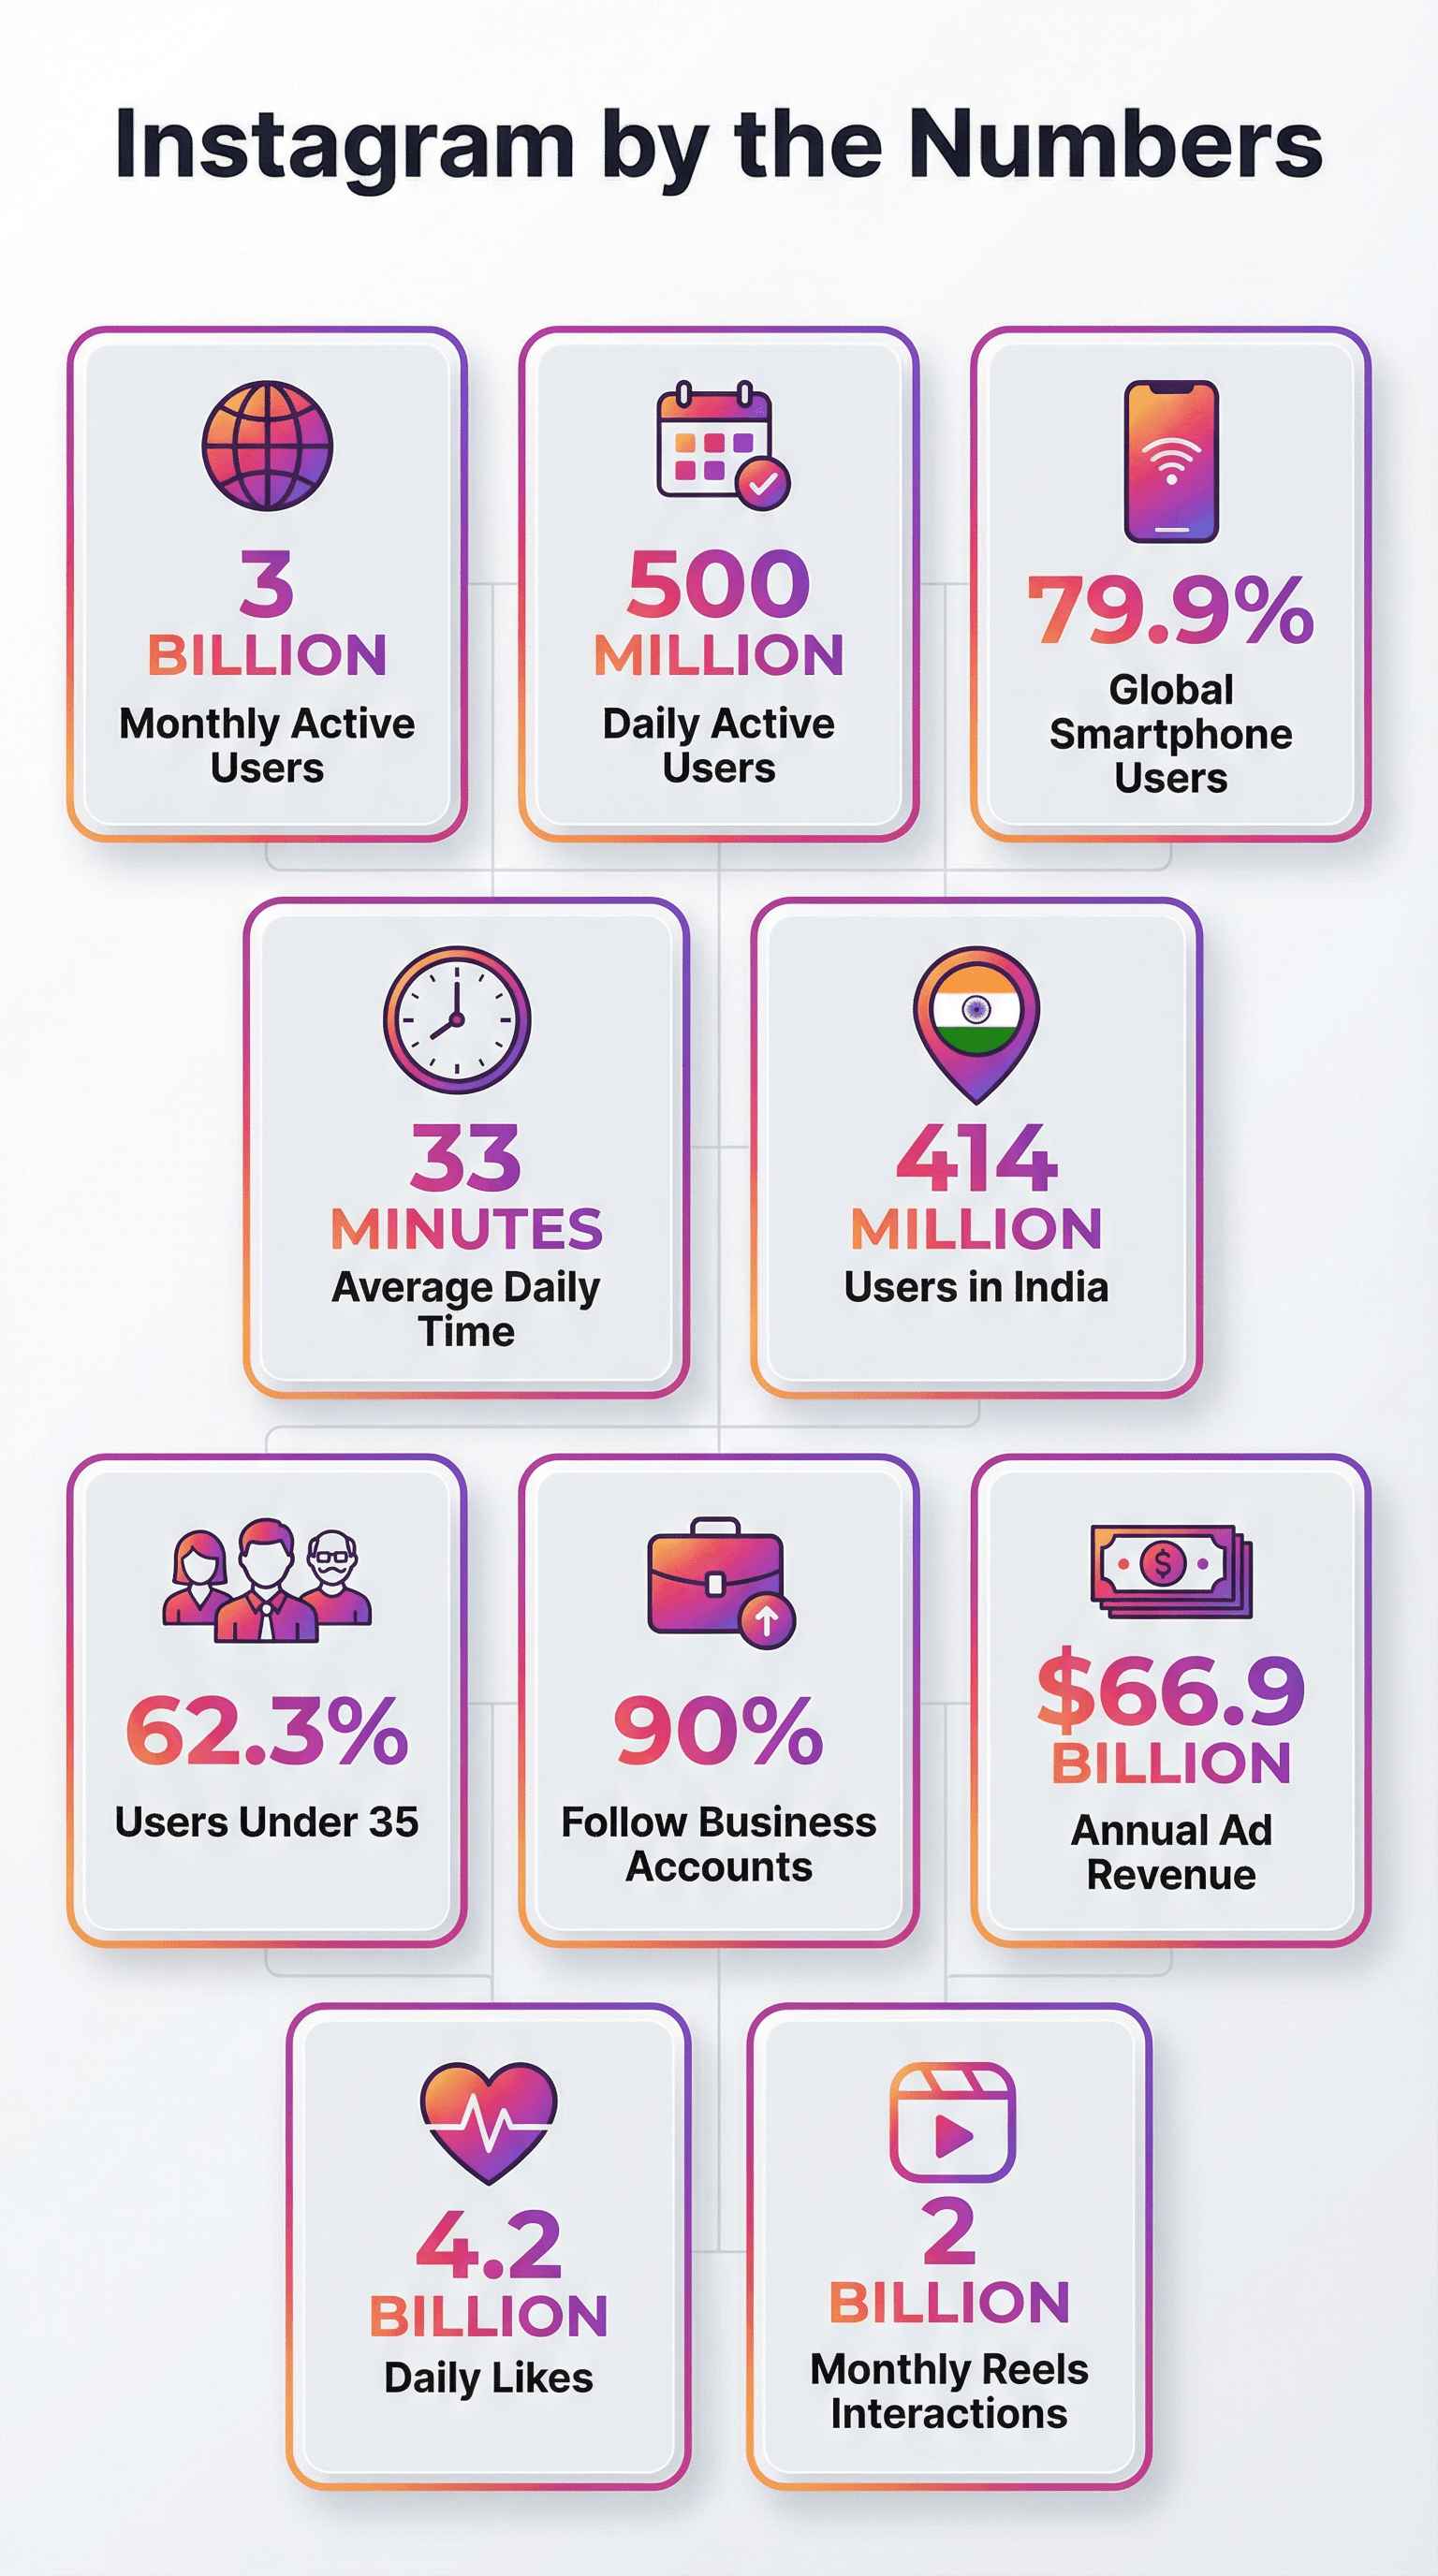
| Statistic | Number / Percentage | Source |
|---|---|---|
| Monthly active users | 3 billion | Daily Sabah |
| Daily active users | 500 million | SocialPilot |
| Share of global smartphone users on Instagram | 79.9% | SocialPilot |
| Average daily time (U.S. adults) | 33 minutes | SocialPilot |
| Instagram users in India | 414 million | SocialPilot |
| Proportion of global users under age 35 | 62.3% | SocialPilot |
| Users who follow at least one business account | 90% | SocialPilot |
| Annual ad revenue (2024) | $66.9 billion | Daily Sabah |
| Daily likes on posts | 4.2 billion | SMPerth |
| Monthly interactions with Reels | 2 billion | SocialPilot |
These numbers aren’t just big—they’re a sign that Instagram is where digital life happens. Now, let’s break down who’s actually behind all those likes, Stories, and shopping sprees.
Instagram Demographics: Who’s Using Instagram?
 Instagram’s user base is a global, youthful, and diverse crowd. If you’re wondering who’s actually scrolling, posting, and shopping, here’s the lowdown.
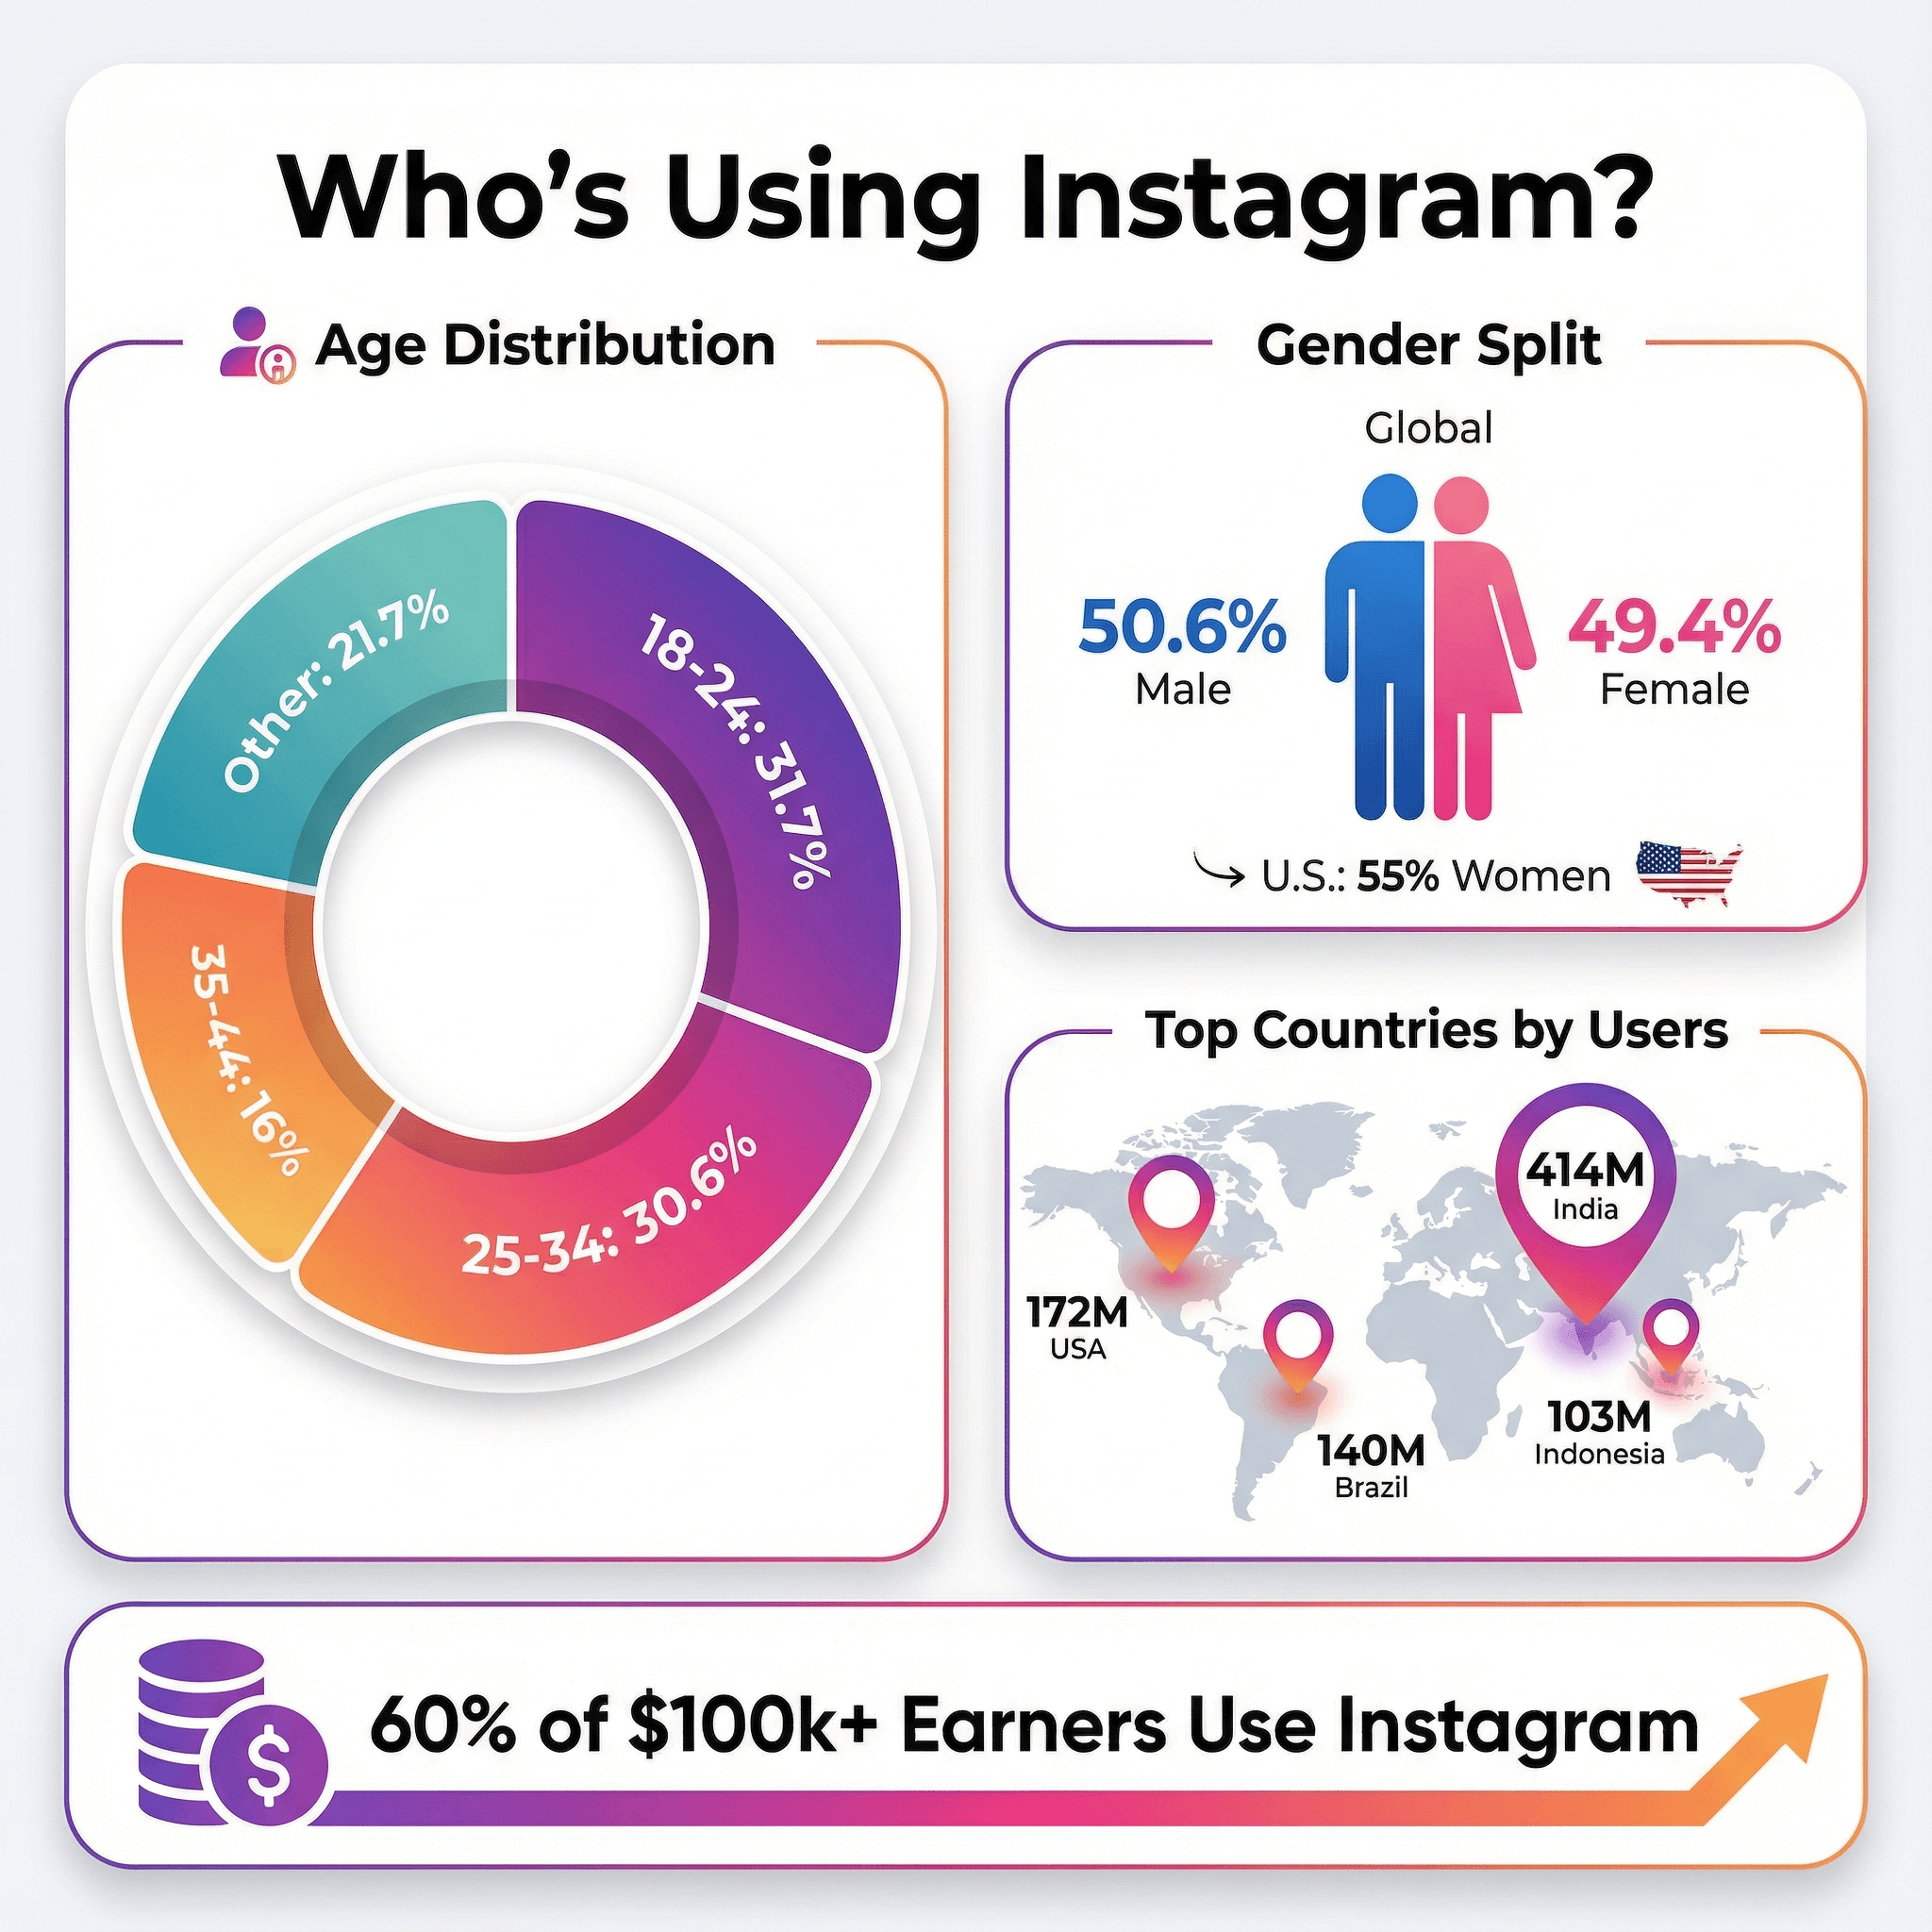
- 62.3% of Instagram users are between 18 and 34 (). That’s Gen Z and Millennials dominating the feed.
- The largest age groups globally:
- 18–24: 31.7%
- 25–34: 30.6%
- Only about 16% of users are 35–44, and it drops off quickly after that. Sorry, Boomers—Instagram is still the playground of the young and the restless.
- Gender split: Globally, it’s almost even—50.6% male, 49.4% female (). In the U.S., it skews a bit more female (about 55% women).
- Income & education: Instagram is popular across income brackets, but usage increases with income—60% of U.S. adults earning $100k+ use Instagram ().
Why does this matter? If you’re targeting Gen Z, Millennials, or affluent shoppers, Instagram is your stage. And with a nearly even gender split, you can reach just about anyone—just don’t expect your grandma to be your biggest fan (unless she’s really cool).
Top Countries and Regional Reach
| Country | Instagram Users (Millions) |
|---|---|
| India | 414 |
| United States | 172 |
| Brazil | 140 |
| Indonesia | 103 |
| Turkey | 58 |
| Japan | 57 |
| Mexico | 49 |
| UK | 33 |
| Germany | 31 |
Over 90% of Instagram users are outside the U.S., making it a truly global platform (). Fun fact: Kazakhstan has one of the highest Instagram penetration rates relative to its population—over 80% (). If you’re a brand with international ambitions, Instagram is your passport.
Instagram Usage Patterns: How People Spend Time on Instagram
 So, what are all these billions of users actually doing on Instagram? Spoiler: It’s not just stalking their exes.
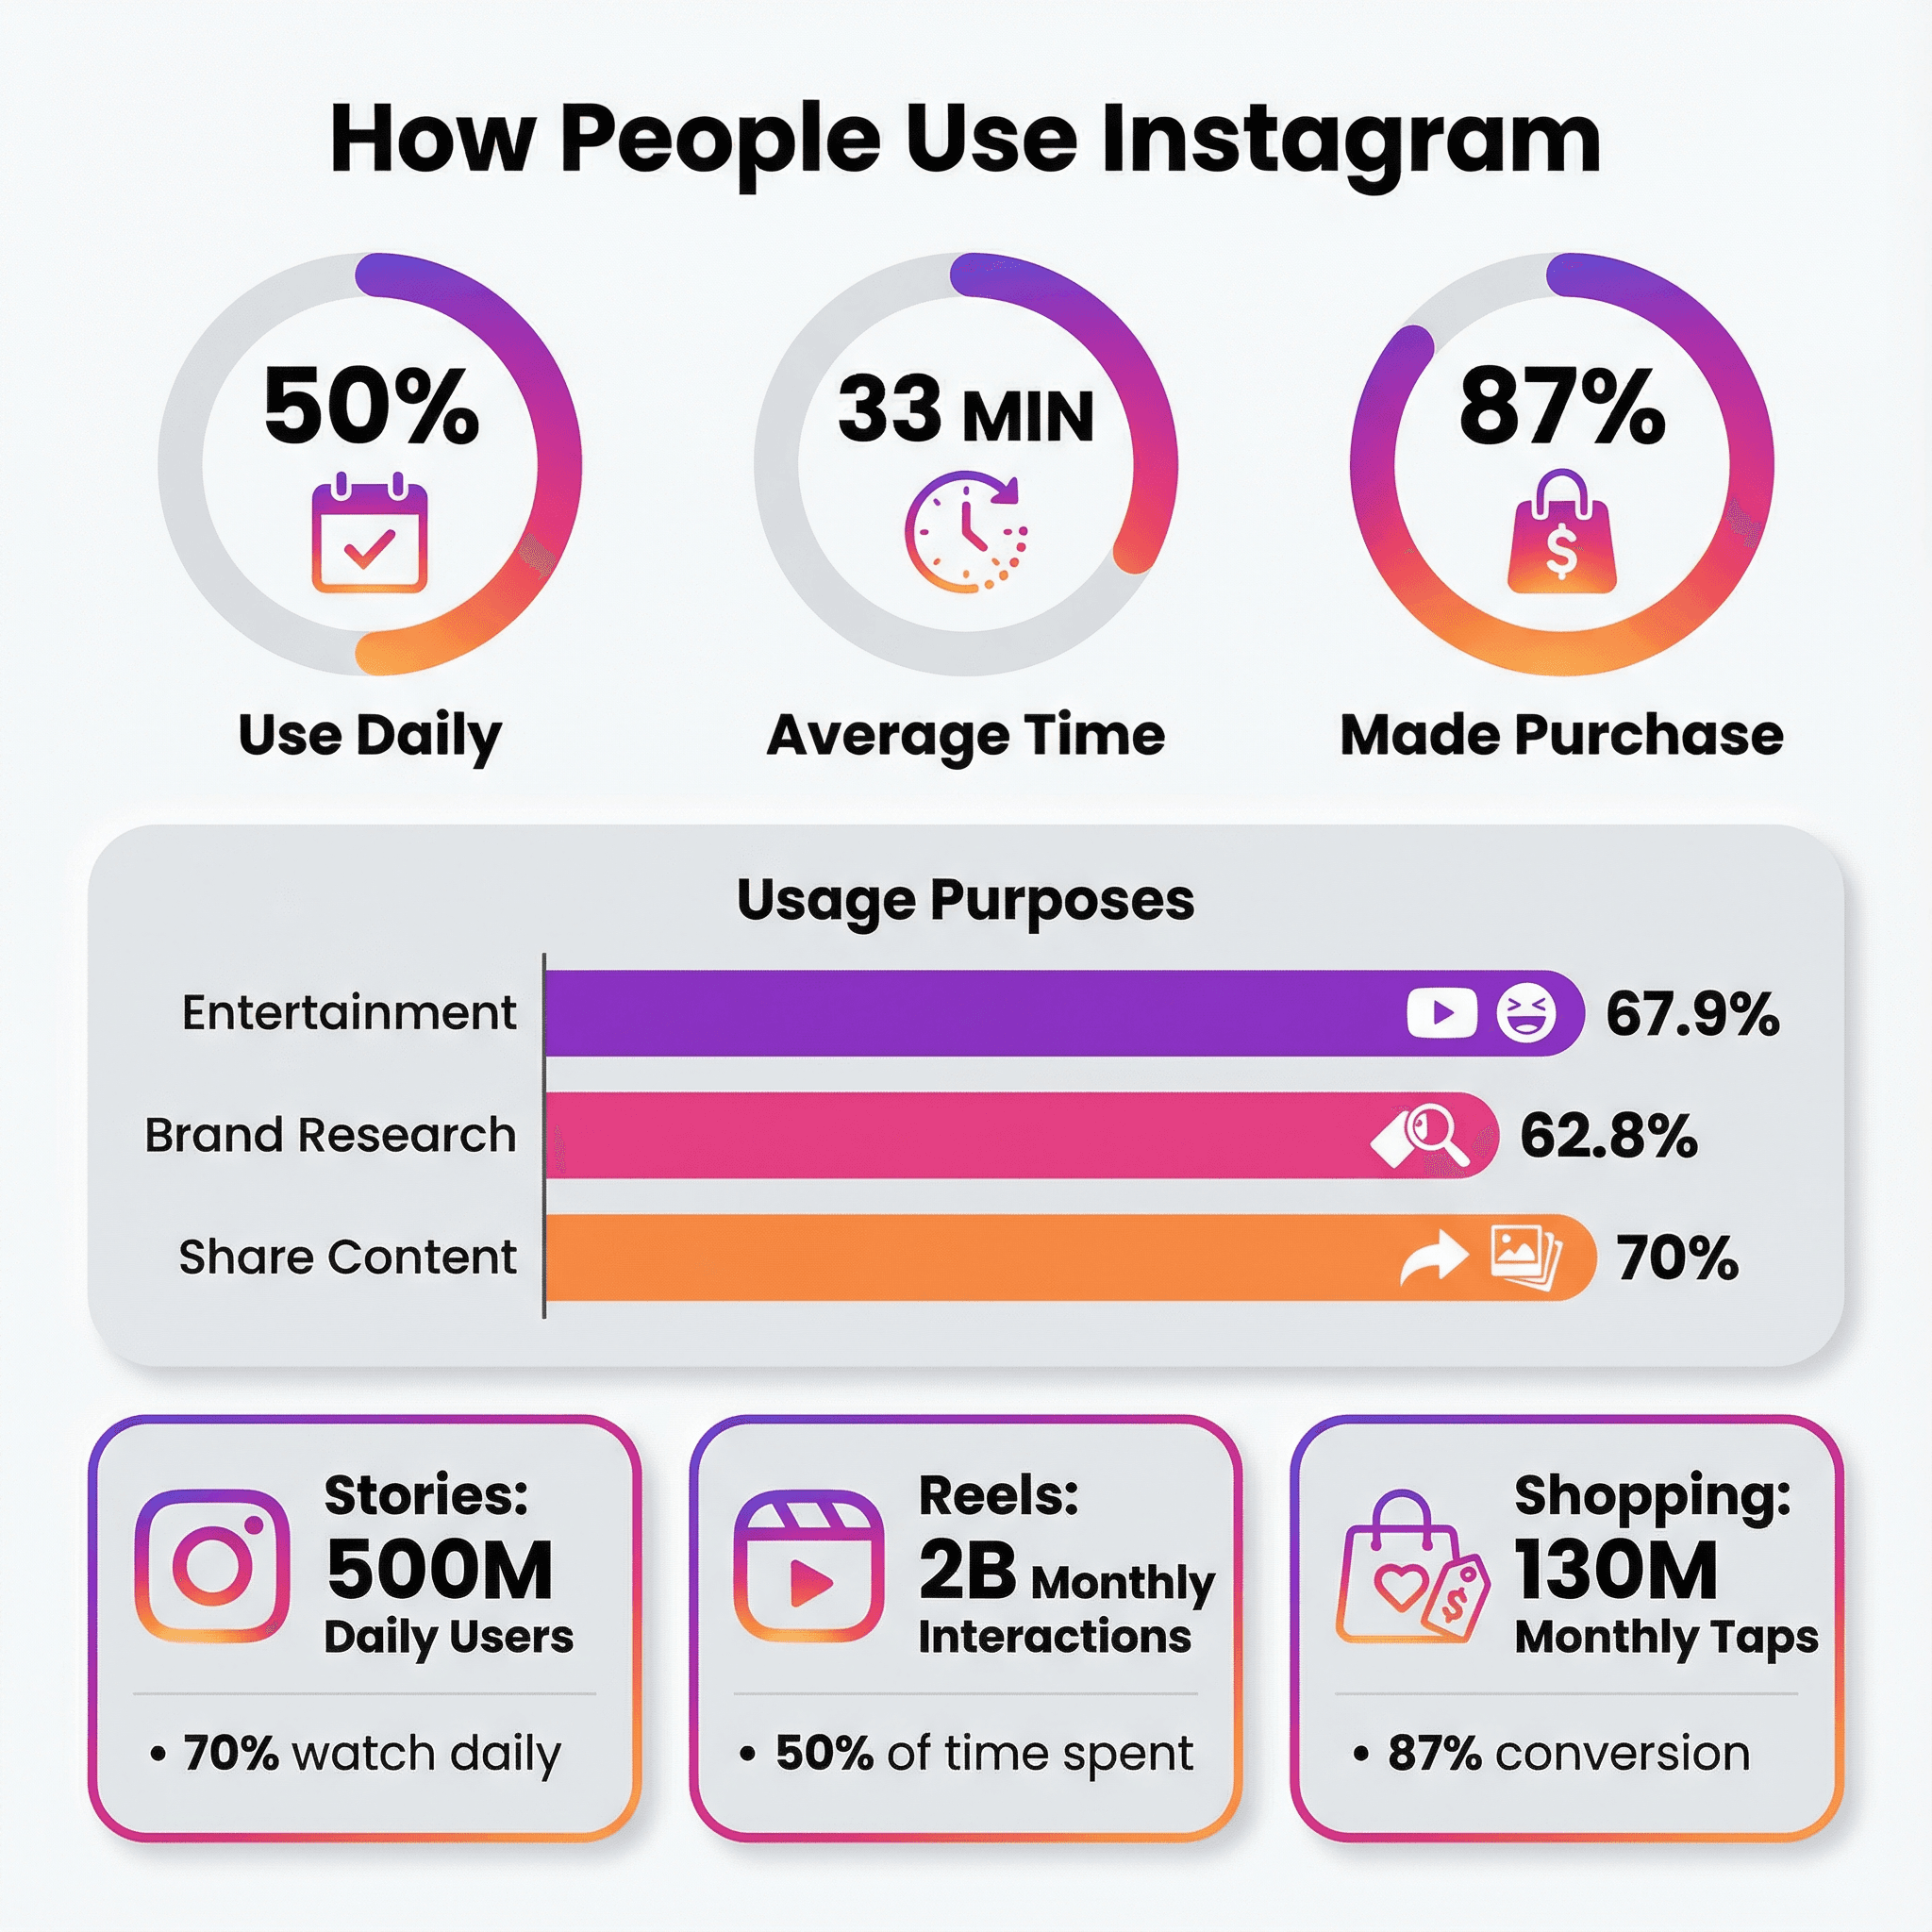
- Half of U.S. adults use Instagram at least once a day ().
- Average daily time spent: 33 minutes in the U.S., 32+ minutes globally ().
- Why do people use Instagram?
- 67.9%: For funny or entertaining content
- 62.8%: To follow or research brands and products ()
- 70%: To share their own photos/videos
Instagram isn’t just about keeping up with friends—it’s a discovery engine for brands and trends. Nearly two-thirds of users actively use Instagram for brand and product discovery ().
Stories, Reels, and Shopping: Key Engagement Drivers
- Stories: 500 million daily users (), with 70% of the user base watching Stories daily. About one-third of the most viewed Stories are from businesses.
- Reels: Over 2 billion people interact with Reels each month, and Reels now account for 50% of all time spent on Instagram (). Users play Reels 200+ billion times per day. (Yes, billion. With a “b.”)
- Shopping: 130 million users tap on shopping posts each month (), and 87% of users say they’ve made a purchase based on something they saw on Instagram (). In the U.S., 37% of users are expected to make at least one purchase on Instagram in 2025 ().
Instagram has become a one-stop shop for entertainment, inspiration, and impulse buys. If you’re not leveraging Stories, Reels, and Shopping features, you’re leaving serious engagement (and sales) on the table.
Instagram Engagement Statistics: Likes, Comments, and More
 Engagement is the name of the game on Instagram. Here’s what the numbers say:
-
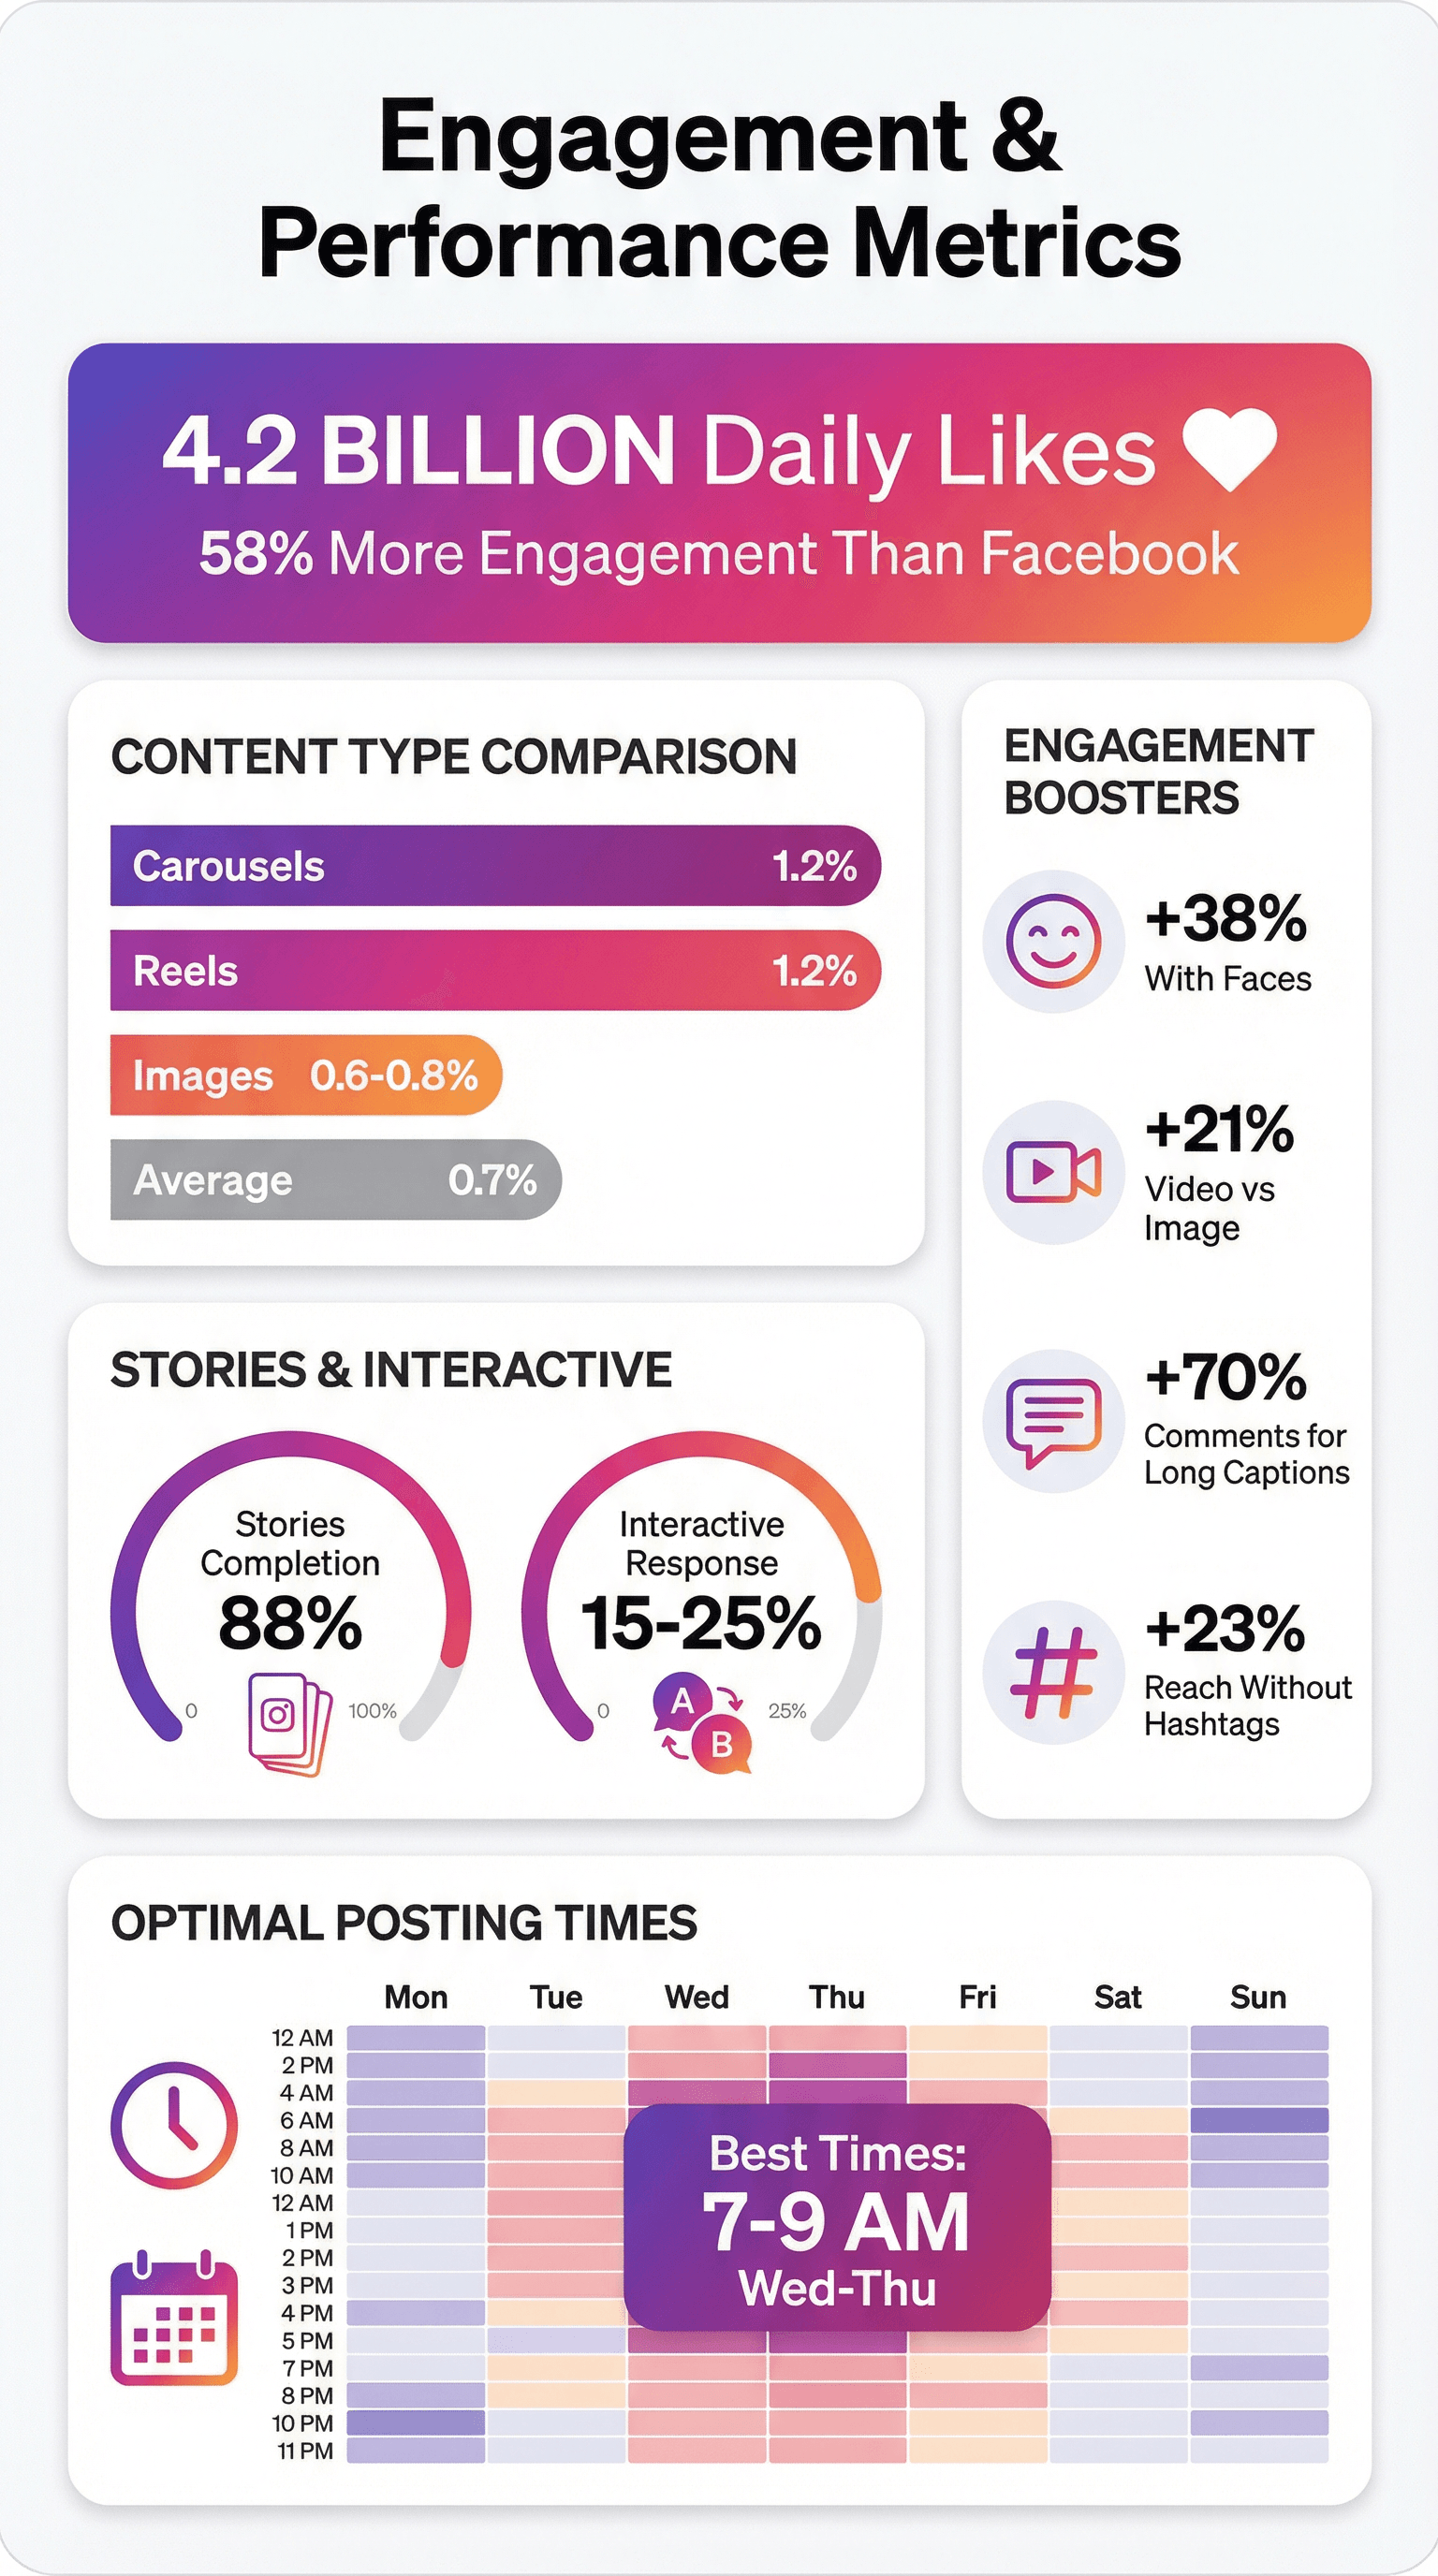
4.2 billion likes are given out every day ()
-
Instagram generates 58% more engagement per follower than Facebook ()
-
Average engagement rate (all posts, all account sizes): approx. 0.7% ()
-
By content type:
- Carousels: Highest engagement rate, around 1.2% ()
- Reels: approx. 1.2% engagement rate ()
- Images: 0.6-0.8%
-
Stories: Average completion rate for brand Stories is 88% (), and interactive stickers can get 15-25% response rates ()
-
Account size matters: Smaller accounts (under 5,000 followers) often see 3-5% engagement, while mega-influencers might see under 1% ()
-
Faces in photos: Posts featuring human faces get approx. 38% more engagement ()
-
Video vs. image: Video posts get about 21% more engagement than static images ()
-
Long captions: Posts with captions over 300 characters get 70% more comments ()
-
Hashtags: Posts without hashtags had 23% higher reach than those with many hashtags ()
Best Times and Days for Engagement
- Best times to post: 7–9 AM local time, especially Wednesday and Thursday ().
- U.S. optimal window: 8–10 AM weekdays.
- Sunday evenings (around 8 PM) can also see high engagement ().
But here’s the real secret: check your own Instagram Insights to see when your followers are most active. The algorithm loves early engagement, so timing matters.
Instagram Follower Tracker & Growth: What the Numbers Reveal
 Tracking your follower growth isn’t just for vanity—it’s essential for understanding what’s working (and what’s not).
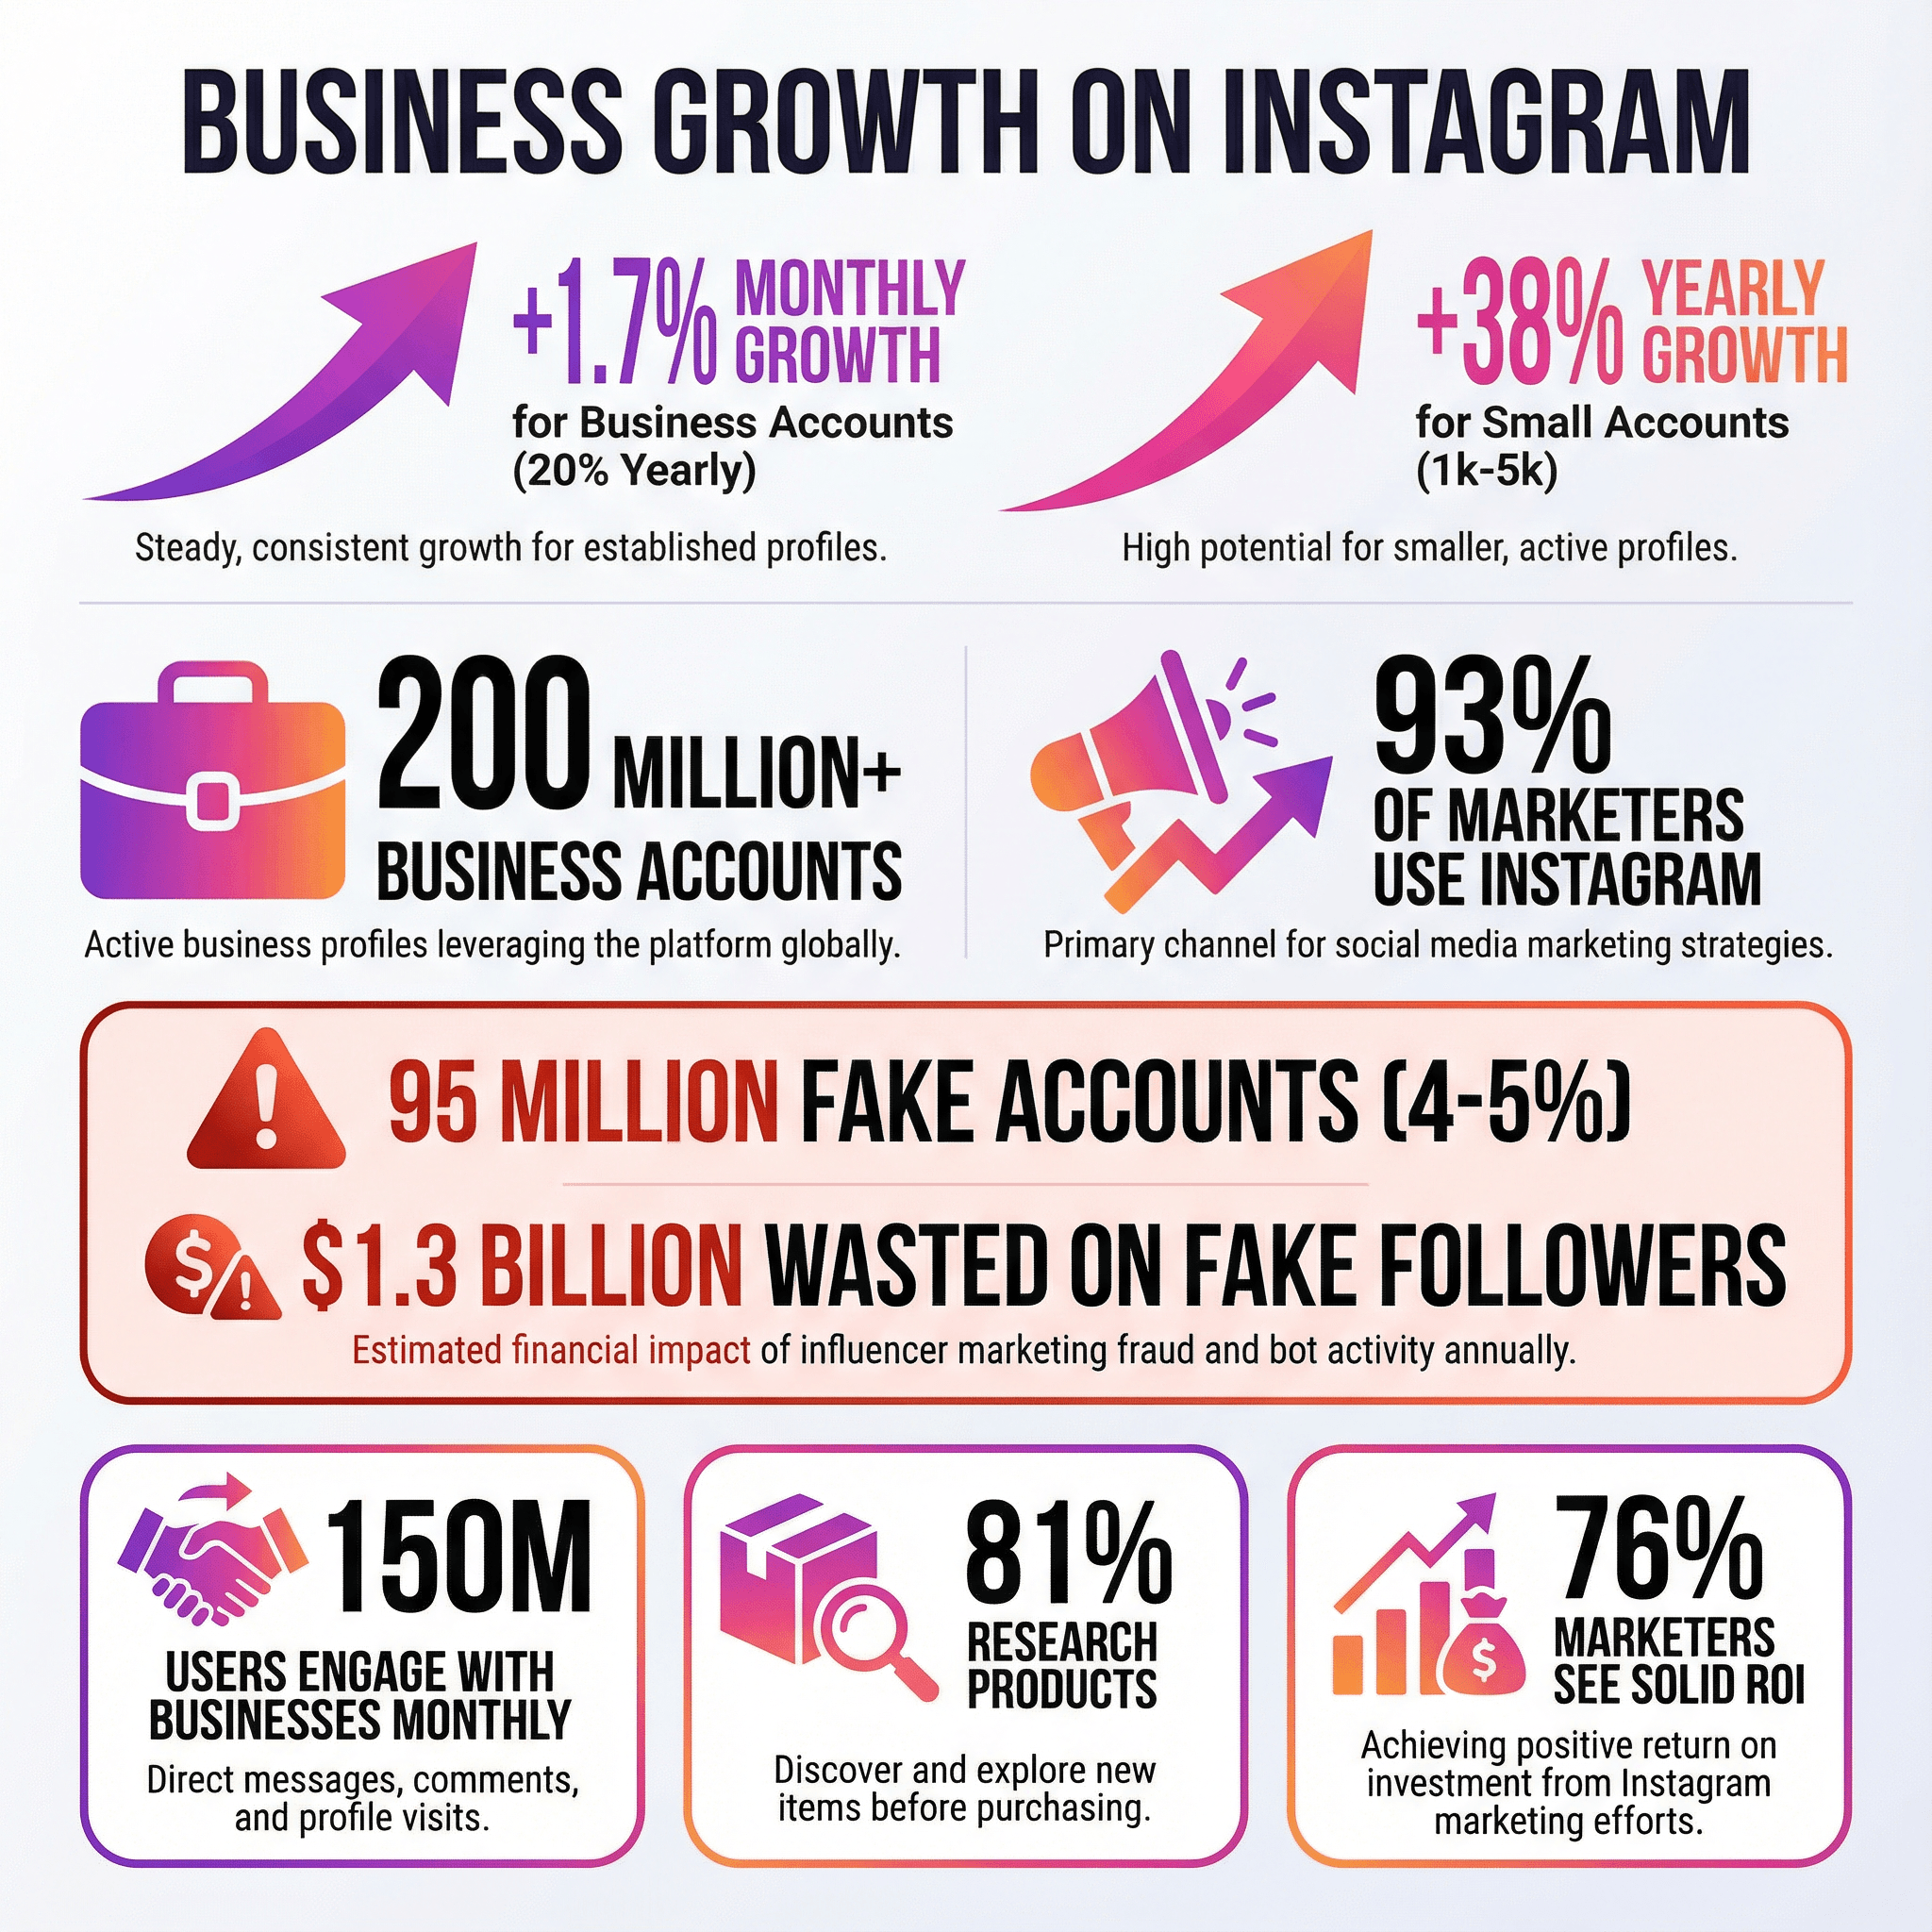
- Business accounts see +1.7% monthly follower growth (about 20% per year) ().
- Small accounts (1k–5k followers) can see about +38% yearly growth if actively managed ().
- Over 200 million businesses are active on Instagram ().
- 93% of marketers have used Instagram to reach customers ().
- Fake followers: Estimated 95 million Instagram accounts are bots or spam (), about 4–5% of users. Some influencers have up to 15% fake followers.
- $1.3 billion in wasted marketing spend can be attributed to targeting fake followers ().
Why track followers? Sudden spikes or drops can reveal viral moments, spam attacks, or Instagram’s latest bot purge. Using an Instagram follower tracker helps you separate real growth from smoke and mirrors.
Tools for Tracking Instagram Followers and Analytics
There’s no shortage of options, but here are a few standouts:
- Instagram Insights: Free, built-in for business/creator accounts. Great for a quick overview.
- Social Blade: Tracks follower changes, projections, and competitive benchmarking.
- HypeAuditor / Modash: Deep dives into follower quality, fake follower detection, and influencer analytics.
- NapoleonCat, Sprout Social, Buffer, Later: Full-suite social management with advanced analytics.
- : AI-powered analytics and web scraping. Thunderbit lets you track competitors’ posts, gather engagement data, and even scrape Instagram content for custom analysis. It’s surprisingly easy to use—think “Instagram analytics for people who hate spreadsheets.” (And yes, I’m biased, but I’m also a fan of making data less painful.)
- Inflact: Profile analyzer for engagement rates, posting frequency, and growth trends ().
Pro tip: Don’t obsess over daily ups and downs. Look for trends, track spikes, and always check for bot activity.
Instagram Business & Creator Stats: Brands, Influencers, and ROI
 Instagram isn’t just for selfies and memes—it’s a serious business tool.
- 200 million+ business accounts on Instagram ().
- 86% of U.S. online retailers have an Instagram account ().
- 150 million users engage directly with businesses each month ().
- 90% of users follow at least one business ().
- 81% of users research products and services on Instagram ().
- 87% have made a purchase based on Instagram content ().
- 76% of marketers say Instagram delivers solid ROI ().
Influencer Marketing: Engagement and Trust
-
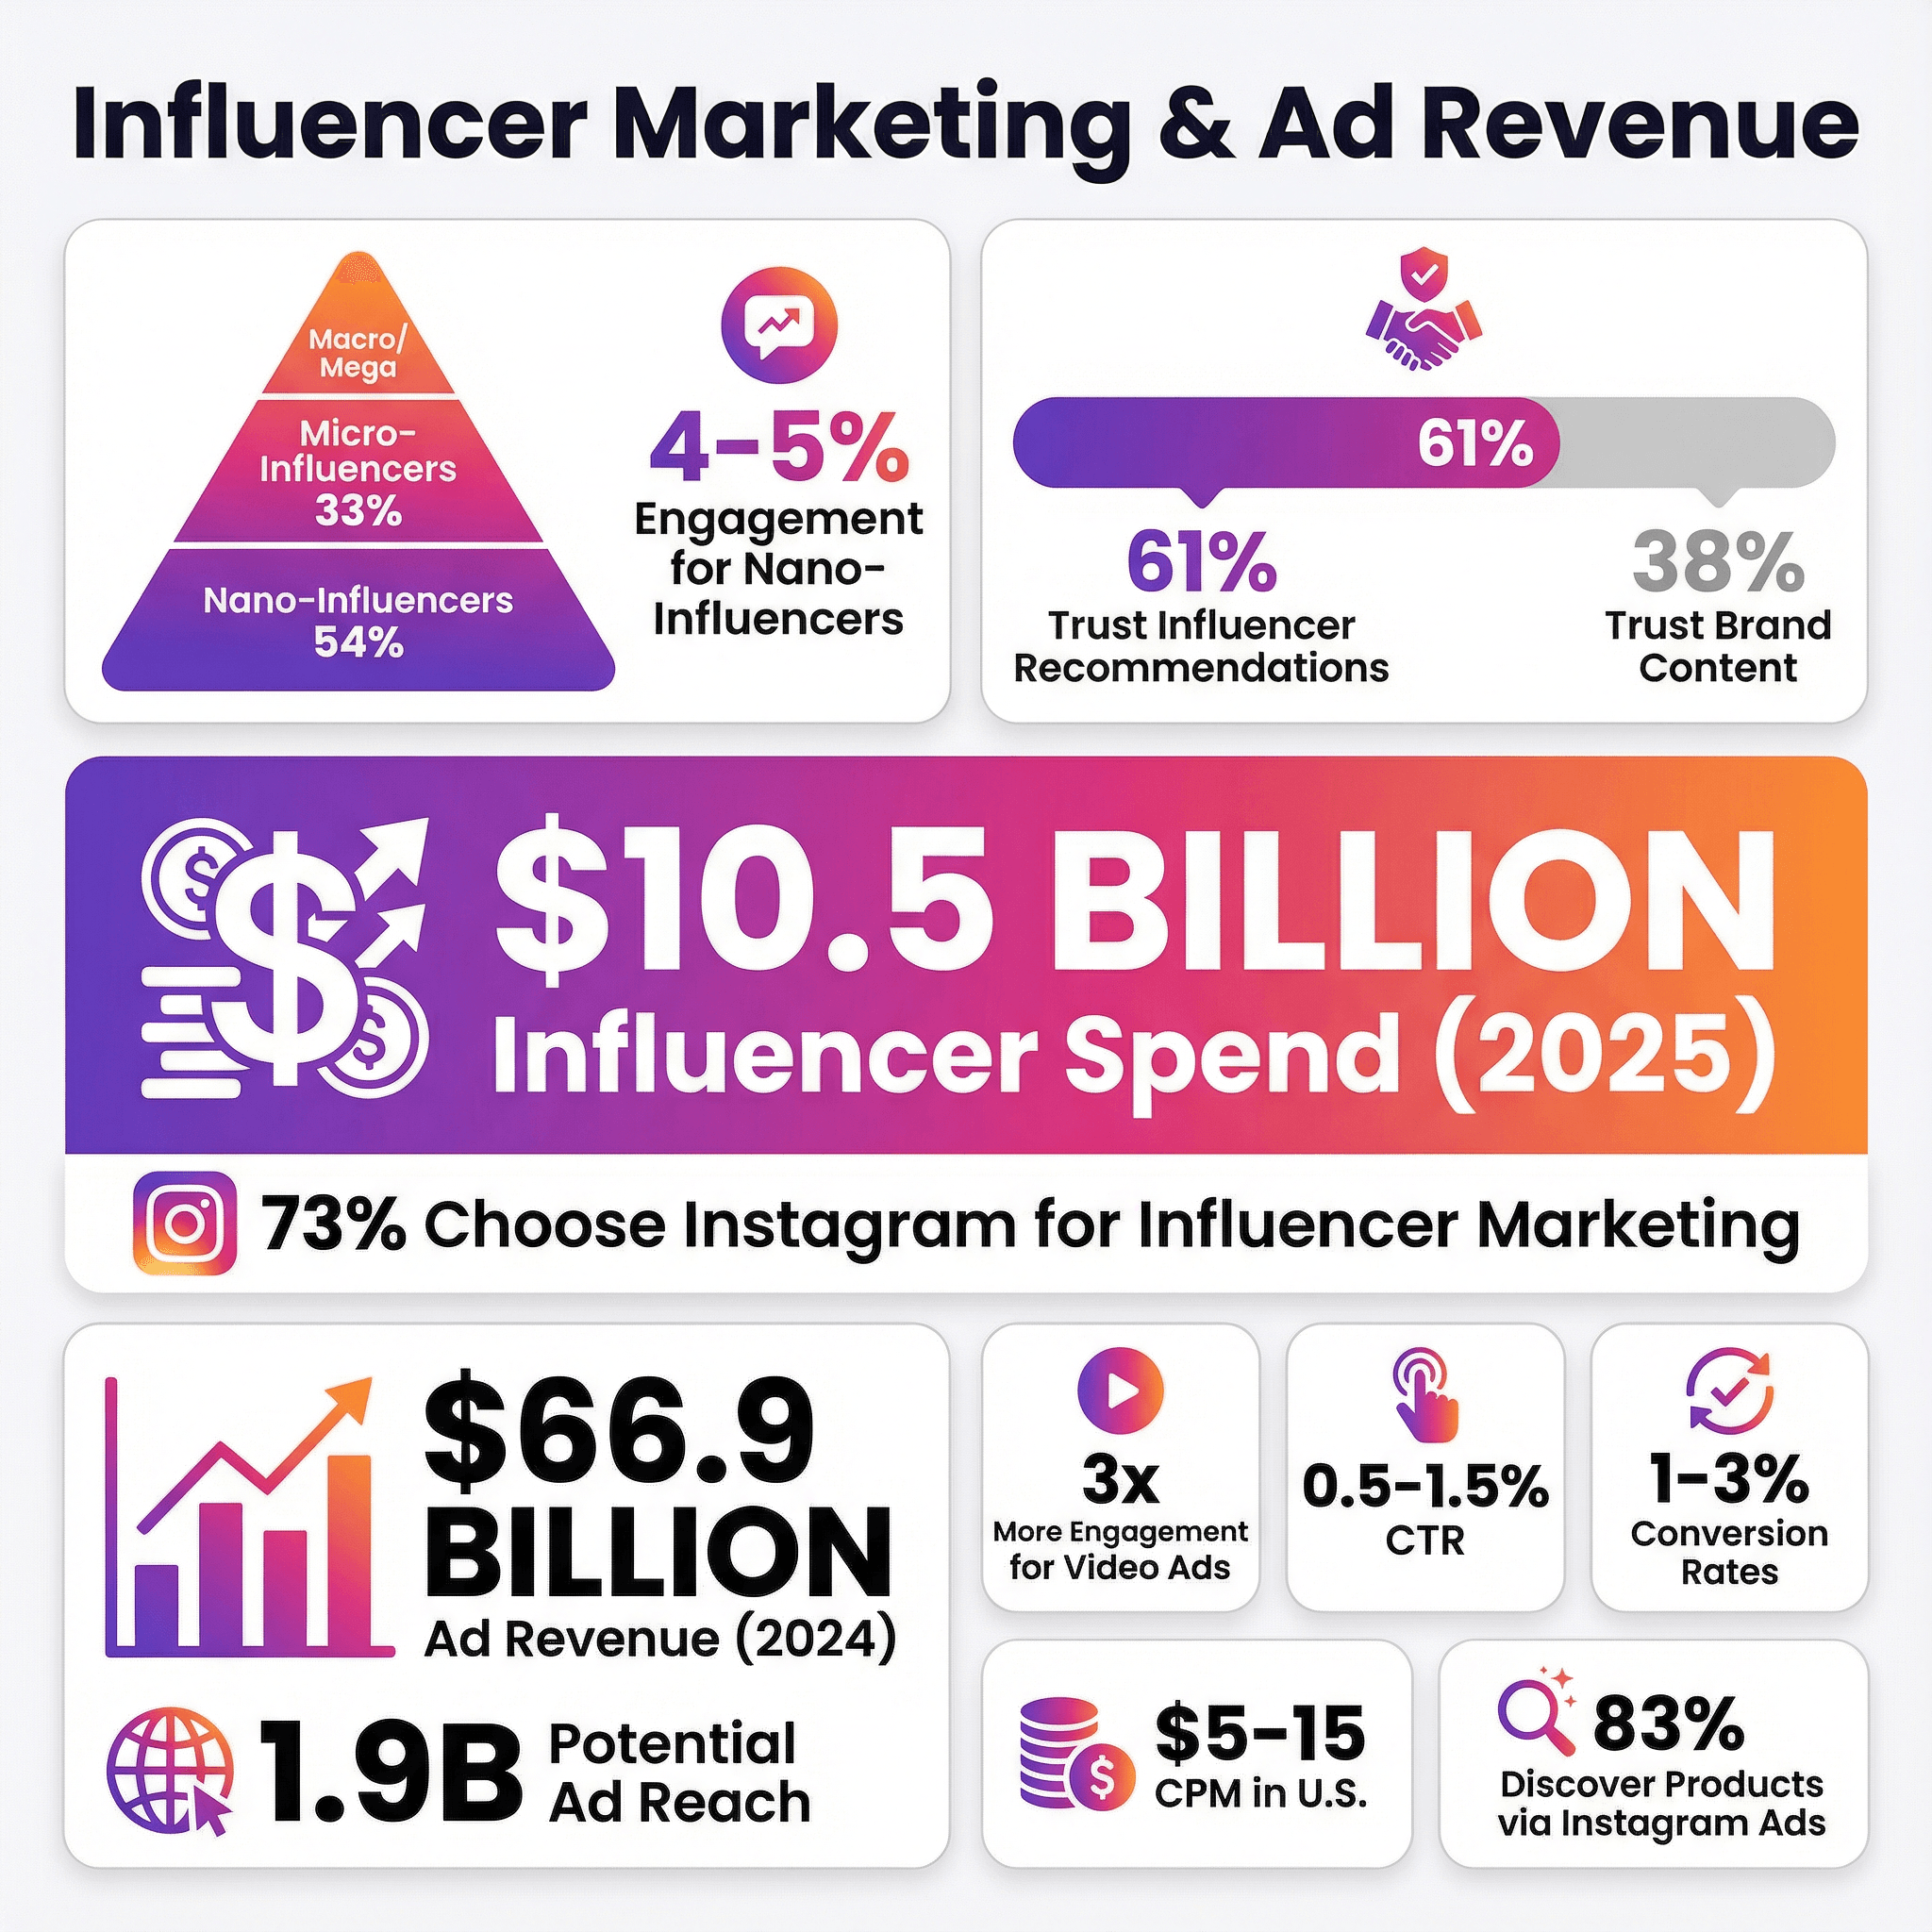
54% of influencers are nano-influencers (under 10k followers), 33% are micro-influencers (10k-100k) ()
-
Nano-influencers see 4-5% engagement rates ()
-
61% of consumers trust influencer recommendations, compared to 38% for brand content ()
-
Influencer marketing spend: 10.5 billion USD in the U.S. in 2025 ()
-
73% of marketers choose Instagram as the top channel for influencer marketing ()
Instagram Ads & Revenue: Reach, Spend, and Results
Instagram’s ad business is booming—and the numbers prove it.
- Potential ad reach: 1.9 billion people ().
- Ad revenue: $66.9 billion in 2025 ().
- Video ads: About 3x more engagement than photo ads ().
- Click-through rates (CTR): 0.5–1.5% ().
- Conversion rates: 1–3% for many advertisers ().
- Cost per 1,000 impressions (CPM): $5–$15 in the U.S.
- 83% of consumers say Instagram helps them discover new products or services ().
- Stories ads alone projected to generate $21 billion in revenue by 2025 ().
Instagram Analytics for Ad Performance
Brands use Instagram analytics to:
- Track reach, impressions, clicks, CTR, and conversions
- Analyze which demographics are engaging most
- Monitor ad frequency to avoid fatigue
- Compare performance across Facebook and Instagram placements
If you’re running ads, keep a close eye on these metrics—and don’t be afraid to tweak your creative or targeting based on what the data says.
Instagram Content Trends: What’s Working in 2026
Instagram’s vibe is always evolving. Here’s what’s hot right now:
- Short-form video is king: Users are spending 80% more time watching videos than two years ago ().
- Carousels: Best for storytelling and engagement ().
- Authenticity rules: Unfiltered, real-life moments and “photo dumps” are in.
- Interactive content: Polls, quizzes, and Q&A stickers drive 15–25% interaction rates ().
- Fewer hashtags: 3–5 targeted hashtags work better than 30 generic ones ().
- Memes and pop culture: Brands are jumping on trends to stay relevant.
- User-generated content: Brands are encouraging customers to post and reshare, building community and trust.
If you want to grow, lean into video, carousels, and authentic storytelling. And don’t be afraid to have a little fun—memes are currency on Instagram.
Instagram Analytics: Making Data-Driven Decisions
Here’s where the rubber meets the road. Instagram analytics aren’t just for data nerds—they’re your secret weapon for smarter growth.
Key metrics to monitor:
- Follower growth & demographics: Are you reaching your target audience? Are you growing faster after a giveaway or a viral Reel?
- Reach and impressions: Is your content getting seen by new people?
- Engagement: Likes, comments, shares, saves—what’s resonating?
- Engagement rate: Track by content type to see what works best.
- Best times to post: Use Insights to see when your followers are online.
- Content type performance: Are Reels outperforming Stories? Are carousels getting more saves?
- Hashtag and caption insights: Which hashtags actually drive reach? Are people reading your captions?
- Conversion metrics: Are people clicking your link in bio, visiting your website, or buying your products?
Pro tip: Set up a routine—analyze, learn, adjust, repeat. Treat Instagram like a science experiment. Hypothesize, test, and refine. And always benchmark against industry averages to see how you stack up ().
If you want to take your analytics to the next level, try . It’s an AI-powered tool that makes tracking, benchmarking, and even scraping Instagram data as easy as two clicks. (And yes, you can use it to spy on your competitors’ best-performing posts—no judgment.)
Key Takeaways: What These Instagram Statistics Mean for You
Let’s wrap up with the most actionable insights from all these stats:
- Instagram is essential: With billions of users and high daily engagement, it’s a must for brands, creators, and anyone looking to grow an audience.
- Know your audience: Use demographic stats and analytics to tailor your content and posting schedule.
- Stories and Reels are non-negotiable: That’s where the engagement lives.
- Quality > quantity: Carousels, videos, and authentic posts outperform static images and generic content.
- Leverage influencers and UGC: Micro-influencers and customer posts drive trust and conversions.
- Use analytics for growth: Set goals, track what works, and adjust your strategy. Tools like make this process painless.
- Optimize for business: Use shopping features, track conversions, and integrate Instagram into your customer journey.
- Stay on top of trends: Video, authenticity, and interactive content are leading the way in 2024.
Instagram isn’t just a platform—it’s a living, breathing ecosystem. The brands and creators who thrive are the ones who pay attention to the numbers, adapt quickly, and never stop experimenting. So, next time you’re scrolling, remember: every like, comment, and Story view is a data point. Use them wisely.
Sources & Further Reading
Want to dig deeper? Here are the best resources for Instagram statistics and strategy:
And of course, check out the for more insights on Instagram analytics, web scraping, and data-driven growth.
Ready to level up your Instagram strategy? Start tracking, testing, and turning those stats into real results. And if you’re tired of spreadsheets, is waiting for you.
Happy ‘gramming—and may your engagement rates be ever in your favor.
— Shuai Guan, Co-founder & CEO,