If you think email is old news in the world of digital marketing, think again. In 2026, email marketing is not just alive—it’s thriving, evolving, and, in many ways, more essential than ever. The numbers tell a story that’s hard to ignore: for every $1 spent, a significant chunk of marketers are seeing $36, $40, or even $50+ in return (Litmus), and open rates are climbing to levels we haven’t seen in years.
But here’s the twist: privacy regulations, AI-powered tools, and shifting consumer habits are rewriting the rules of engagement. If you’re not keeping up with the latest email marketing statistics and benchmarks, you’re flying blind—and that’s a risky move in today’s hyper-competitive landscape.
In this deep dive, I’ll walk you through the most up-to-date email marketing benchmarks for 2026, break down what’s really happening with open rates, clicks, conversions, and ROI, and show you how to use tools like Thunderbit to turn raw data into smarter, more profitable campaigns. Whether you’re a seasoned marketer or just trying to figure out why your open rates look weird after Apple’s privacy updates, you’ll find actionable insights here to help you hit (and exceed) your goals this year.
Try Thunderbit for data-driven marketing
Top Email Marketing Statistics at a Glance
Let’s kick things off with the headline stats every marketer should know for 2026. These aren’t just numbers—they’re the pulse of the industry, and they set the bar for what “good” looks like in your next campaign.
- Global average open rate (2026): 55.4%
Why it matters: Open rate is still the first gut-check for subject line and sender reputation, even if privacy changes have muddied the waters. - Unique open rate (2026): 37.3%
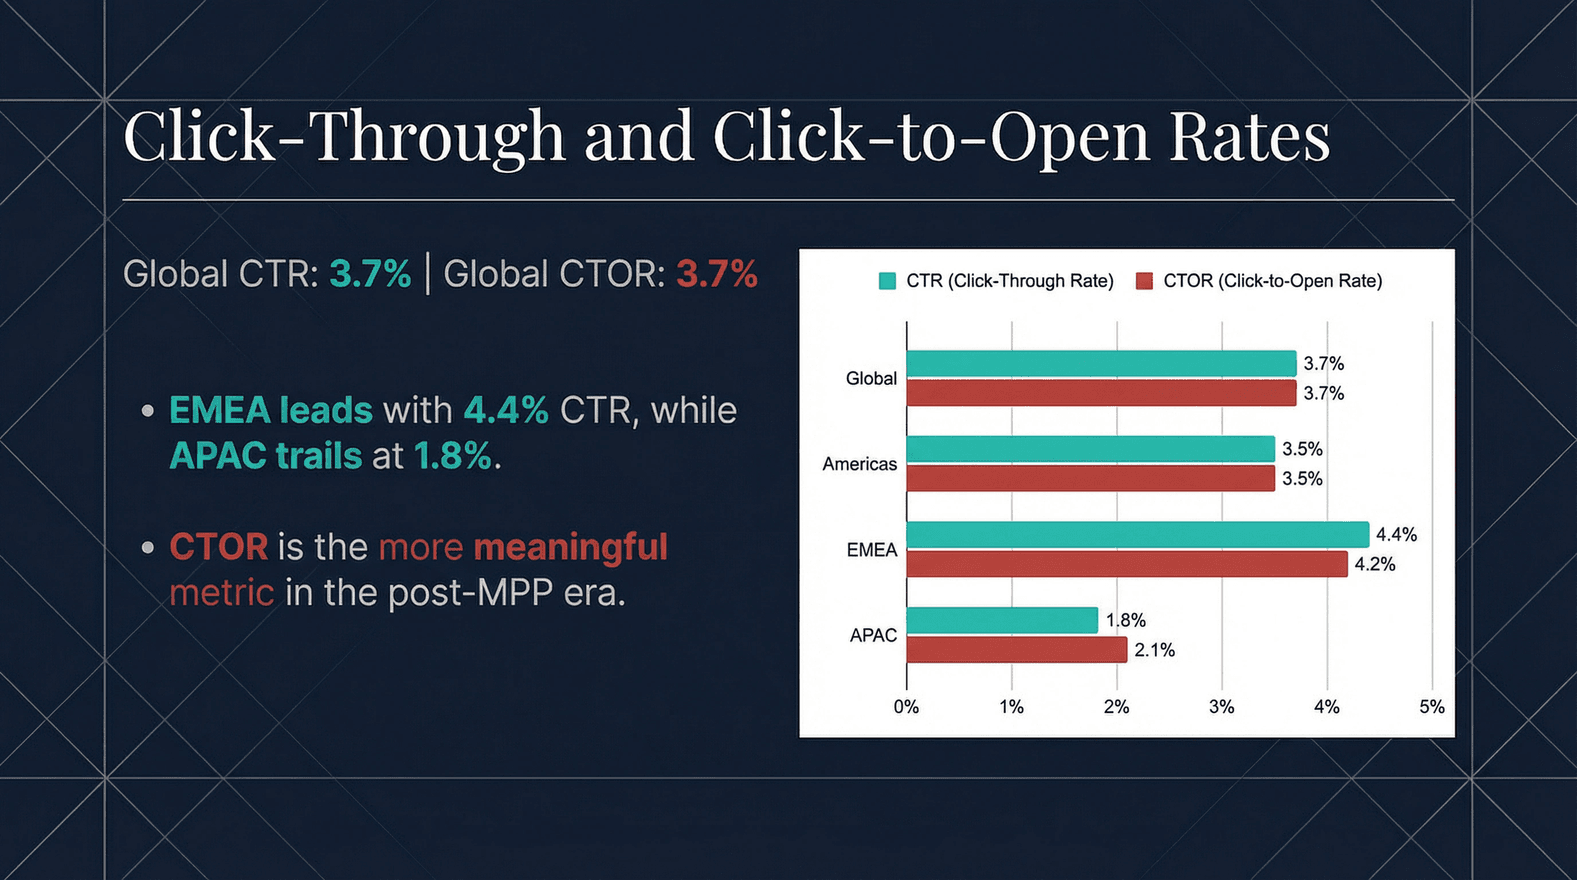
Why it matters: Unique opens filter out repeat openers, giving you a clearer sense of how many real people are engaging. - Click-through rate (CTR, 2026): 3.7%
Why it matters: Clicks are a much stronger signal of true engagement and intent than opens alone. - Unique CTR (2026): 1.4%
Why it matters: Unique clicks help you understand how many individuals are taking action. - Click-to-open rate (CTOR, 2026): 3.7%
Why it matters: CTOR tells you how compelling your email content is after someone opens it. - Unsubscribe rate (2026): 0.14%
Why it matters: High unsubscribes are a red flag for list fatigue or irrelevant content. - Bounce rate (2026): 0.79%
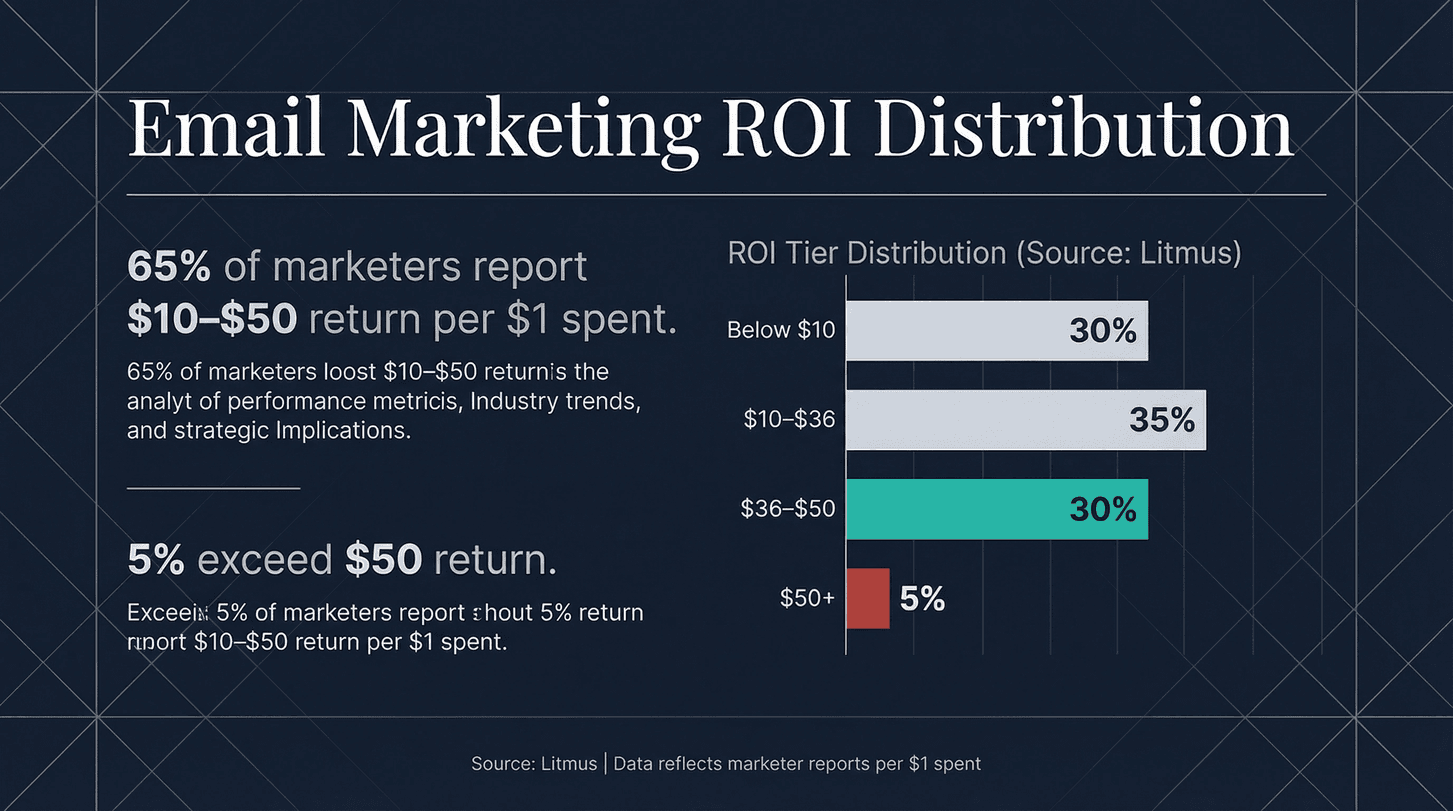
Why it matters: Bounces affect your sender reputation and deliverability. - Email marketing ROI (Litmus 2025 State of Email Survey, self-reported by ~500 marketers):
- 35% of marketers see $10–$36 back per $1 spent
- 30% see $36–$50 back
- 5% see more than $50 back
- US brands average $40 per $1, EU brands $43 per $1
These numbers are impressive, but they’re also just the starting point. The real magic happens when you dig into benchmarks by industry, region, and campaign type—and when you use these stats to drive smarter decisions.
Understanding Email Marketing Benchmarks: Why They Matter in 2026
Turn benchmarks into usable data Get Started Free
Benchmarks are like the GPS of email marketing. They tell you if you’re on the right road, falling behind, or blazing a new trail. In plain English, an email marketing benchmark is a standard or average performance metric—like open rate, CTR, or unsubscribe rate—based on data from thousands (or millions) of campaigns across your industry.
Why do benchmarks matter? Because they help you:
- Measure up: See how your campaigns stack up against the competition.
- Spot problems: Identify weak spots in your funnel (e.g., low CTR, high unsubscribes).
- Set realistic goals: Know what’s achievable and what’s exceptional.
- Optimize with confidence: Make data-driven tweaks instead of guessing.
For example, if your CTR is 1.2% and the industry average is 3.7%, you know it’s time to revisit your calls-to-action or content. On the flip side, if your unsubscribe rate is below 0.14%, you’re probably doing something right with your targeting and value proposition.
Benchmarks aren’t just for bragging rights—they’re a practical tool for continuous improvement and higher ROI (Litmus).
Email Open Rates 2024–2026: Trends and Insights
Let’s talk about open rates—the most-watched (and, lately, most controversial) metric in email marketing.
The Numbers
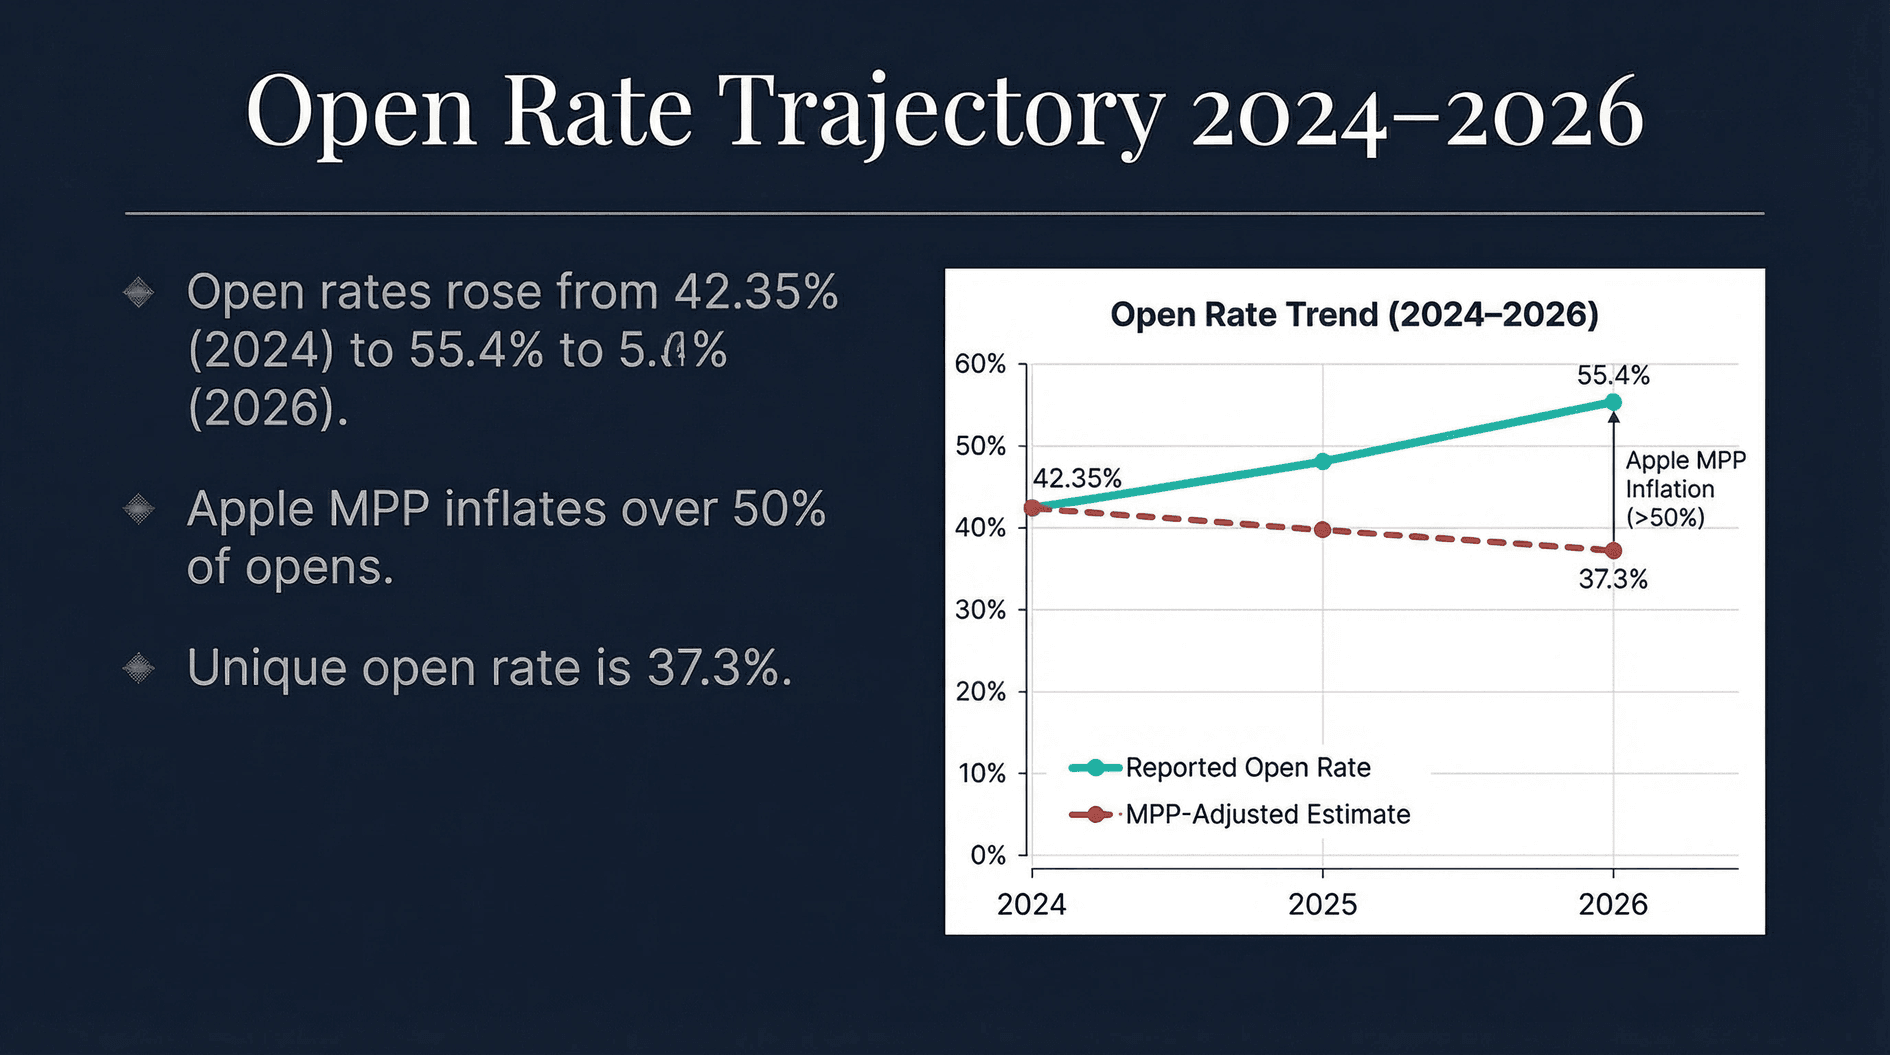
- 2024 average open rate: 42.35% (MailerLite 2026 benchmarks, year-over-year comparison)
- 2025 average open rate: 43.46% (MailerLite 2026 benchmarks, year-over-year comparison)
- 2026 global open rate: 55.4% (Dotdigital Global Benchmark Report 2026)
- 2026 unique open rate: 37.3% (Dotdigital Global Benchmark Report 2026)
That’s a big jump from 2024 to 2026, but don’t pop the champagne just yet. The story behind these numbers is more complicated.
What’s Driving the Change?
- Privacy updates: Over 50% of email opens now happen on devices with Apple Mail Privacy Protection (MPP) enabled, which can artificially inflate open rates and mask real engagement.
- Mobile usage: More emails are being opened on mobile, which can boost open rates but also means you have less time to grab attention.
- List hygiene and targeting: Better segmentation and cleaner lists are helping marketers reach more engaged audiences.
Are Open Rates Still Reliable?
Short answer: not as much as they used to be. Privacy features like MPP mean that some “opens” are triggered by email clients, not humans. That’s why savvy marketers (myself included) are shifting focus to clicks, conversions, and revenue as more reliable indicators of success (Litmus).
B2B vs. B2C
- B2B tends to see slightly higher open rates due to more targeted, relationship-driven lists.
- B2C open rates can be more volatile, especially in crowded verticals like ecommerce.
Bottom line: Use open rates as a directional metric, but don’t hang your strategy on them alone.
Click-Through Rates (CTR) and Click-to-Open Rates (CTOR): What’s a Good Result?
Clicks are where the rubber meets the road. If opens are about curiosity, clicks are about action.
Definitions
- CTR (Click-Through Rate): Total clicks divided by delivered emails.
- Unique CTR: Unique clickers divided by delivered emails.
- CTOR (Click-to-Open Rate): Total clicks divided by total opens. This shows how compelling your content is after someone opens your email (Dotdigital).
2026 Benchmarks
By Industry (MailerLite, 2026):
| Industry | Click Rate | CTOR |
|---|---|---|
| Business & Finance | 2.37% | 7.96% |
| E-commerce | 1.07% | 4.01% |
| Software & Web Apps | 1.15% | 5.40% |
| Real Estate | 1.72% | 6.72% |
| Non-profit | 2.90% | 8.24% |
Why CTR and CTOR Matter
- CTR tells you if your email is driving action.
- CTOR reveals if your content matches the promise of your subject line.
If your open rate is high but your CTR is low, you might have a “clickbait” subject line or weak content. If your CTOR is strong, your content is resonating with those who open.
Trends
-
Automation lifts clicks: Automated flows see much higher click rates (Klaviyo):
- Campaign click rate: 1.69%
- Automated flow click rate: 5.58%
-
Fewer clicks, more value: Even as click rates dip, each click is worth more—Omnisend found that click-to-conversion rates jumped from 5.0% to 7.69% in 2025 (Omnisend).
Conversion Rates and Revenue: Turning Opens into Business Results
 Opens and clicks are nice, but conversions and revenue are what really move the needle.
What’s a Conversion Rate?
In email marketing, the conversion rate is the percentage of recipients who complete a desired action—usually a purchase, sign-up, or download—after clicking through your email.
2026 Benchmarks
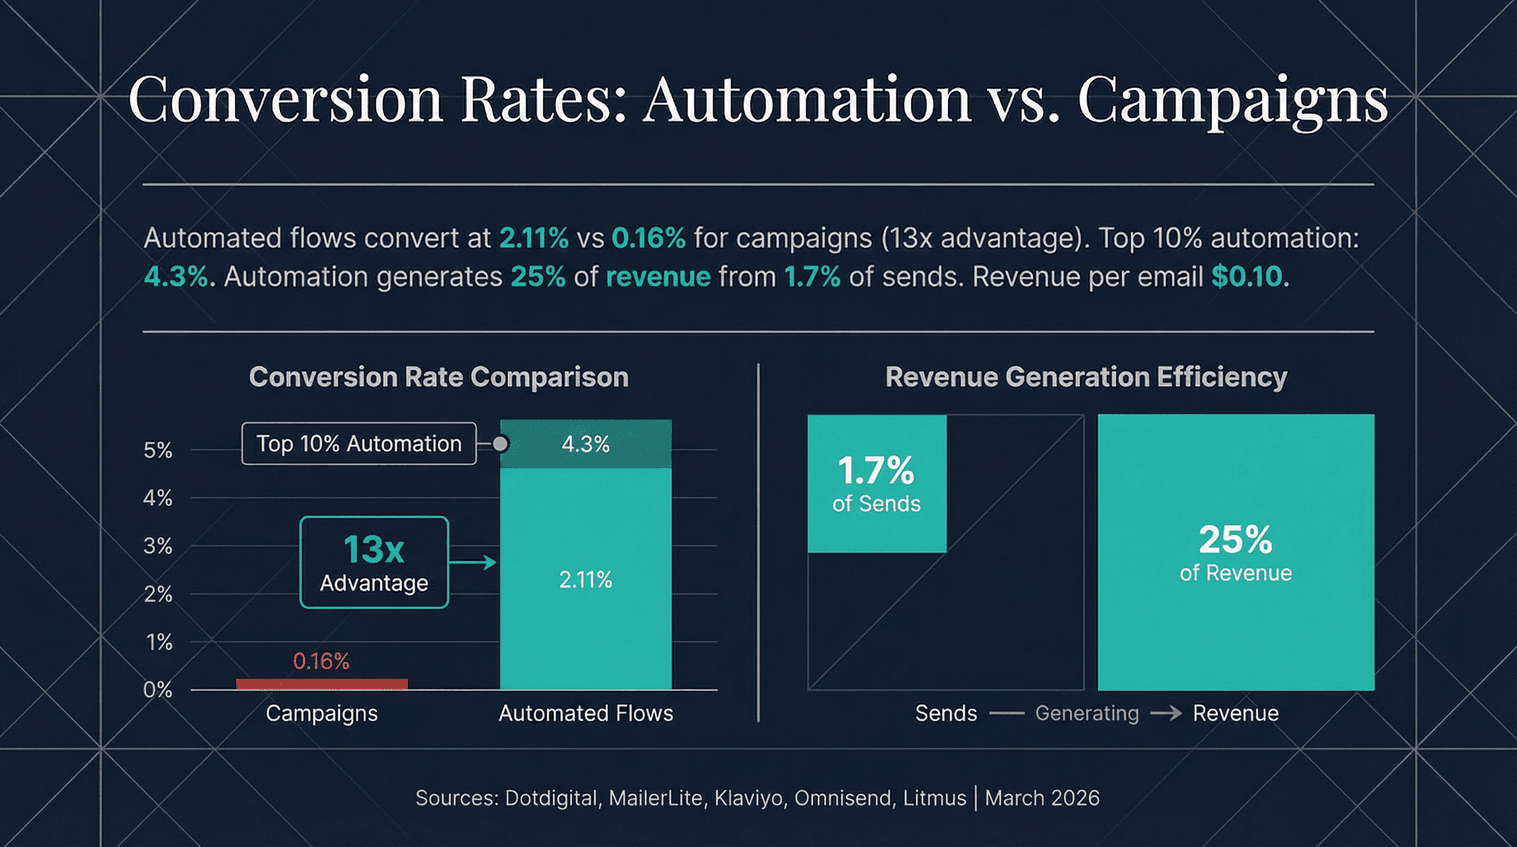
- Campaign placed order rate (Klaviyo): 0.16%
- Automated flow placed order rate (Klaviyo): 2.11%
- Top decile (best 10%) placed order rate: 4.3%
- Average revenue per email (Omnisend, US SMB e-commerce, 2025): $0.10 (up from $0.08, +17% YoY)
- Automated email revenue per send: $2.01 vs. $0.10 for scheduled emails
What Drives High Conversion Rates?
- Personalization and segmentation
- Timely, relevant offers
- Strong calls-to-action
- Automation and triggered flows
The takeaway? Automation is your friend. Automated emails generate 25% of total email revenue while representing just 1.7% of sends.
Unsubscribe and Bounce Rates: Keeping Your List Healthy
No one likes to see unsubscribes or bounces, but they’re a fact of life—and a key indicator of list health.
Definitions
- Unsubscribe rate: Percentage of recipients who opt out after receiving your email.
- Bounce rate: Percentage of emails that couldn’t be delivered (hard bounces are permanent, soft bounces are temporary).
2026 Benchmarks
- Global unsubscribe rate: 0.14% (Dotdigital)
- Bounce rate: 0.79% (Dotdigital)
- Mailchimp all-users unsubscribe rate: 0.22%
Why They Matter
- High unsubscribe rates can signal irrelevant content, over-mailing, or poor targeting.
- High bounce rates hurt your sender reputation and can get you blocked by ISPs.
Tips for a Healthy List
- Regularly clean your list (remove inactive or invalid addresses)
- Make unsubscribing easy (it’s now required by Gmail, Yahoo, and others)
- Segment and personalize to keep content relevant
- Monitor bounce and spam complaint rates—keep spam below 0.1% to avoid deliverability issues
Industry-Specific Email Marketing Benchmarks: How Do You Compare?
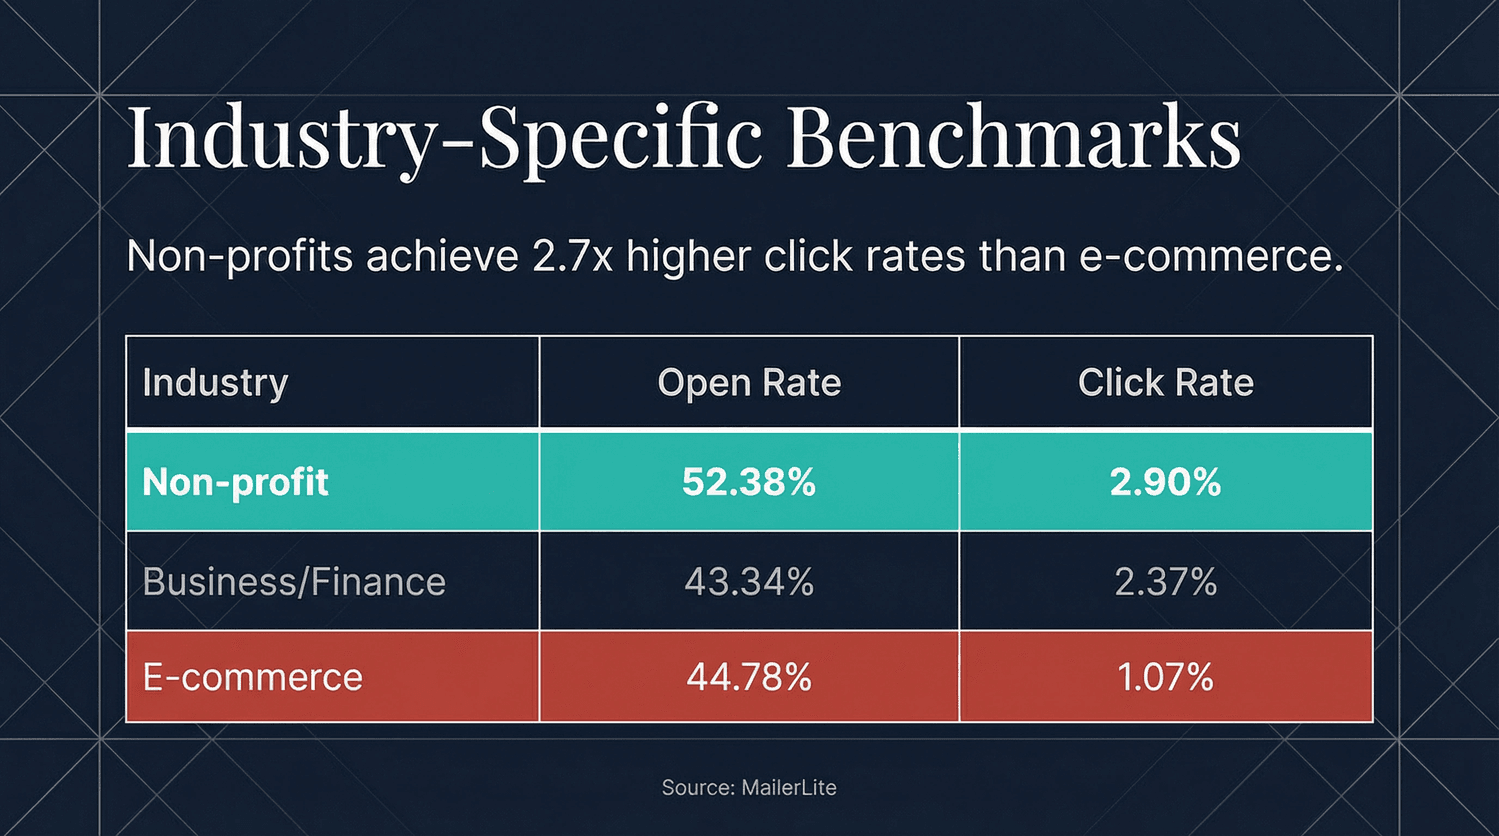
Not all industries are created equal when it comes to email performance. Here’s how some of the most common verticals stack up (MailerLite, 2026):
| Industry | Open Rate | Click Rate | CTOR | Unsub Rate |
|---|---|---|---|---|
| Business & Finance | 43.34% | 2.37% | 7.96% | 0.16% |
| E-commerce | 44.78% | 1.07% | 4.01% | 0.18% |
| Software & Web Apps | — | 1.15% | 5.40% | 0.20% |
| Real Estate | 40.37% | 1.72% | 6.72% | 0.16% |
| Non-profit | 52.38% | 2.90% | 8.24% | 0.19% |
Key insights:
- Non-profits and “interest-driven” categories tend to have higher opens and clicks.
- E-commerce faces the most inbox competition; its click rate and CTOR sit at the lower end of the table even when opens remain competitive.
- Software/SaaS and real estate are in the middle, with room to improve on engagement.
If you’re in a sector with lower averages, don’t panic—use these numbers to find your edge.
The Impact of Privacy and Technology on Email Campaign Performance Data
If you’ve noticed your open rates spiking or your location data getting fuzzy, you’re not alone. Privacy and tech changes are reshaping what “good” looks like in email marketing.
Privacy Regulations
- Apple Mail Privacy Protection (MPP): Over 50% of opens are now “masked”, inflating open rates and hiding real user behavior.
- US state privacy laws: Roughly 20+ US states now have comprehensive consumer privacy laws on the books, with more in active legislative pipelines — Bloomberg Law's state privacy legislation tracker is the live reference.
- Gmail/Yahoo rules: As of 2024, senders must have SPF, DKIM, DMARC, and support one-click unsubscribe (Google, Yahoo). Spam rates must stay below 0.1%.
What This Means for Marketers
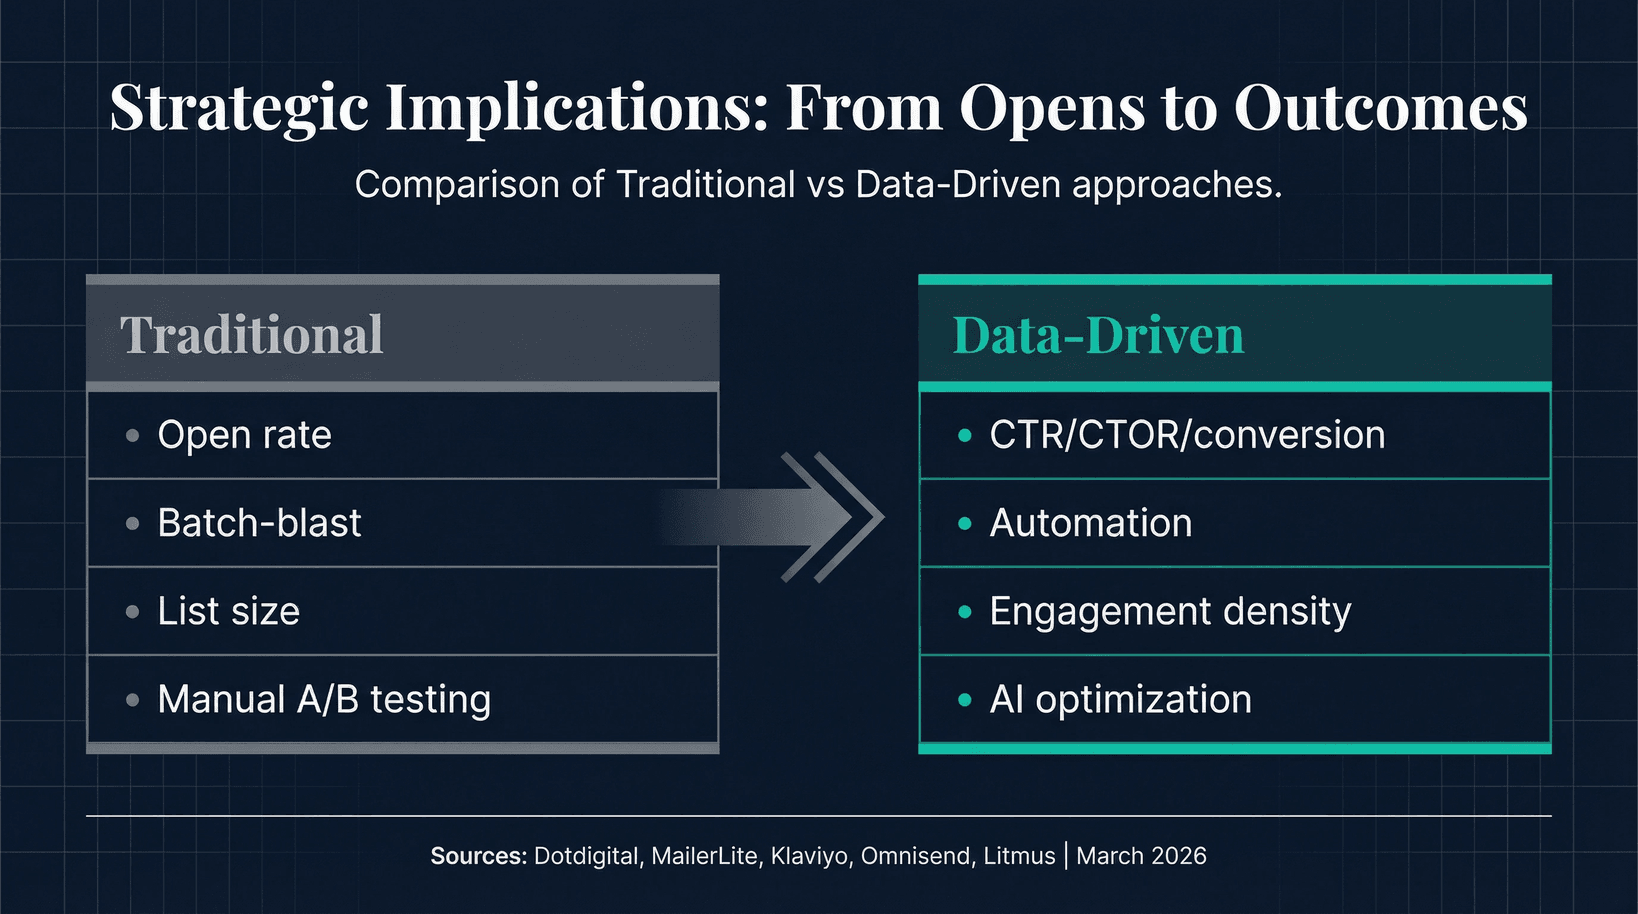
- Open rates are less reliable. Focus on clicks, conversions, and revenue.
- List hygiene and consent are non-negotiable. Clean lists and clear opt-ins are now a deliverability requirement, not just a best practice.
- First-party measurement is key. Rely on metrics you can trust—like clicks and purchases.
The Role of AI and Automation
- AI adoption is surging: 34% of marketers already use AI for copywriting at least occasionally (Litmus State of Email 2025), and Litmus' AI guidance for 2026 highlights operations teams targeting majority-AI workflows by year-end.
- AI helps with:
- Personalization at scale
- Dynamic content and send-time optimization
- Automated reporting and benchmarking
But remember: AI is a tool, not a silver bullet. The real gains come from using AI to iterate faster and make smarter decisions based on clicks, conversions, and revenue—not just opens.
Using Thunderbit for Data-Driven Email Marketing: Smarter Benchmarking and Reporting
Automate benchmark tracking with Thunderbit Get Started Free
Here’s where I get really excited. As someone who’s spent years wrangling data and building automation tools, I know firsthand how painful it can be to keep up with ever-changing benchmarks and performance metrics. That’s why I’m a big believer in using Thunderbit to automate the grunt work of data collection and reporting.
How Thunderbit Helps
- AI-powered data extraction: Scrape benchmark tables and performance data from any website—no coding required.
- Dynamic reporting: Export your data directly to Excel, Google Sheets, Airtable, or Notion for real-time tracking and comparison.
- Automated updates: Set up scheduled scrapes to keep your benchmarks fresh without manual effort.
- Custom benchmarking: Build your own industry or competitor benchmarks by extracting data from multiple sources and merging them into a single dashboard.
Real-World Example
Let’s say you want to track how your open and click rates compare to the latest industry benchmarks every month. With Thunderbit, you can:
- Scrape the latest benchmark tables from sources like Dotdigital, MailerLite, or Mailchimp.
- Export the data to your favorite spreadsheet or dashboard tool.
- Set up a recurring scrape to update your benchmarks automatically.
- Use Thunderbit’s AI to categorize, summarize, or even translate benchmark data for your team.
I’ve seen sales and marketing teams save hours every month—and make smarter, faster decisions—by letting Thunderbit handle the heavy lifting.
Want to see it in action? Download the Thunderbit Chrome Extension and try scraping a benchmark table from your favorite industry report. It’s honestly pretty fun (and way less tedious than copy-pasting numbers all day).
Download Thunderbit Chrome Extension
Key Takeaways: Email Marketing Statistics and Benchmarks for 2026
Let’s wrap up with the big lessons from all this data:
- Email is still a top performer: ROI remains sky-high, with many marketers seeing $36–$50+ for every $1 spent (Litmus).
- Benchmarks are your compass: Use them to spot gaps, set goals, and drive continuous improvement.
- Open rates are evolving: Privacy changes mean opens are less reliable—focus on clicks, conversions, and revenue.
- Automation is a game-changer: Automated flows drive higher click and conversion rates, and AI is making it easier to personalize and optimize at scale.
- List health is critical: Keep your bounce and unsubscribe rates low to protect deliverability and reputation.
- Data-driven tools like Thunderbit put you ahead: Automate your benchmarking and reporting to stay agile and informed.
If you want to go from “guessing” to “knowing” in your email marketing, now’s the time to embrace data-driven strategies and smarter tools.
FAQs on Email Marketing Benchmarks and Statistics
1. Why did our open rate jump but clicks didn’t?
Because privacy protections (like Apple Mail Privacy Protection) can inflate opens without reflecting real engagement. Focus on clicks and conversions for a more accurate picture (Litmus).
2. What’s the difference between CTR and CTOR?
CTR measures clicks per delivered email; CTOR measures clicks per open. CTOR tells you how compelling your content is to those who actually open your email (Dotdigital).
3. What unsubscribe rate is “normal” in 2026?
A global average is 0.14% (Dotdigital), but it can range from 0.12% to 0.22% depending on your platform and industry.
4. What should we watch now that Gmail and Yahoo changed the rules?
Make sure you have SPF, DKIM, and DMARC set up, support one-click unsubscribe, and keep your spam complaint rate below 0.1%.
5. How can I keep my email benchmarks up to date?
Use tools like Thunderbit to scrape and aggregate the latest benchmark data from trusted sources, and set up automated reports for ongoing tracking.
Further Reading & Resources
- Dotdigital Global Benchmark Report: The go-to for global and regional email benchmarks.
- MailerLite Industry Benchmarks: Detailed industry-by-industry breakdowns.
- Mailchimp Email Marketing Benchmarks: Quick stats for a second opinion.
- Litmus Email ROI and Trends: Deep dives on ROI, privacy, and AI trends.
- Omnisend Digital Marketing Statistics: Revenue and conversion insights for ecommerce.
- Klaviyo Email Benchmarks: Campaign vs. automation performance.
- Thunderbit Blog: Guides on data extraction, benchmarking, and web automation.
- Thunderbit Chrome Extension: Try scraping benchmark tables yourself.
- How to Scrape Website Data into Excel using AI
- How to Scrape Any Website Using AI
If you’re ready to level up your email marketing with real-time data and smarter benchmarks, give Thunderbit a spin. And if you have questions, drop them in the comments or check out the Thunderbit Blog for more tips and tutorials.
Happy emailing—and may your clicks, conversions, and ROI be higher than ever in 2026.
Try Thunderbit for smarter benchmarking Get Started Free