If you’ve ever spent a late night staring at your store’s analytics dashboard, wondering why your conversion rate isn’t budging, you’re not alone. In 2026, the average ecommerce conversion rate is hovering just under 2% globally—but here’s the kicker: the top-performing stores are pulling in rates three or even four times higher.
The gap between “average” and “best-in-class” has never been wider, and the pressure to optimize is only getting more intense as digital ad spend smashes through the $1 trillion mark for the first time (Dentsu).
But what do these averages actually tell us? And more importantly, how can you move beyond the “just okay” crowd and join the ranks of the top performers? As someone who’s spent years in SaaS, automation, and AI (and who’s helped build Thunderbit), I’ve seen firsthand that the real magic happens when you treat averages as a starting line—not the finish.
Let’s dig into the latest ecommerce conversion statistics for 2026, unpack the trends, and talk about how you can use smarter data (and a few secret weapons) to turn browsers into buyers.
Try Thunderbit Free to Build a Data-Driven Conversion Funnel
Ecommerce Conversion Statistics at a Glance: 2026’s Headline Numbers
Let’s start with the big picture. Here are the most important ecommerce conversion stats you need to know for 2026:
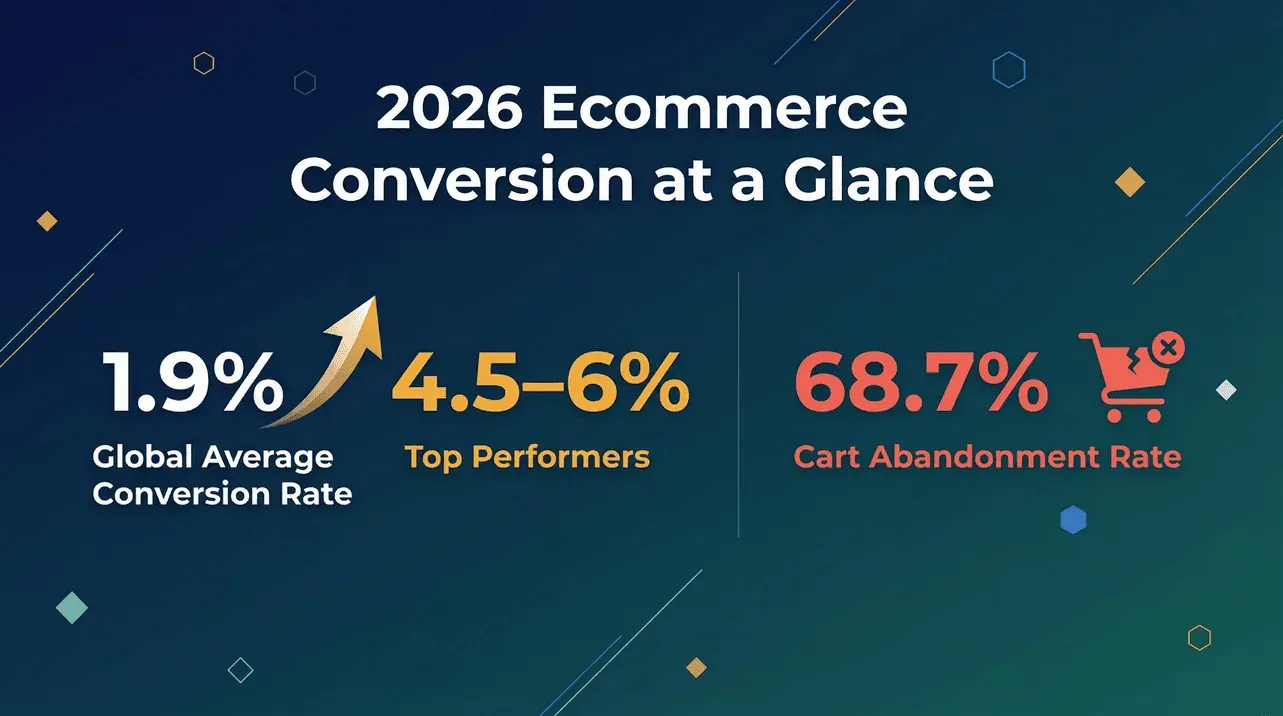
- Global average ecommerce conversion rate: 1.9% (down slightly from 2.1% in 2025)
- Top-performing ecommerce stores: 4.5%–6% conversion rates—over 3x the global average (Ruler Analytics)
- Mobile conversion rate (global): 1.2% (still lagging behind desktop)
- Desktop conversion rate (global): 2.6%
- Tablet conversion rate: 1.8%
- Average cart abandonment rate: 68.7% (Statista)
- Add-to-cart rate: 7.1%
- Checkout completion rate: 28.4%
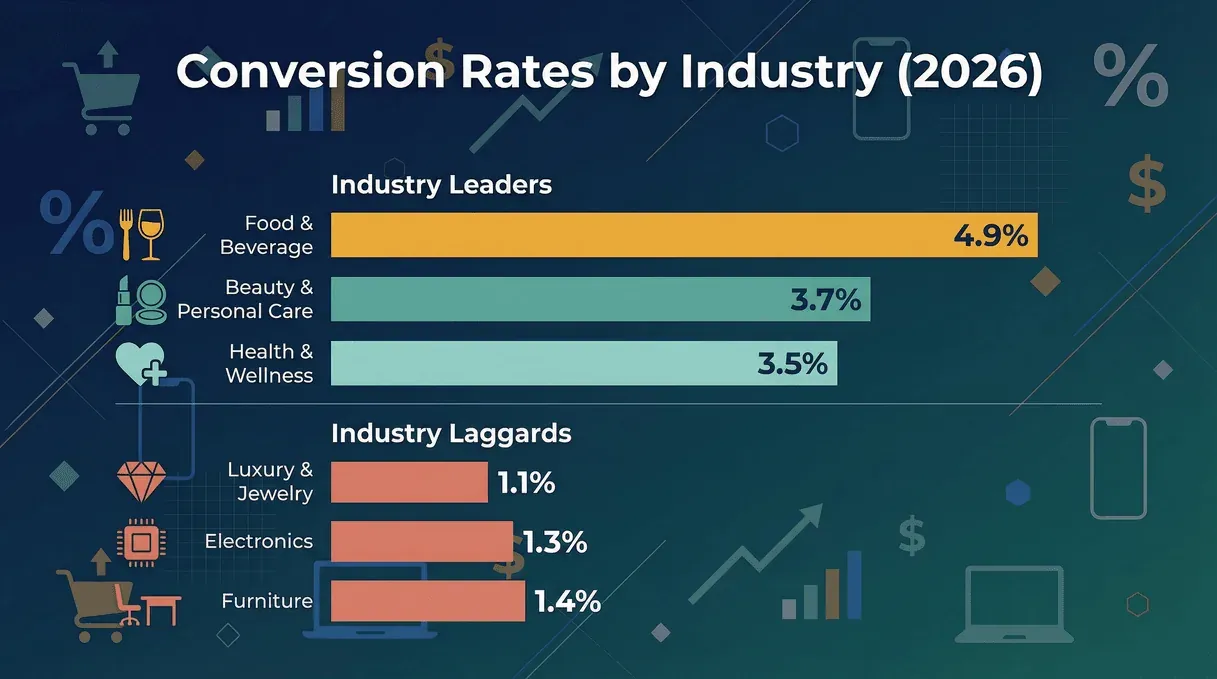
- Industry highs: Food & beverage (4.9%), beauty (3.7%), health (3.5%)
- Industry lows: Luxury (1.1%), electronics (1.3%), furniture (1.4%)
- Regional highs: North America (2.2%), Western Europe (2.0%)
- Regional lows: Asia-Pacific (1.5%), Latin America (1.3%)
Here’s a quick table for easy reference:
| Metric | 2026 Benchmark |
|---|---|
| Global Conversion Rate (All Devices) | 1.9% |
| Desktop Conversion Rate | 2.6% |
| Mobile Conversion Rate | 1.2% |
| Tablet Conversion Rate | 1.8% |
| Cart Abandonment Rate | 68.7% |
| Add-to-Cart Rate | 7.1% |
| Checkout Completion Rate | 28.4% |
What jumps out? The “average” is just that—a midpoint in a wildly varied landscape. And with competition (and ad spend) at all-time highs, the cost of staying average is steeper than ever.
Benchmark Breakdown: Average Ecommerce Conversion Rates by Industry
Not all ecommerce categories are created equal. Some industries see sky-high conversion rates, while others struggle to get even 1% of visitors to buy. Here’s how the numbers shake out for 2026 (Ruler Analytics):
| Industry | Average Conversion Rate (2026) |
|---|---|
| Food & Beverage | 4.9% |
| Beauty & Personal Care | 3.7% |
| Health & Wellness | 3.5% |
| Fashion & Apparel | 2.3% |
| Home & Garden | 2.0% |
| Electronics | 1.3% |
| Furniture | 1.4% |
| Luxury & Jewelry | 1.1% |
Why the gap? Repeat-purchase categories (like food, beauty, and health) tend to outperform big-ticket, infrequent-purchase sectors (like furniture and luxury). Trust, urgency, and ease of checkout also play a role. If you’re in a “low” category, don’t panic—but do benchmark against your own segment, not just the global average.
Device Matters: Conversion Rate Benchmarks by Desktop, Mobile, and Tablet
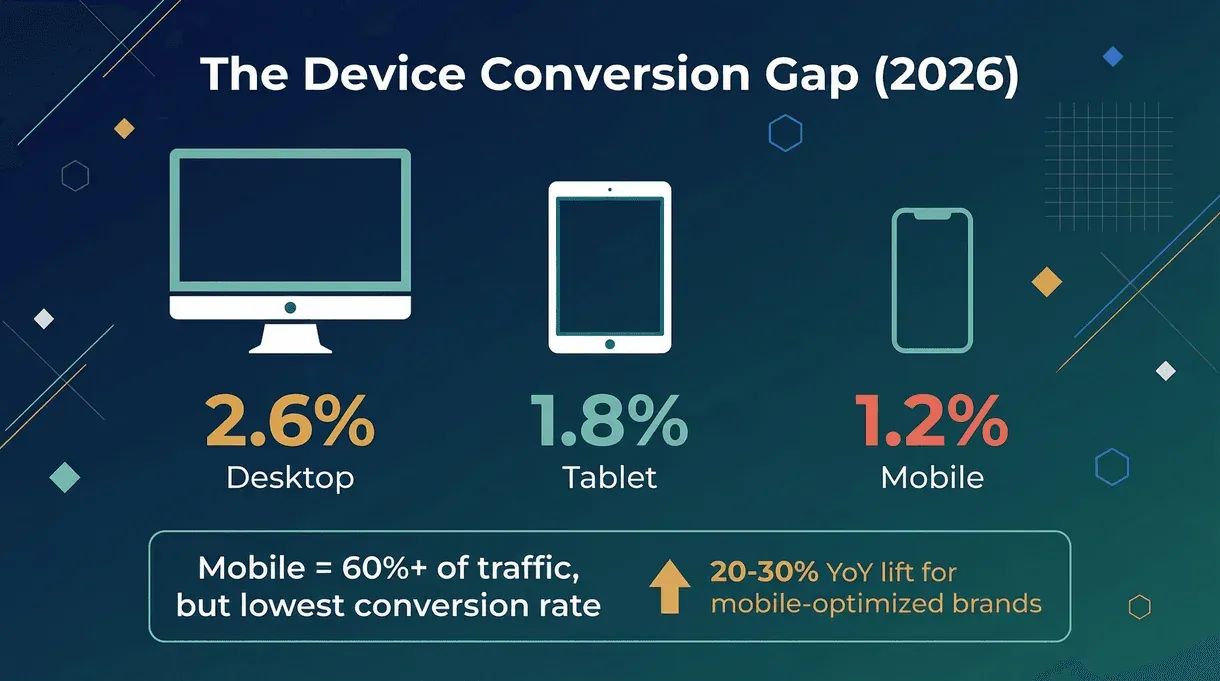
The mobile revolution is real, but so is the mobile conversion gap. In 2026, desktop still leads the pack for conversion rates:
- Desktop: 2.6%
- Mobile: 1.2%
- Tablet: 1.8%
Despite mobile accounting for over 60% of ecommerce traffic, it still lags in conversions. Why? Smaller screens, clunky checkout flows, and distracted shoppers all play a part. But here’s the opportunity: brands that invest in mobile optimization (think one-click checkout, autofill, and personalized offers) are closing the gap and seeing conversion lifts of 20–30% year-over-year (Salesforce).
Regional Insights: Ecommerce Conversion Rates Around the World
Conversion rates aren’t just about what you sell—they’re also about where you sell. Here’s how 2026 shapes up by region (Dentsu, MailerLite):
| Region | Average Conversion Rate (2026) |
|---|---|
| North America | 2.2% |
| Western Europe | 2.0% |
| Asia-Pacific | 1.5% |
| Latin America | 1.3% |
| Middle East/Africa | 1.2% |
What’s driving the differences? Economic conditions, consumer trust, payment preferences, and mobile adoption all play a role. For example, North America’s higher rates are often tied to mature logistics and payment systems, while Asia-Pacific’s rapid mobile growth hasn’t yet translated into higher conversions—though that’s changing fast.
Traffic Sources: Where Do the Best Ecommerce Conversion Rates Come From?
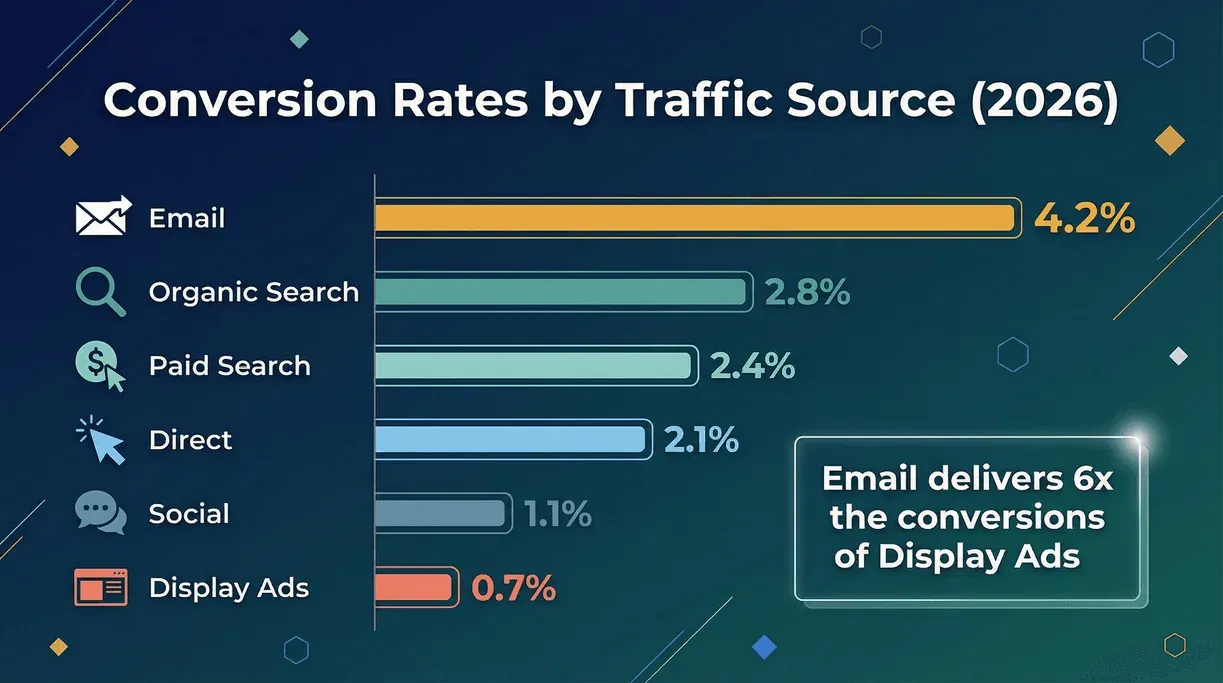 Not all traffic is created equal. Here’s how conversion rates break down by channel in 2026 (WordStream, MailerLite):
| Traffic Source | Conversion Rate (2026) |
|---|---|
| 4.2% | |
| Organic Search | 2.8% |
| Paid Search | 2.4% |
| Direct | 2.1% |
| Social | 1.1% |
| Display Ads | 0.7% |
Email remains the king of conversions, despite all the noise about social and display. But beware: privacy changes (like Apple’s Mail Privacy Protection) are inflating open rates, so clicks and downstream conversions are the real metrics to watch (MailerLite). Organic search and paid search still deliver strong results, but social and display are best for top-of-funnel awareness—not last-click conversions.
Beyond the Average: Why “Average Ecommerce Conversion Rates” Are Just the Starting Line
Here’s the truth nobody likes to admit: “average” is a moving target, and it’s rarely the right goal. Conversion rates can swing wildly based on:
- Business model: Subscription vs. one-off purchase, B2B vs. B2C, DTC vs. marketplace
- Lifecycle stage: New stores vs. established brands
- Country: Payment methods, trust, and logistics all matter
- Device: As we saw, mobile and desktop are worlds apart
- Traffic source: Email vs. social vs. paid search
Treating the average as your finish line is like running a marathon just to get a participation medal. The real winners are the ones who dig into their own data, segment by segment, and find the levers that move their customers.
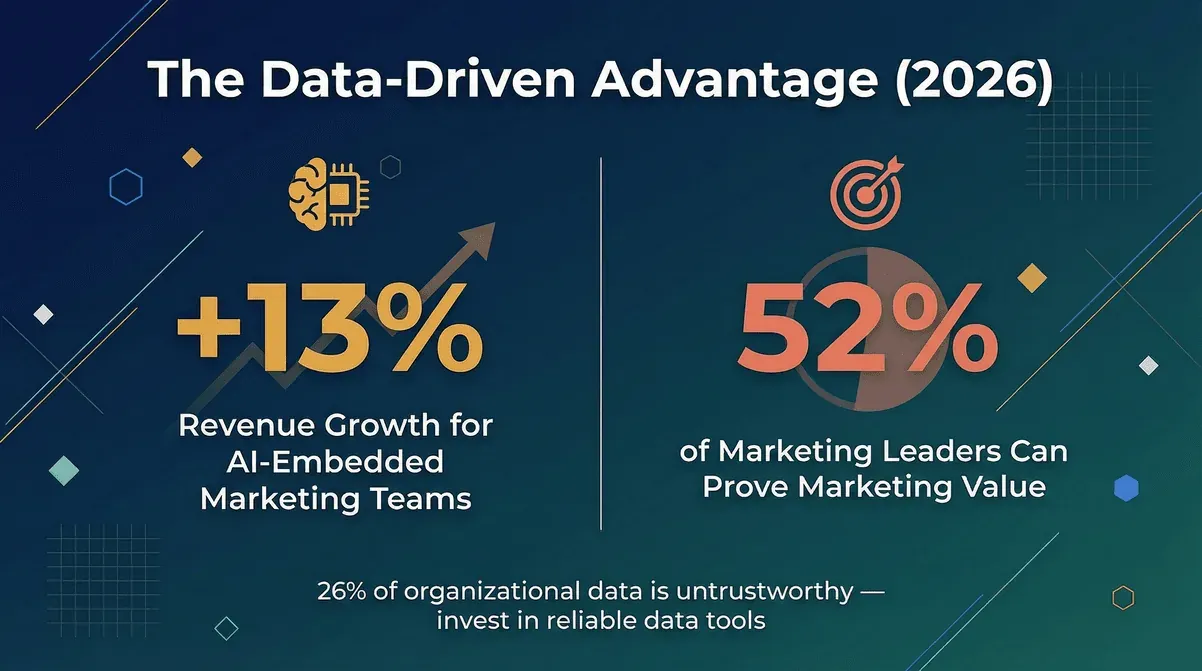
And here’s a fun fact: in 2026, only 52% of senior marketing leaders say they can prove marketing’s value. That means nearly half are still flying blind, chasing averages instead of building their own benchmarks.
How Thunderbit Fits into an Ecommerce Conversion Workflow
Scrape and structure ecommerce data with AI Get Started Free
I'll be upfront about what Thunderbit is and isn't. It's an AI web scraper, not a session-replay or on-site analytics tool. It won't tell you what a specific shopper did inside your checkout — that's what Hotjar, FullStory, or your own GA4 funnel report is for. What Thunderbit does well is pull structured data off pages you point it at, fast, without writing selectors.
Here's where that's useful for someone working on ecommerce conversion:
- Competitor pricing and shipping monitoring. Run Thunderbit weekly against your top 5–10 competitors' product and checkout pages. Price gaps and shipping-fee differences are two of the most common conversion blockers, and you want them in a spreadsheet, not a screenshot folder.
- Review and Q&A scraping at scale. Pull reviews off Amazon, Trustpilot, G2, or your own product pages into a sheet, then run them through whatever sentiment / topic tool you already use. The scraping is the part that usually takes a person a day; Thunderbit shortens that to minutes.
- Benchmark and stat collection. When you're putting together a CRO deck and need 30+ data points from analyst blogs, you can have Thunderbit pull tables and quotes into Sheets in one pass instead of copy-pasting.
- Export to where your team already works. Google Sheets, Notion, Airtable, Excel, CSV — no manual cleanup of the output.
What Thunderbit won't replace: GA4, your A/B testing tool, Hotjar/Microsoft Clarity, or your CDP. Treat it as the "get the external data in" layer of a CRO stack, not the whole stack.
How Ecommerce Teams Actually Use Thunderbit Alongside Their CRO Stack
Practical workflows I've seen work:
- Pre-test research. Before you A/B test a new checkout, scrape the equivalent flow on three competitors and two cross-industry benchmarks (e.g., a DTC brand you admire). Build a comparison sheet of fields collected, payment options, shipping disclosure timing. You'll usually find one or two changes worth testing before you ever touch your own code.
- Review-driven friction discovery. Pull the last 500 reviews and support-forum posts for your product (or your top SKUs), export to Sheets, then have your LLM of choice tag them by complaint type. The phrase "shipping cost" or "return" appearing 80 times is a CRO hypothesis you can act on.
- Unstructured data mining. Not all signals come from neat tables. Thunderbit can pull reviews, forum threads, or comparison-blog mentions into structured rows so you can spot recurring conversion blockers you'd otherwise miss.
- Continuous monitoring. Schedule a weekly run against competitor pricing pages, promo banners, or "free shipping threshold" messaging. Trends in your category show up before they show up in your analytics.
A simple loop: scrape external signals → tag and analyze → form hypothesis → A/B test on your own site → measure in your analytics tool. Thunderbit only owns the first step. It just makes that step faster.
Data-Driven Ecommerce: Moving Beyond "Gut Feel" with Better External Data
Learn what data scraping is (and why it matters) Get Started Free
"Data-driven" only works if the data feeding your decisions is fresh and external as well as internal. Most ecommerce teams have GA4 and a checkout funnel report — far fewer have an ongoing read on competitor pricing, review sentiment, or category benchmark shifts. That gap is where Thunderbit fits in.
- Scheduled scrapes. Set Thunderbit to pull competitor pricing pages, promo banners, or review feeds on a weekly cadence. You see category-level changes when they happen, not in next quarter's review.
- AI extraction. Point Thunderbit at a page and describe the columns you want — it figures out the selectors. Useful when you're collecting data from dozens of layouts that won't share a template.
- No-code. A CRO manager or growth marketer can run this without engineering help. If you can describe the columns you want in a sheet, you can use Thunderbit.
And the ROI is real: marketers who embed AI into their strategy (not just task automation) report 13% higher revenue growth and 13% cost savings on average.
Key Takeaways: What 2026 Ecommerce Conversion Statistics Mean for Your Business
Let’s wrap up with the most important lessons from the 2026 data—and what you should do next:
- Averages are just the beginning. Use them as a baseline, but build your own benchmarks by segment, device, and channel.
- Mobile is still an opportunity. The conversion gap is real, but brands that invest in mobile UX and checkout are seeing big gains.
- Personalization and segmentation win. The best conversion rates come from teams who know their customers inside and out—and act on those insights.
- Data quality matters. A meaningful share of organizational data is stale, duplicate, or wrong — and conversion decisions made on top of bad data tend to be wrong in expensive ways. Invest in tools that help you collect, clean, and act on reliable data.
- Continuous optimization beats one-off fixes. The best teams are always testing, learning, and improving—not just reacting to last month’s numbers.
If you’re ready to move beyond “average,” Thunderbit is here to help you build a smarter, more profitable ecommerce operation. And if you want to see how easy it is to get started, download our Chrome Extension or check out our YouTube channel for step-by-step guides.
Explore Thunderbit for Ecommerce Conversion Optimization
Sources & Further Reading
- Dentsu: Global Ad Spend Forecast 2026
- IAB: 2026 U.S. Ad Spend Outlook
- EMARKETER: Worldwide B2B Digital Ad Spend 2026
- Gartner: CMO Spend Survey
- MailerLite: Email Benchmarks 2025/2026
- WordStream: PPC Benchmarks by Industry
- Ruler Analytics: Conversion Rate by Industry
- Salesforce: Data Analytics Trends 2026
- Thunderbit Blog
For more hands-on tips and advanced strategies, check out What Is Data Scraping and How to Do It in 2025 and How to Scrape Website Data into Excel using AI.
FAQs
1. What is a good ecommerce conversion rate in 2026? Published benchmarks for the global ecommerce conversion rate cluster between roughly 1.5% and 3% depending on whose dataset you trust, with top-decile stores in repeat-purchase categories (food, beauty, health) pushing 4–6%. The honest answer: compare yourself against your own industry, device mix, and traffic source rather than the global average.
2. Why is my mobile conversion rate lower than desktop?
Mobile conversion rates (1.2%) lag behind desktop (2.6%) due to smaller screens, checkout friction, and distracted browsing. Investing in mobile UX, autofill, and faster checkout can help close the gap.
3. How can Thunderbit help improve my ecommerce conversion rate?
Thunderbit lets you collect granular user behavior data, run emotion analysis, and segment users for personalized recommendations. This helps you spot friction points, test improvements, and optimize your funnel in real time.
4. Are averages useful for benchmarking my store?
Averages are a helpful starting point, but they don’t tell the whole story. Segment your data by device, channel, and customer type to find your own benchmarks—and focus on continuous improvement.
5. What’s the best traffic source for ecommerce conversions?
Email leads the pack with a 4.2% conversion rate, followed by organic search (2.8%) and paid search (2.4%). Social and display are best for brand awareness, not direct conversions.
Ready to move beyond the average? Try Thunderbit for free and start building your own data-driven conversion engine today. And for more insights, don’t forget to visit the Thunderbit Blog.
Try Thunderbit to Turn More Browsers Into Buyers Get Started Free