
Executive Summary
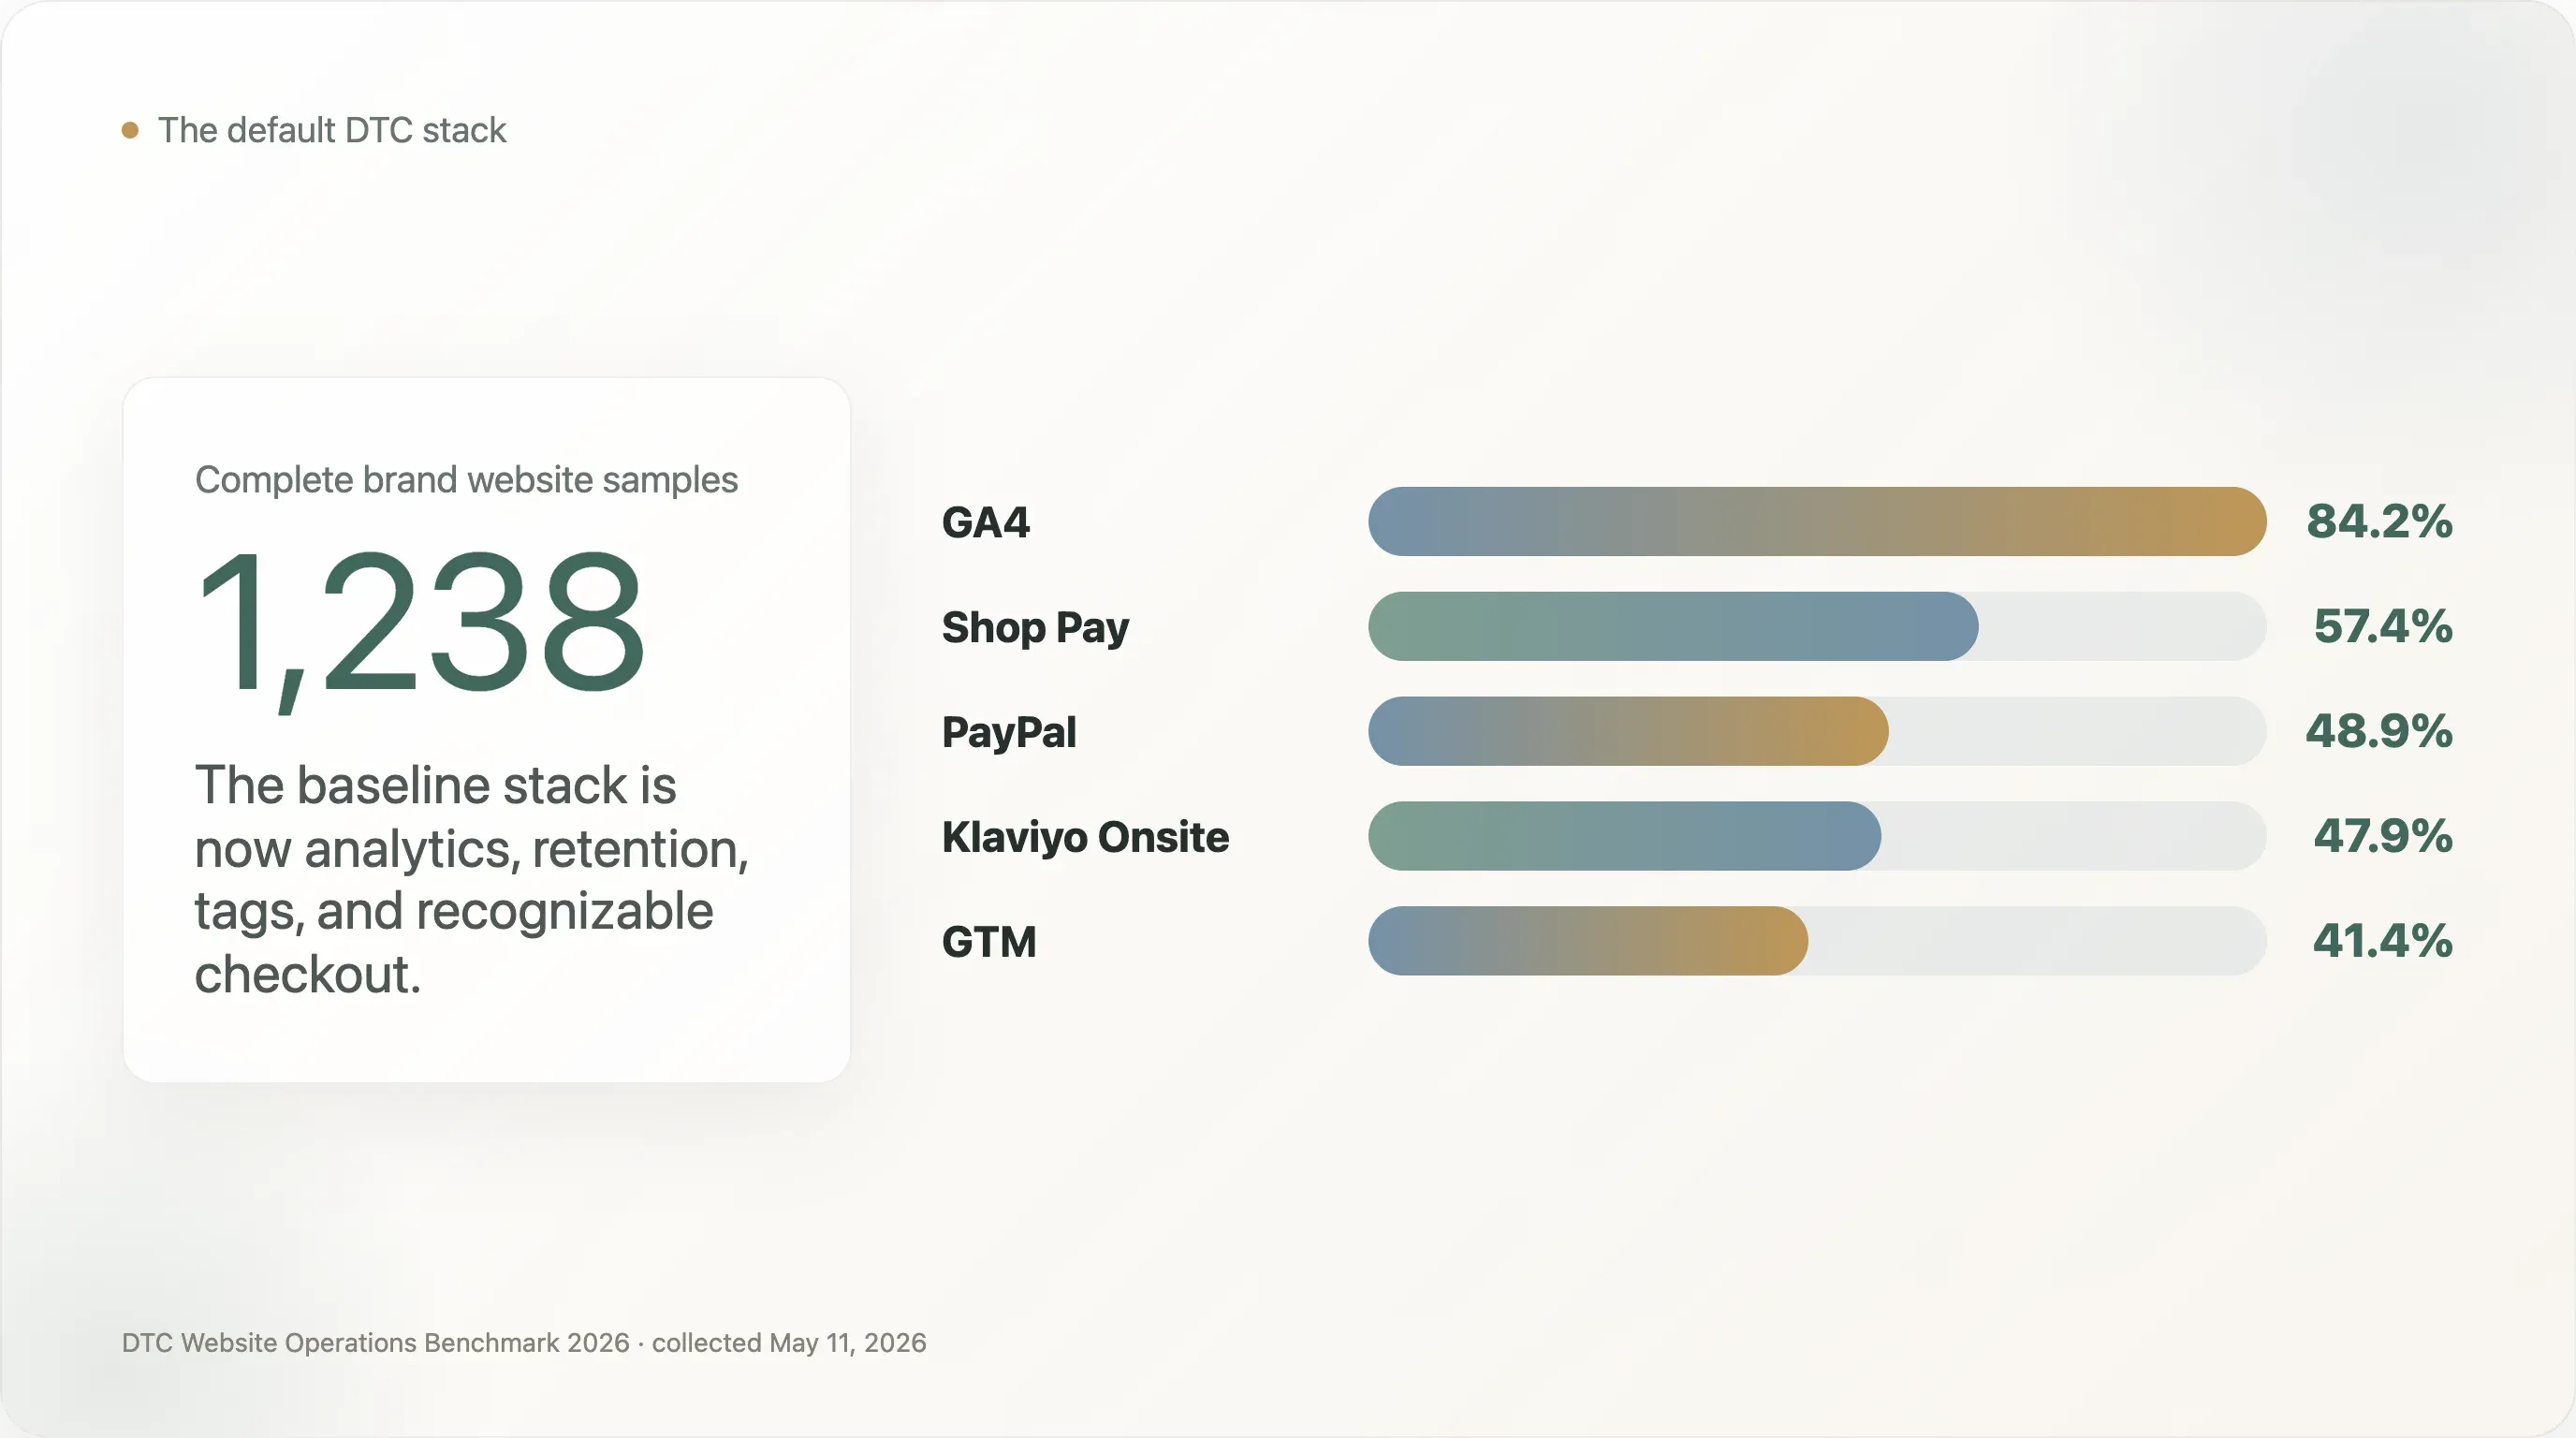
DTC operators talk about brand, community, creative, retention, and customer experience. Underneath all of that is a quieter reality: most modern DTC websites are now built on a surprisingly similar operating stack. In this study, we started with 1,597 candidate DTC brands, resolved 1,431 domains, and completed homepage-level analysis for 1,238 brand websites on May 11, 2026. The goal was not to rank brands. It was to answer a more useful operator question: when you inspect the public websites of brands visible in ecommerce tool ecosystems, what infrastructure patterns actually show up?
The clearest finding is that the bottom of the DTC operating stack has standardized. Google Analytics 4 appears on 84.2% of complete samples. Klaviyo Onsite appears on 47.9%. Google Tag Manager appears on 41.4%. On checkout, Shop Pay appears on 57.4% and PayPal on 48.9%. Among the 1,083 brands where at least one tool was detected, GA4 + Shop Pay co-occur in 65.6%, GA4 + PayPal in 56.0%, PayPal + Shop Pay in 55.6%, and GA4 + Klaviyo in 54.6%. For operators, the implication is blunt: the default DTC stack is no longer a strategic secret. It is table stakes.
That sameness is not the most interesting part. The interesting part is where sameness breaks. DTC websites look mature on basic analytics, checkout, and email infrastructure, but much less mature on AI-search readiness, structured product data, international SEO, performance governance, and the link between website traffic and owned social surfaces. These are the gaps that create useful benchmarks for ecommerce teams and useful angles for SEO writers, newsletters, and industry media.
The most counterintuitive AI-search finding is a split between passive and active readiness. llms.txt appears on 57.9% of complete samples, which sounds like broad AI-readiness adoption. But 50.8 percentage points of that comes from Shopify auto-generated files, while only 7.1% of brands have a manual llms.txt signal. At the same time, JSON-LD Product schema appears on only 0.9% of the 1,240 fetched homepage samples. That means many brands have a new AI-readable doorway because their platform gave it to them, but very few expose structured product-level facts in a way search engines and AI systems can reliably interpret.
The second counterintuitive finding is that tooling depth is not the main difference between more visible brands and the long tail. The head group in this sample, defined as brands appearing in at least three source collections, averages 4.5 detected analytics and marketing tools. The one-source tail group averages 4.1. That is a small gap. The bigger differences are in the specific maturity signals: advanced attribution, headless frontend adoption, behavior analytics, privacy compliance, and deliberate platform architecture.
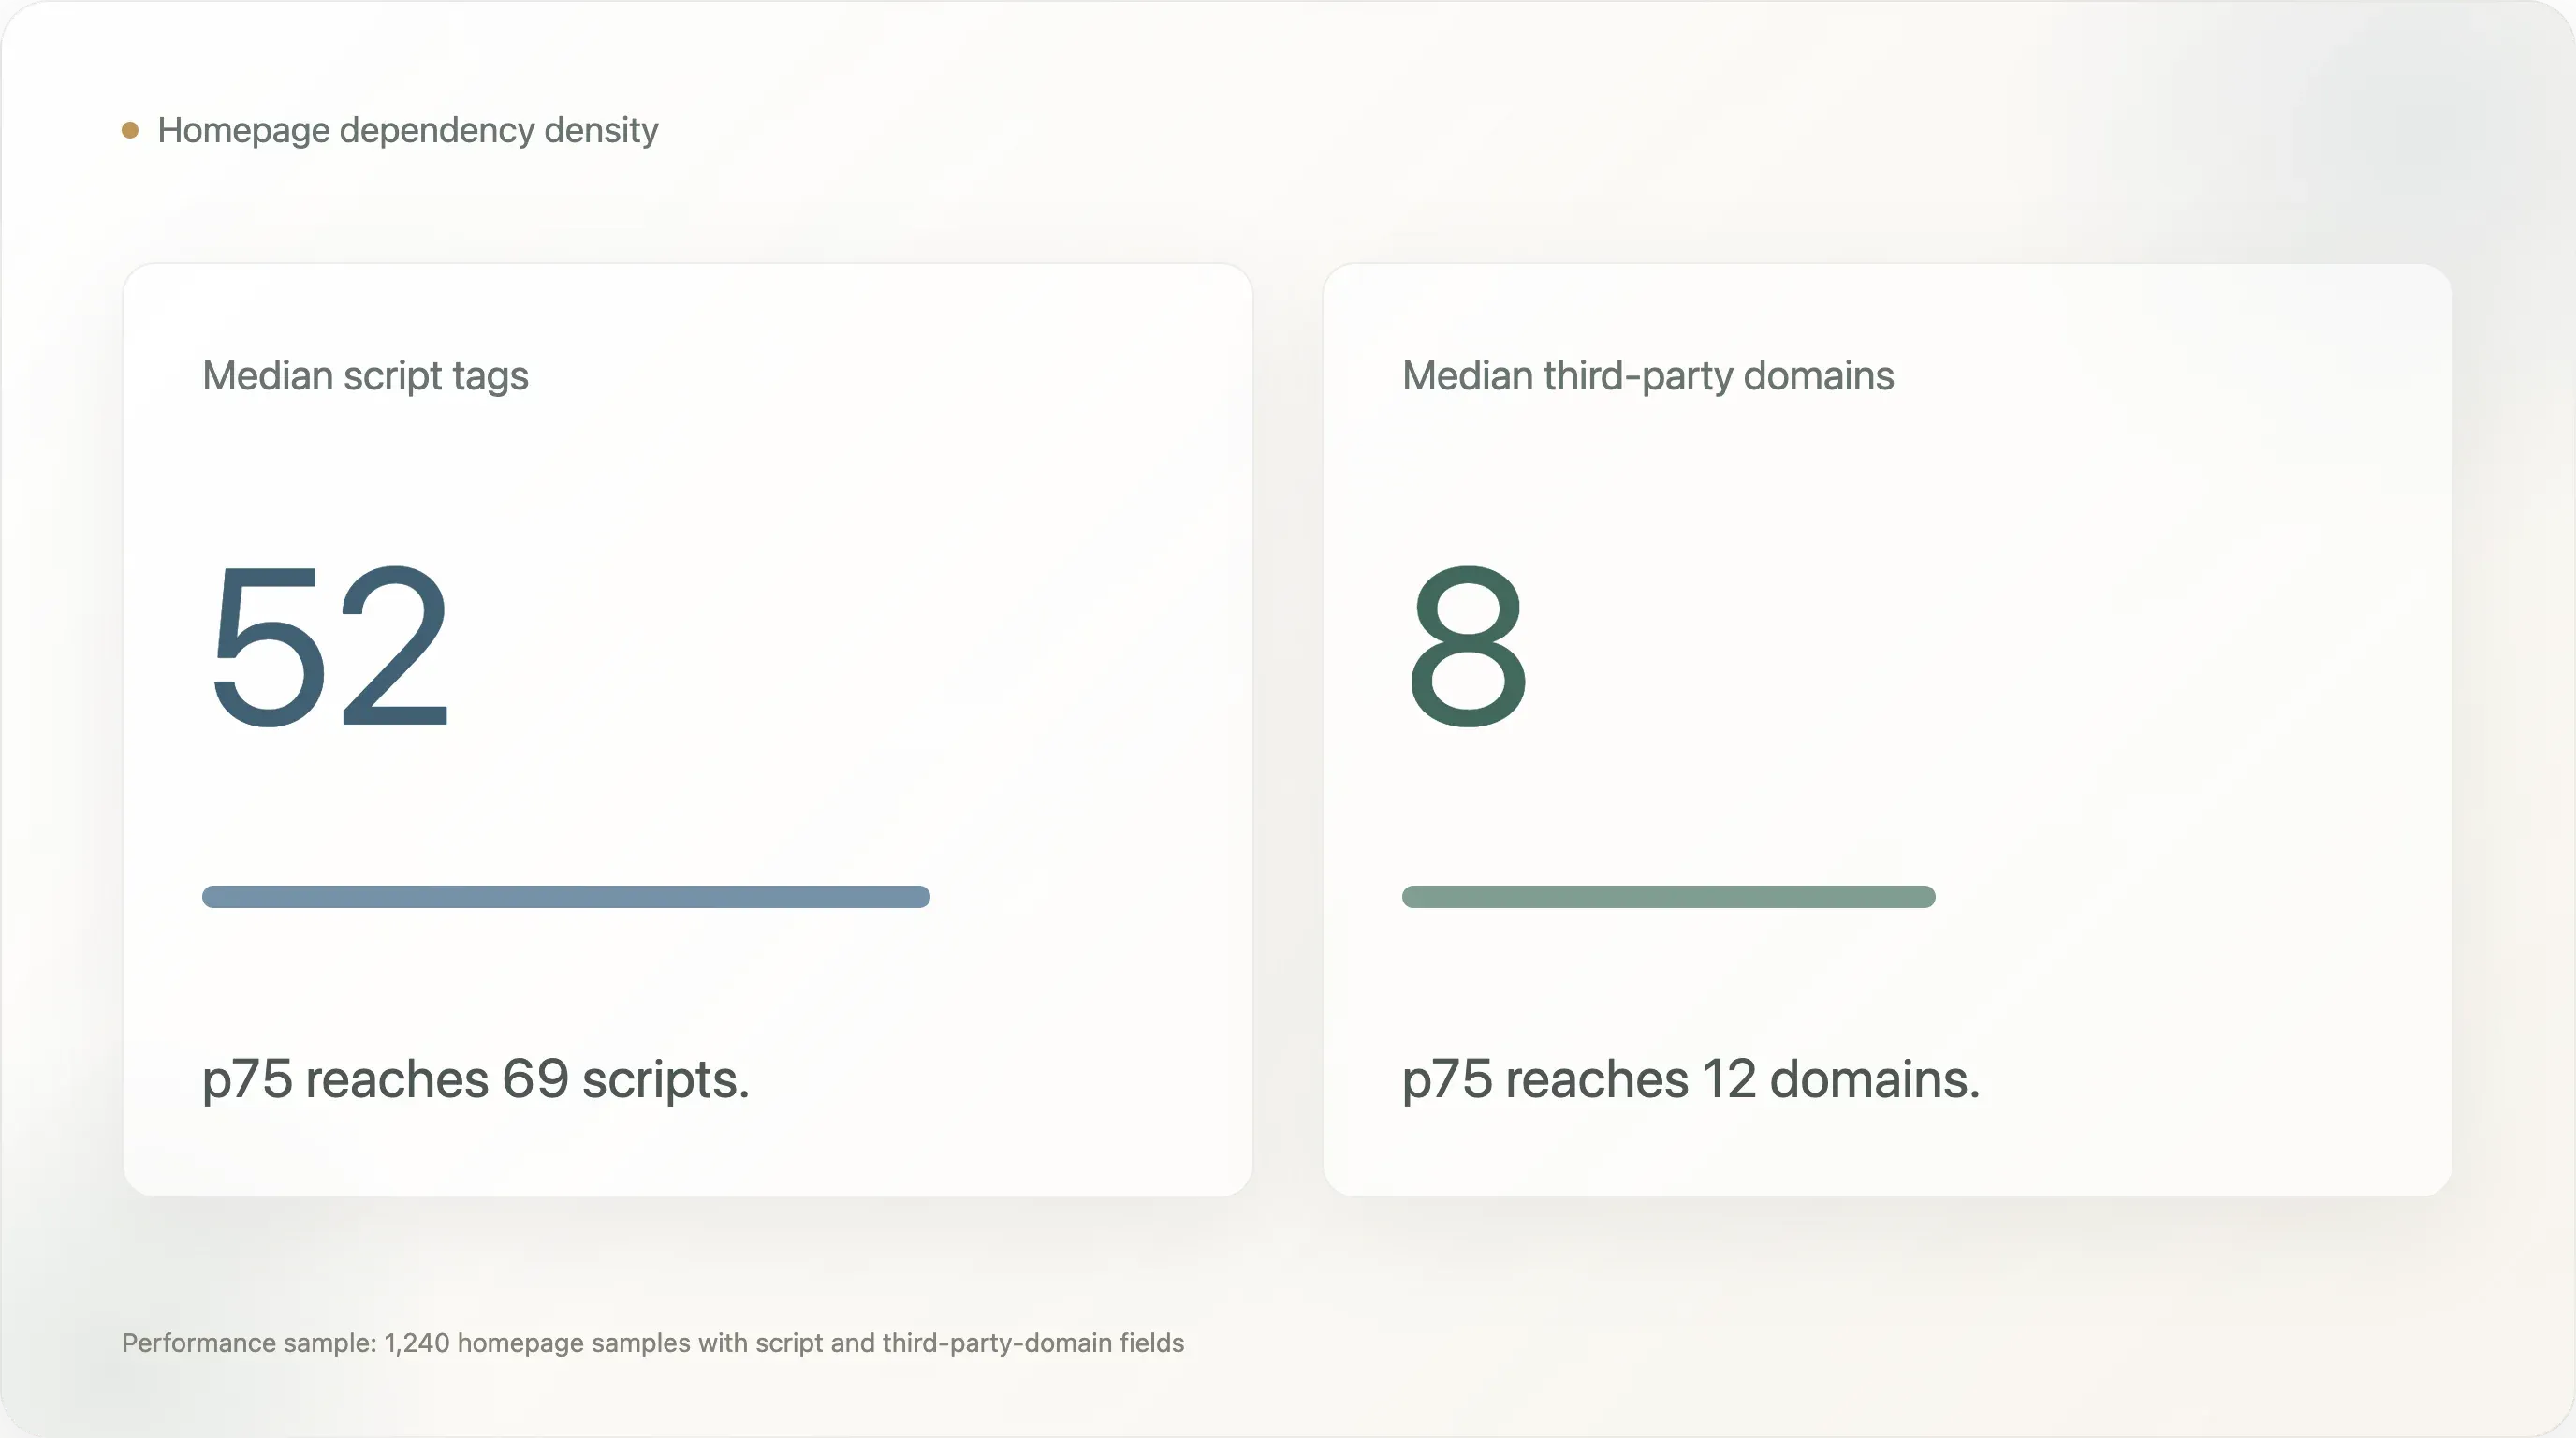
The third finding is that DTC websites are carrying real performance debt. In the 1,240 homepage samples where performance fields were available, the median homepage has 52 script tags and 8 third-party domains. The p75 values are 69 scripts and 12 third-party domains. The homepage byte-size field is capped by collection constraints and should not be used as a finding, but the script and third-party-domain counts are still useful indicators of dependency density. Many DTC teams have traded speed and simplicity for marketing visibility, attribution, personalization, consent, chat, support, pixels, and testing tools.
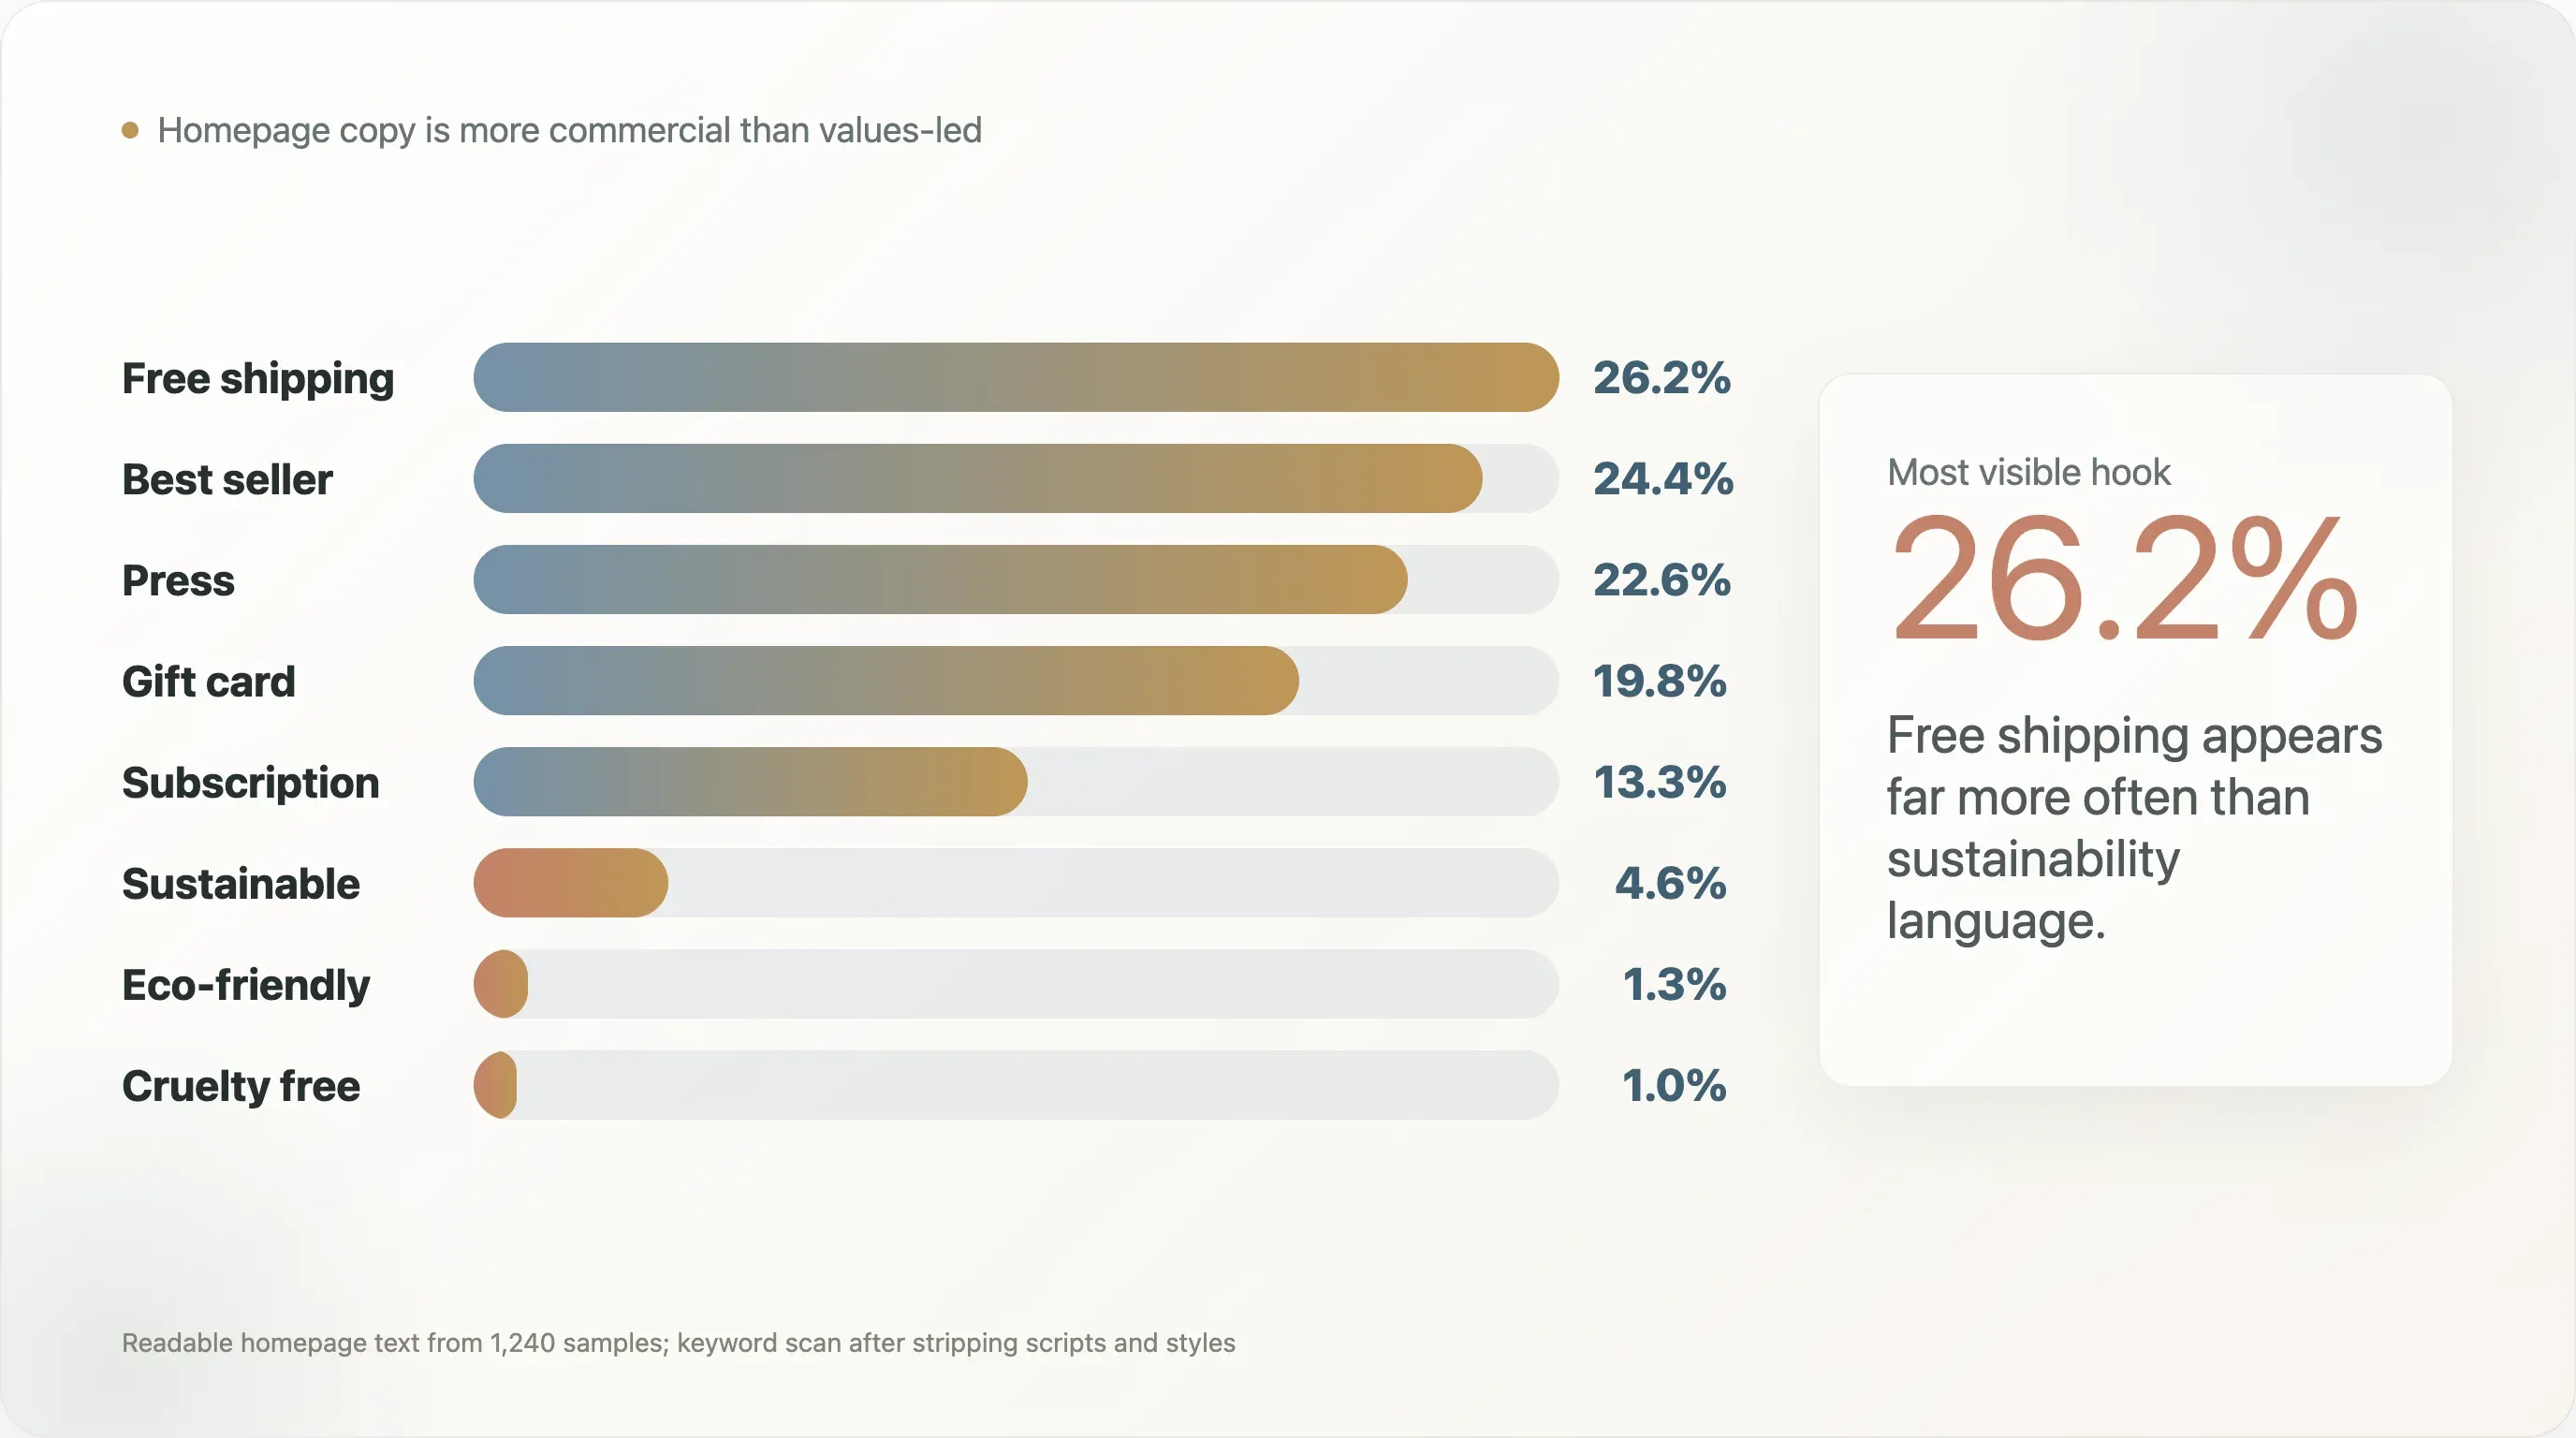
The fourth finding is that "green" DTC positioning is much less visible in homepage copy than industry conversation suggests. In readable homepage text from 1,240 samples, free shipping appears on 26.2%, best seller on 24.4%, and press or "as seen on" language on 22.6%. By contrast, sustainable appears on 4.6%, eco-friendly on 1.3%, and cruelty free on 1.0%. This does not prove brands are not sustainable. It shows that many brands are not making sustainability the public homepage conversion hook.
The fifth finding is social-adjacent but important for ecommerce operators: more than half of complete homepage samples had no visible links to the tracked social platforms in static homepage markup. That number has important caveats, because client-rendered footers and dynamic menus can be missed. Still, it is a useful operational prompt. If a brand invests in Instagram, TikTok, YouTube, Pinterest, or X, the official website should not make those destinations hard to find.
This report is written for three audiences. DTC and ecommerce teams can use it as an operating benchmark. SEO and ecommerce content creators can use the numbers as citation-ready original data, with the caveats intact. Industry writers can use it as a snapshot of where the DTC stack is becoming standardized and where the next round of competitive advantage may come from.
The Five Most Shareable Findings
-
DTC has a default stack now. In this sample, GA4, Klaviyo, Shop Pay, and PayPal form the practical baseline. The next advantage is not "installing tools"; it is governing data and running better experiments.
-
AI-readiness is mostly passive. llms.txt appears on 57.9% of complete samples, but most of that is platform-generated. Manual llms.txt appears on only 7.1%, and Product schema appears on only 0.9%.
-
The long tail has largely caught up on tool count. Head brands average 4.5 detected analytics and marketing tools, while tail brands average 4.1. The gap is not "how many tools"; it is "which maturity tools and how well they are used."
-
Many DTC homepages are heavy with dependencies. The median homepage in the performance sample has 52 script tags and 8 third-party domains. Marketing visibility has a speed cost.
-
Homepage copy is more commercial than values-led. "Free shipping" and "best seller" appear far more often than sustainability language. That is useful for content teams because it cuts against the way DTC often talks about itself.
1. Read the Sample Correctly
This report should not be read as a census of every DTC brand in the market. The starting brand pool came from public ecommerce and DTC sources where brands are likely to be visible: tool case-study libraries, Shopify ecosystem material, public DTC indexes, and related ecommerce lists. That creates a sample of brands that are discoverable through the ecommerce tool ecosystem, not a random market survey.
This matters most for platform interpretation. Shopify is overrepresented because many source lists are connected to Shopify ecosystem tools or ecommerce case studies. In the complete sample, Shopify appears on 789 of 1,238 websites, or 63.7%. That number is a description of this sample, not a claim about all DTC websites. It should not be cited as industry market share.
The same caution applies to any platform-specific conclusion. If a number is about a tool or platform that has a strong case-study ecosystem, it may be inflated by the way the brand pool was assembled. That is why this report focuses less on "Shopify dominates" and more on operational signals that are still useful inside the sample: tool co-occurrence, AI-readiness gaps, checkout patterns, schema gaps, social visibility, category patterns, and performance debt.
The report also measures public website signals, not internal operating quality. A brand may use a tool that is loaded after user consent, injected through a tag manager, hidden behind client-side rendering, or absent from the first 256KB of fetched HTML. Payment methods like Apple Pay and Google Pay are especially likely to be undercounted because they often load dynamically. Tool install rates should therefore be read as lower bounds.
That limitation does not make the data useless. It makes the data concrete. We are looking at what a public crawl can see from brand websites, the same kind of visibility surface available to search engines, AI crawlers, SEO tools, competitive intelligence tools, and many journalists doing fast desk research. For ecommerce and SEO teams, that public visibility layer is itself worth improving.
2. The Default DTC Stack Is Here
Across the 1,238 complete samples, the average site has 3.39 detected analytics and marketing tools, with a median of 3. That number covers the detected analytics and marketing field, not every operational layer on the site. Once checkout and payment signals are included, the practical DTC operating baseline becomes larger: analytics, retention, tag coordination, one-click checkout, and at least one familiar wallet or payment method.
The top detected tools show the shape of the modern DTC baseline:
| Tool | Complete sample coverage |
|---|---|
| Google Analytics 4 | 84.2% |
| Klaviyo Onsite | 47.9% |
| Google Tag Manager | 41.4% |
| Microsoft Clarity | 20.6% |
| Gorgias | 19.1% |
| Triple Whale | 15.3% |
| Bing UET | 11.7% |
| Cookiebot / OneTrust | 9.6% |
| Rebuy | 9.0% |
| Attentive | 8.9% |
The operator story is straightforward. GA4 is now basic instrumentation. Klaviyo is the DTC retention layer. GTM is the coordination layer for pixels and tags. Microsoft Clarity, Gorgias, Triple Whale, Cookiebot, Rebuy, and Attentive are not universal, but they indicate different forms of operating maturity: behavior analytics, customer support, attribution, consent, upsell, and SMS.
The most useful benchmark is not a single install rate. It is the co-occurrence pattern. Among 1,083 brands with at least one detected tool, the most common pairs are:
| Pair | Co-occurrence |
|---|---|
| GA4 + Shop Pay | 65.6% |
| GA4 + PayPal | 56.0% |
| PayPal + Shop Pay | 55.6% |
| GA4 + Klaviyo Onsite | 54.6% |
| Klaviyo Onsite + Shop Pay | 51.2% |
| GA4 + Google Tag Manager | 44.9% |
| Klaviyo Onsite + PayPal | 44.1% |
This is the clearest evidence for a default DTC stack: analytics, retention, one-click checkout, and a familiar wallet option. For a new DTC operator, that is useful because it reduces uncertainty. The first job is not to invent an exotic stack. The first job is to get the baseline working cleanly, with accurate events, consent-aware tracking, a working email/SMS capture path, and a checkout flow that customers already recognize.
For tool vendors and SaaS operators, this creates a harder market. A new tool cannot win just by claiming feature breadth. The baseline is already crowded, and the leading tools are embedded in workflows. The opening is in solving problems the baseline stack does not solve well: better attribution under privacy constraints, better lifecycle testing, cleaner cross-channel identity, better post-purchase upsell, better returns intelligence, or lower-friction international compliance.
Brand examples make the pattern more concrete. In the crawl, brands such as Beekman 1802, Princess Polly, Fresh Clean Threads, and Rare Beauty show relatively mature detected stacks that combine analytics, retention, support, consent, attribution, or customer-experience tools. The point is not that every brand should copy every tool. The point is that mature DTC operations often layer specialized tools on top of the same baseline rather than replacing the baseline entirely.
3. The AI-Search Gap: llms.txt Is Everywhere, Product Schema Is Almost Nowhere
The most citation-worthy finding in the report is the mismatch between llms.txt and structured product data.
In the complete website sample, 717 brands have llms.txt, or 57.9%. At first glance, that looks like rapid DTC adoption of AI-search practices. But the breakdown matters:
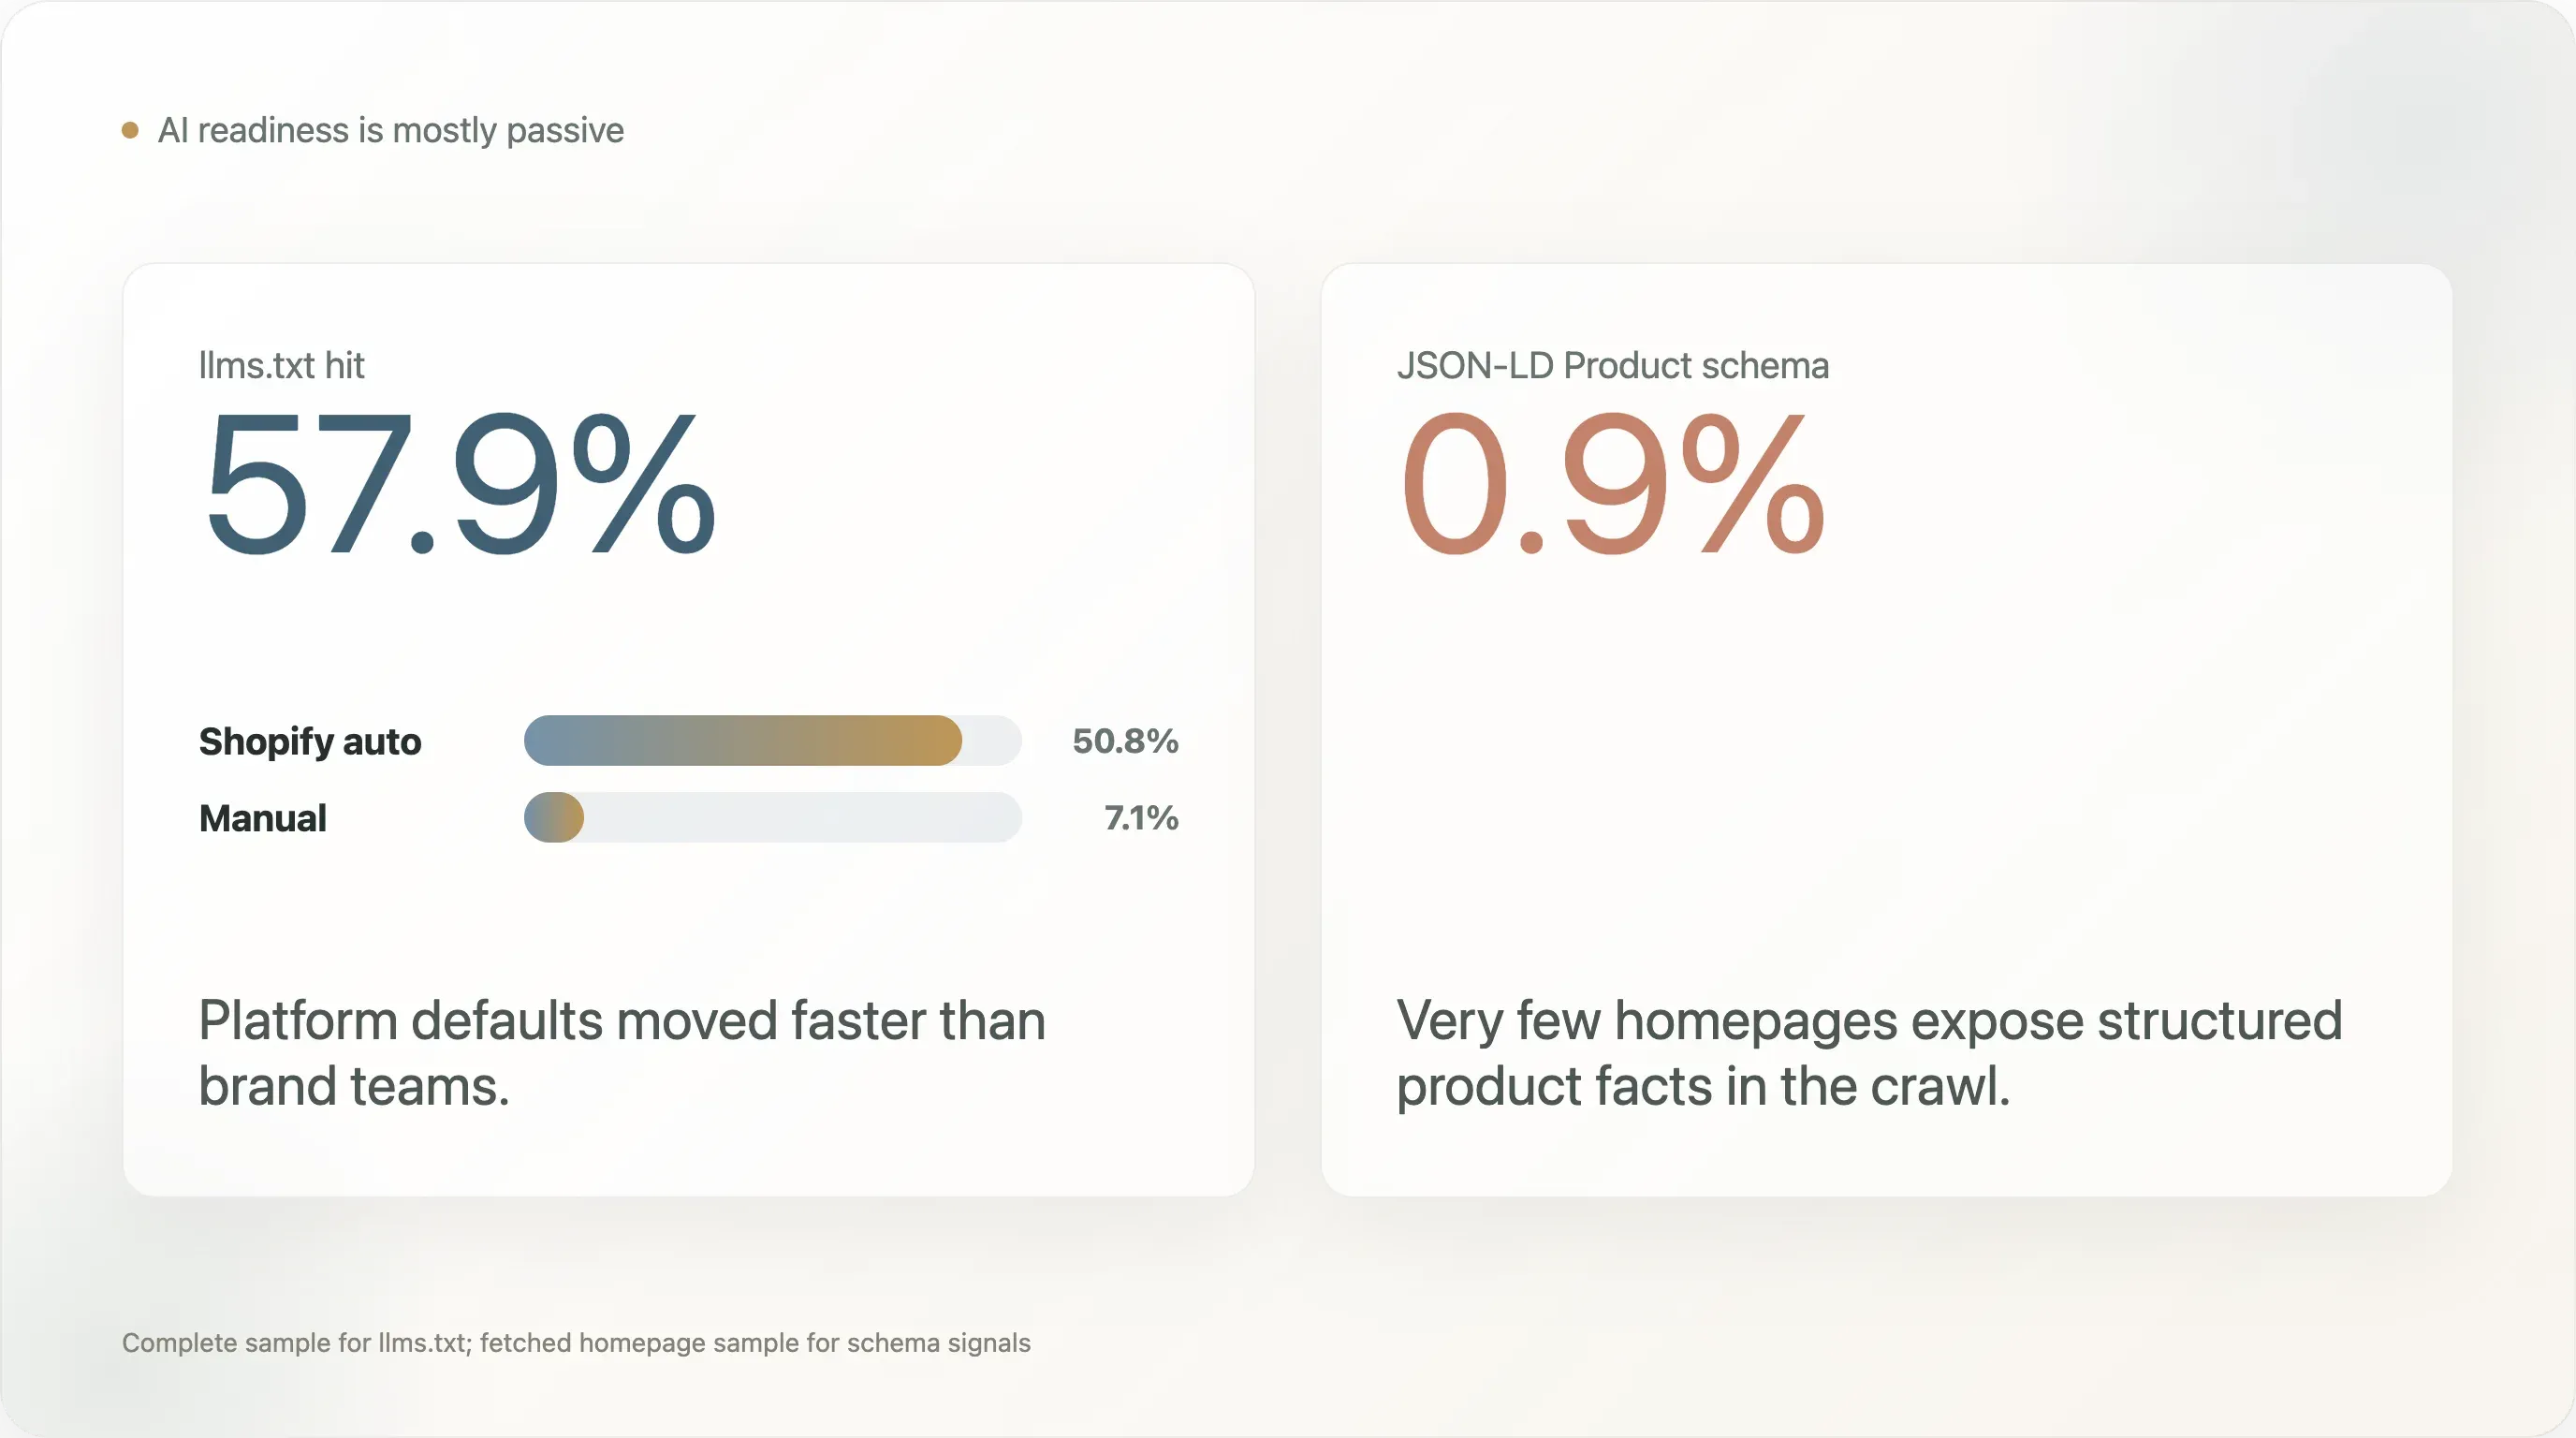
| llms.txt status | Count | Share of complete sample |
|---|---|---|
| Total llms.txt hit | 717 | 57.9% |
| Shopify auto-generated | 629 | 50.8% |
| Manual | 88 | 7.1% |
| Soft 404 | 137 | 11.1% |
| Not configured | 383 | 30.9% |
The conclusion is not "DTC brands have become AI-search experts." A better conclusion is: platform defaults can move the market faster than brand teams can. When a platform adds a new public file automatically, many brands benefit without making an active strategic decision. That is useful, but it is not the same as deliberate AI-search optimization.
The more important gap appears in structured data. In the 1,240 samples with fetched homepage content, JSON-LD of any kind appears on 48.4%, Organization schema on 39.5%, WebSite schema on 36.0%, BreadcrumbList on 12.7%, and Product schema on only 0.9%.
| SEO / schema signal | Coverage |
|---|---|
| meta viewport | 90.3% |
| meta description | 84.4% |
| canonical | 81.2% |
| og:title | 79.1% |
| twitter:card | 70.0% |
| og:image | 65.2% |
| JSON-LD, any type | 48.4% |
| JSON-LD Organization | 39.5% |
| JSON-LD WebSite | 36.0% |
| hreflang | 31.5% |
| JSON-LD BreadcrumbList | 12.7% |
| manifest | 10.9% |
| RSS feed | 4.3% |
| JSON-LD Product | 0.9% |
Product schema is important because it helps search engines and AI systems understand product entities: name, price, availability, SKU, ratings, images, and related product facts. A brand can have beautiful copy and a modern ecommerce stack, but if public crawlers cannot parse product facts cleanly, the brand is leaving discoverability on the table.
Positive examples in the crawl include brands such as Curie, Manukora, Mokobara, MoxieLash, Unbloat, and Viva, which appeared among the small set of Product schema detections. They should not be treated as the only brands doing structured product work, because the method is homepage-based and conservative. But they are useful examples of the kind of structured signal that most public DTC homepages did not expose in this crawl.
For SEO teams, this is the most actionable item in the whole report. Adding or validating Product schema on product pages is usually much cheaper than launching a new channel, rebuilding a site, or adding another analytics vendor. It is also easy to explain internally: if AI search and rich results need structured product facts, then the product page should publish those facts in a machine-readable format.
For content creators, the headline writes itself: DTC brands got an AI-search file by default, but almost none expose Product schema in the crawl. That contrast is more interesting than a generic "AI search is coming" story because it points to a concrete gap.
4. Checkout: Shop Pay Is the Default, BNPL Is Still a Minority Signal
Checkout is one of the strongest standardization layers in the sample.
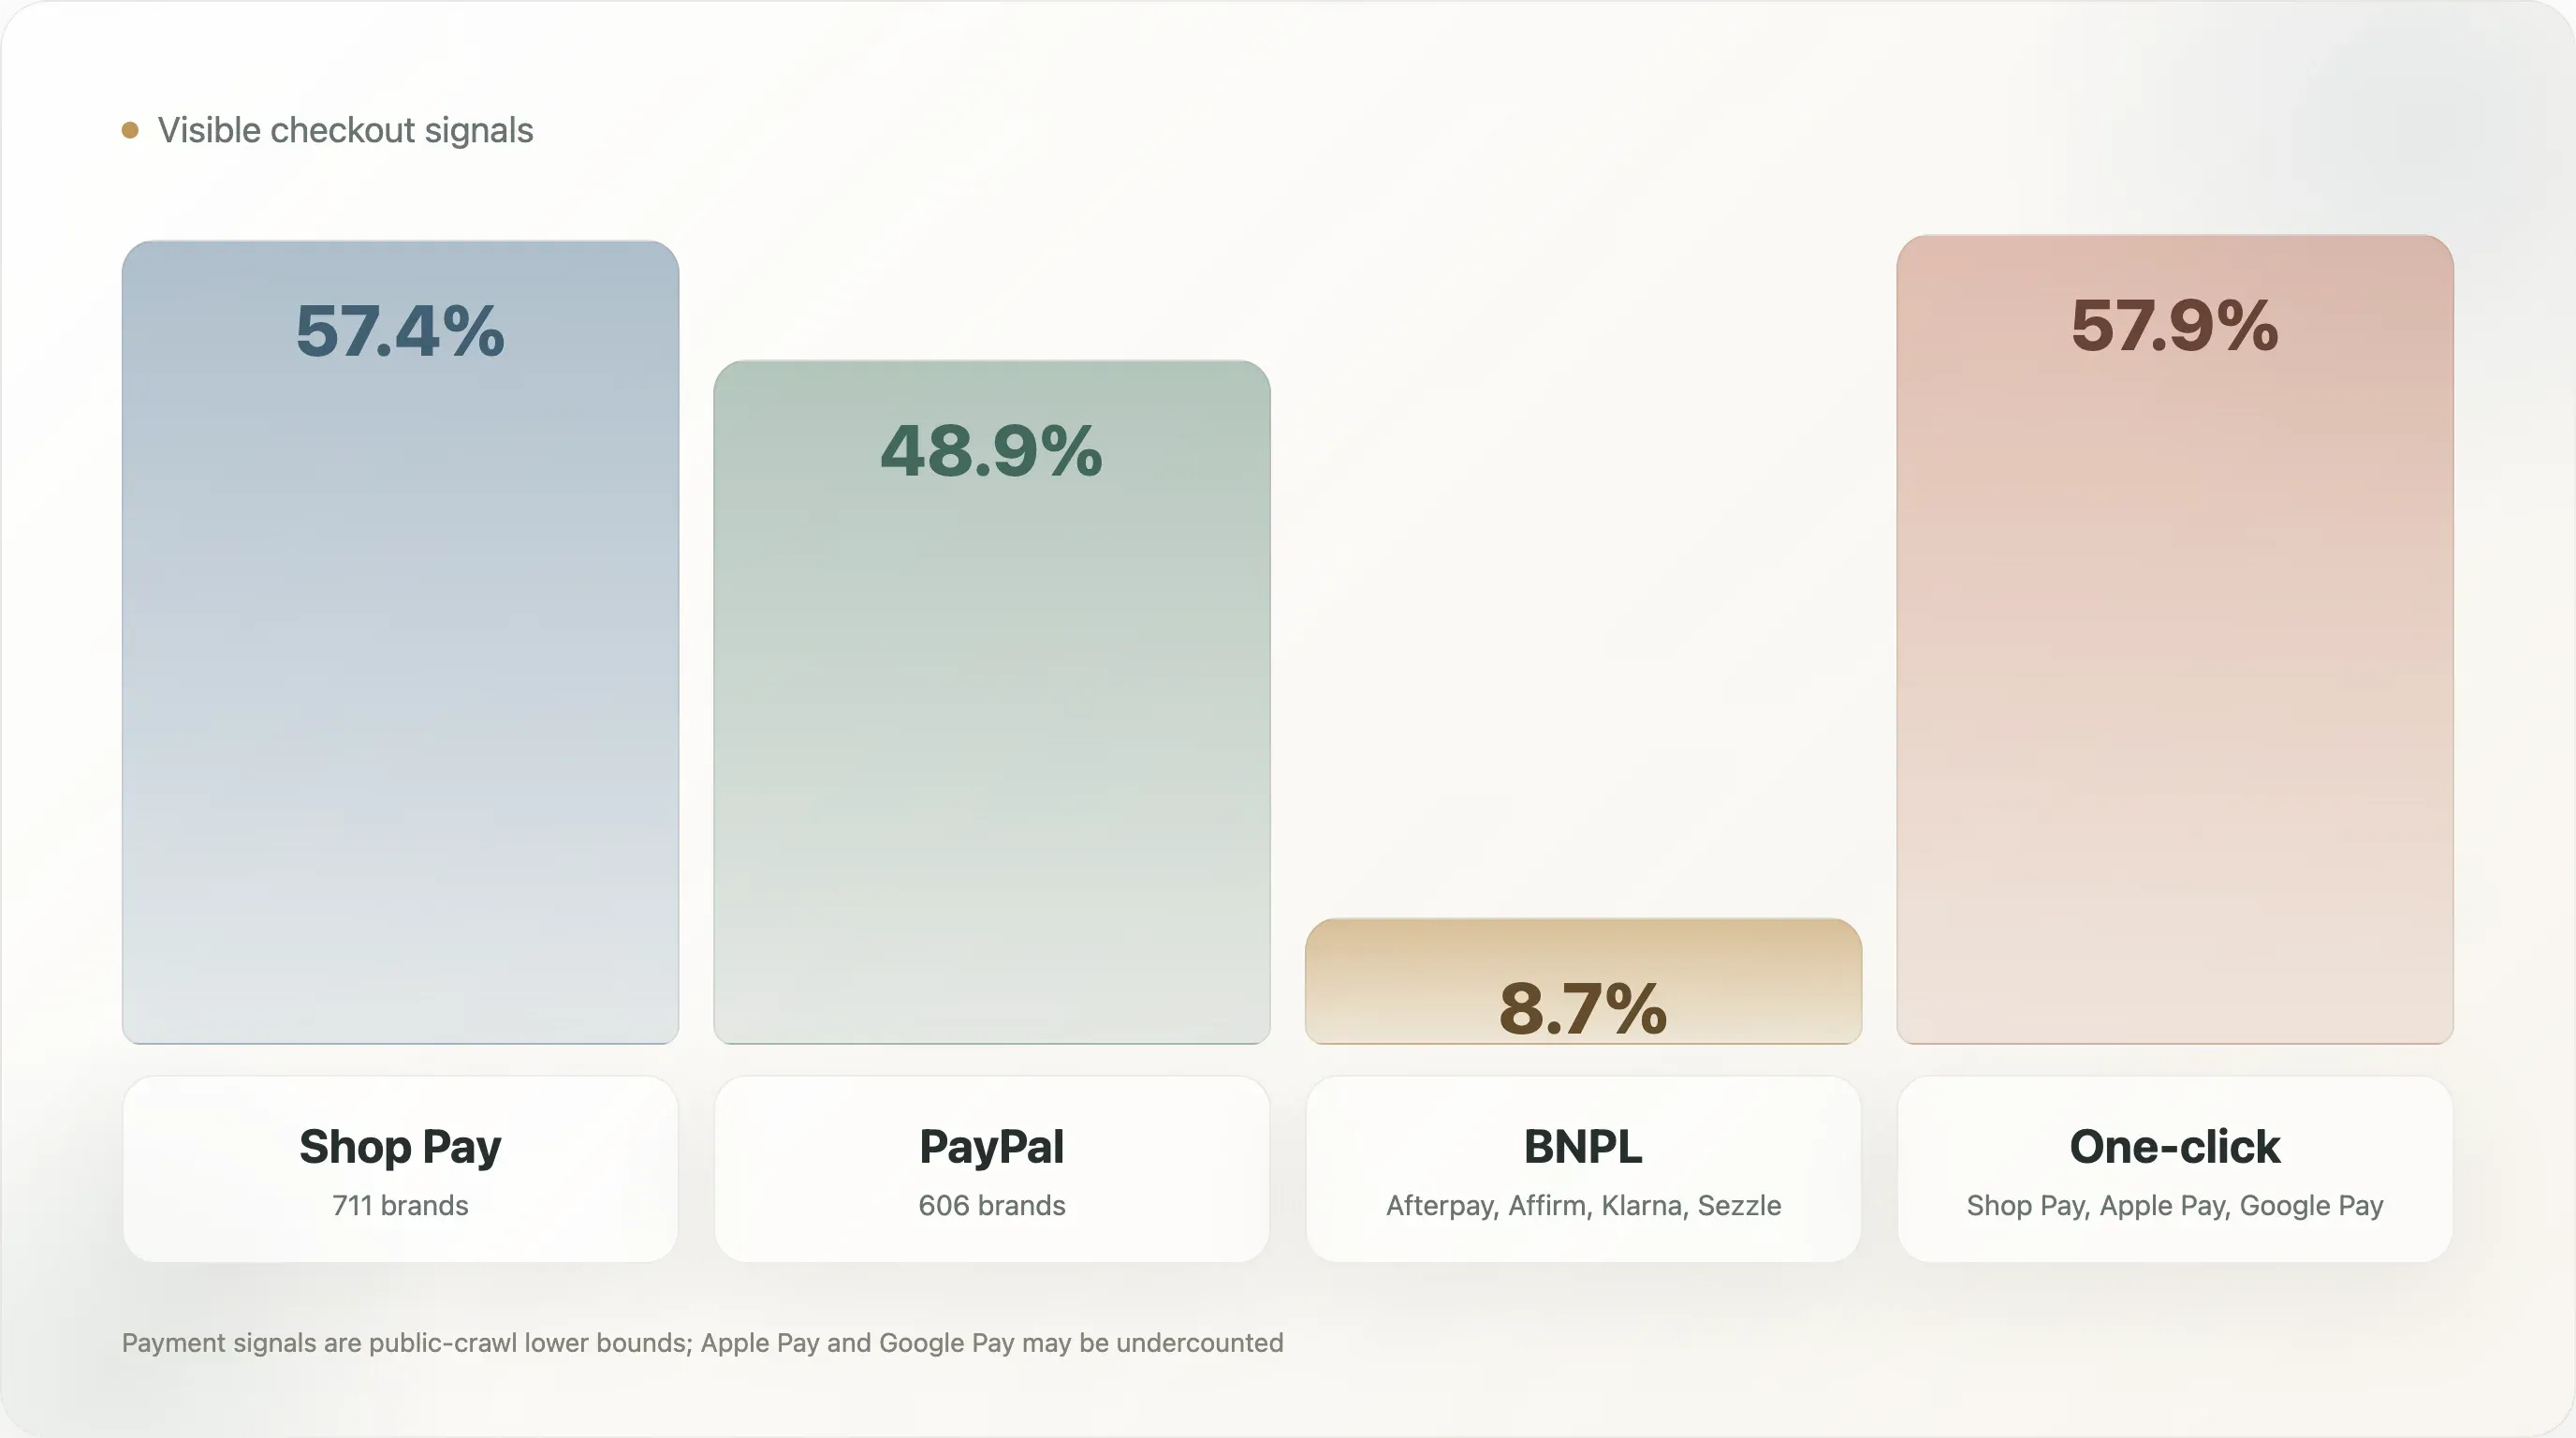
| Payment method | Brands | Coverage |
|---|---|---|
| Shop Pay | 711 | 57.4% |
| PayPal | 606 | 48.9% |
| Afterpay | 73 | 5.9% |
| Affirm | 24 | 1.9% |
| Amazon Pay | 16 | 1.3% |
| Klarna | 14 | 1.1% |
| Google Pay | 9 | 0.7% |
| Apple Pay | 5 | 0.4% |
One-click checkout, defined here as Shop Pay, Apple Pay, or Google Pay, appears on 57.9% of complete samples. BNPL, defined as Afterpay, Affirm, Klarna, or Sezzle, appears on 8.7%.
Apple Pay and Google Pay are likely undercounted because they often load through dynamic checkout scripts rather than static homepage HTML. Shop Pay and PayPal are easier to detect in this methodology. The safe conclusion is not that Apple Pay is unimportant. The safe conclusion is that Shop Pay and PayPal are the most visible checkout signals in this public crawl.
The BNPL number is strategically useful because it is low enough to create a decision point. BNPL is not a universal DTC default in this sample. It appears more selectively by category and price point. For high-AOV categories such as apparel, footwear, furniture, equipment, or premium beauty, BNPL can reduce purchase friction. For lower-AOV consumables, the benefit may be weaker.
The operator question is therefore not "should every DTC brand add BNPL?" It is "does our AOV, margin structure, customer age mix, return behavior, and category consideration cycle justify another payment option?" For brands above roughly $80 AOV, the case is often worth testing. For subscription consumables, the case depends on whether BNPL improves first-order conversion without weakening retention economics.
Positive examples in the broader checkout landscape are easy to find among mature DTC brands that give customers more than one trusted path to pay. Glossier appears in the crawl with Afterpay, PayPal, and Shop Pay. Saatva appears with Affirm in the payment field. Those examples are useful because they show different category logics: beauty uses flexible payment as part of a broad consumer checkout experience; mattresses and home goods use financing to reduce friction on larger purchases.
5. Headless Is Still a Maturity Signal, Not the Default
In the 1,238 complete samples, modern frontend frameworks appeared as follows:
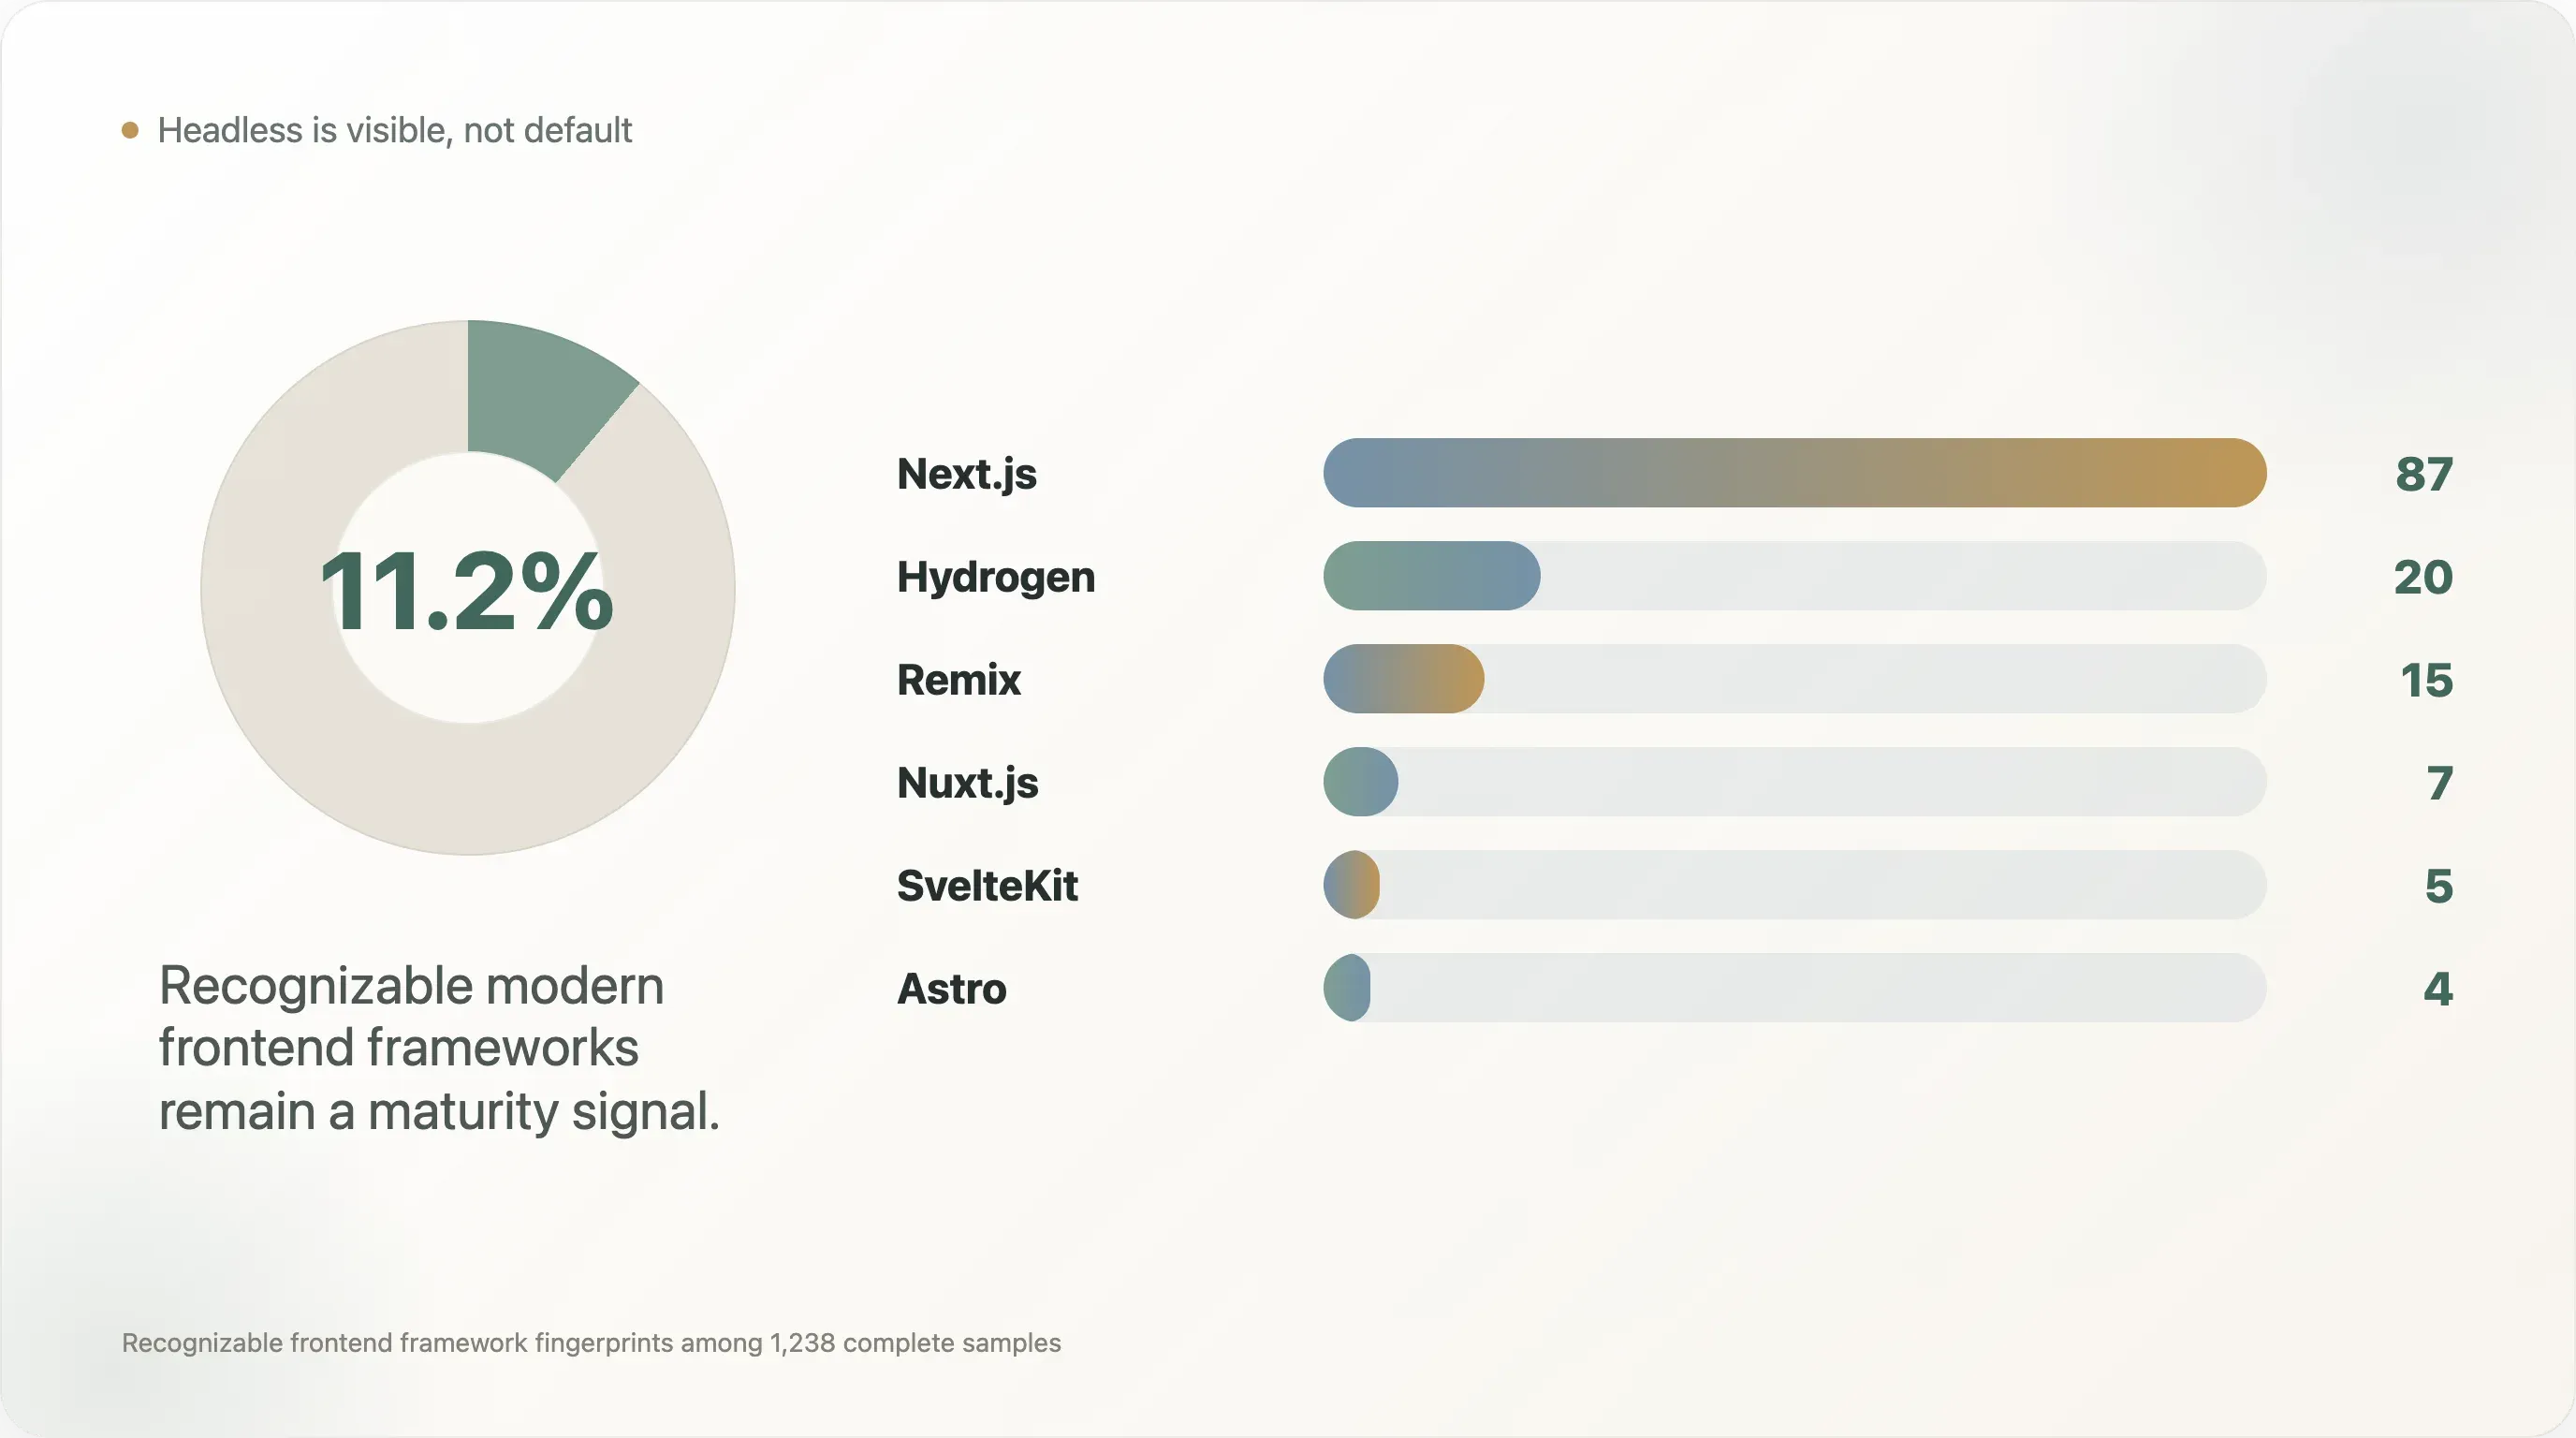
| Frontend | Brands | Share |
|---|---|---|
| Next.js | 87 | 7.0% |
| Hydrogen | 20 | 1.6% |
| Remix | 15 | 1.2% |
| Nuxt.js | 7 | 0.6% |
| SvelteKit | 5 | 0.4% |
| Astro | 4 | 0.3% |
| Gatsby | 1 | 0.1% |
Together, these recognizable modern frontend frameworks appear on roughly 139 brands, or 11.2% of the complete sample. The true headless share may be higher because many custom React or SPA storefronts do not expose recognizable framework fingerprints in a simple crawl.
The headline is not "everyone is going headless." The headline is more subtle: headless is visible enough to matter, but still scarce enough to signal maturity. Most DTC teams are not rebuilding their storefronts on Next.js or Hydrogen. The brands that do are usually solving specific problems: speed, visual control, content-commerce flexibility, international architecture, complex landing pages, or tighter SEO control.
Positive examples from the crawl include Warby Parker and Stitch Fix with Next.js, Dr. Squatch, Blueland, Liquid I.V., and Chubbies with Hydrogen, Hedley Bennett and Harry's with Remix, and Cocunat and Biossance with Astro. These names matter because operators prefer concrete examples. They show that headless is not an abstract engineering trend; it is a pattern visible across eyewear, personal care, food, apparel, beauty, and consumer goods.
For most brands, however, headless should not be the first operating priority. A headless frontend can create performance and brand-experience gains, but it also raises maintenance costs. The brand needs engineering capacity, QA discipline, analytics governance, content workflow management, and reliable deployment processes. A small brand without a clean analytics setup, email lifecycle, schema implementation, and checkout testing culture should not jump straight to a frontend rebuild.
The more practical maturity ladder looks like this:
- Get the baseline stack working: GA4, retention, checkout, consent, and clean events.
- Add structured product data and crawlable SEO foundations.
- Reduce unnecessary scripts and third-party dependencies.
- Add behavior analytics or attribution only when the team can act on the data.
- Consider headless when the brand has a real need for speed, design control, internationalization, or content-commerce flexibility.
That ladder is useful because it keeps headless in context. It is not a badge. It is an operating choice.
6. Performance Debt: The Homepage Is Becoming a Vendor Hub
The performance fields show a common DTC tension. Marketing teams want visibility, attribution, popups, reviews, personalization, support, social pixels, consent, testing, and retargeting. Engineering and SEO teams want speed, fewer dependencies, and cleaner pages. The homepage sits in the middle.
In the 1,240 homepage samples with performance metrics:
| Metric | Median | p75 | Max |
|---|---|---|---|
| Script tags | 52 | 69 | 305 |
| Third-party domains | 8 | 12 | 41 |
The homepage byte-size field is not a reliable finding because the fetch process capped reads at 256KB. But script count and third-party-domain count are still useful indicators. A median of 52 script tags means the typical complete homepage sample is not a lightweight document. It is a coordination point for many vendors and browser-side behaviors.
This finding is easy for operators to misunderstand. The answer is not "remove every tool." Many tools exist because they support revenue. The better answer is to assign ownership. Every script should have a business owner, a reason to exist, a loading strategy, a consent behavior, and a review cycle. If no one owns a script, it becomes performance debt.
The best operator question is: which tags are still earning their cost? A pixel that supports a major paid channel may be worth the performance tradeoff. A legacy testing tag from a vendor the team no longer uses is not. A behavior analytics tool may be worth it if someone reviews sessions weekly. If no one reviews the recordings, the script is just drag.
For SEO teams, this is a useful bridge topic. Core Web Vitals and technical SEO are often treated as engineering problems, while tags are treated as marketing tools. In practice, they are the same operating system. A DTC team cannot improve performance without tag governance, and it cannot govern tags without marketing participation.
7. Privacy, Observability, and Advanced Operations
Several tool categories in the sample are less common than the core stack, but more revealing when present.
Cookiebot / OneTrust appears on 9.6% of complete samples. This is a consent-management signal. It often appears when brands operate in stricter privacy jurisdictions or take compliance seriously. If a DTC brand is expanding into Europe, Canada, or other privacy-sensitive markets, consent management becomes a practical requirement rather than a nice-to-have.
Microsoft Clarity appears on 20.6%, while Hotjar appears on 8.3%. That is a striking difference because both are associated with behavior analytics. Clarity's free and privacy-friendly positioning likely gives it an advantage in a cost-sensitive market. For operators, this suggests behavior analytics is not just an enterprise activity. Mid-market DTC teams can watch user behavior without buying an expensive research platform.
Gorgias appears on 19.1%. That matters because customer support is one of the places where DTC differs from generic ecommerce. Returns, order changes, shipping questions, subscriptions, damaged goods, and product education all connect support to revenue. A support tool that integrates with ecommerce data can become part of the conversion and retention system, not just a ticket inbox.
Triple Whale appears on 15.3% and Northbeam on 5.1%. These are attribution maturity signals. When a brand is spending across Meta, Google, TikTok, influencers, affiliates, email, and SMS, GA4 alone may not answer the question operators care about: which spend is truly profitable? The appearance of DTC-native attribution tools suggests that the attribution problem has moved from niche concern to mainstream growth-team pain.
Rebuy appears on 9.0%. That is a post-purchase and upsell signal. The low share suggests many brands still have room to improve order-value and post-purchase monetization. For brands with replenishable products or complementary SKUs, post-purchase upsell can be more efficient than chasing new traffic.
These tools are not recommendations for every brand. They are maturity markers. A brand should not install Triple Whale before it has enough paid spend to justify better attribution. It should not install behavior analytics if no one will review sessions. It should not add Rebuy if the product catalog has no logical complementary purchases. The benchmark is useful because it shows when these tools enter the visible stack, not because it says everyone needs all of them.
8. Category Differences: Beauty and Wellness Run Deeper Stacks
Category classification in this study is rule-based and imperfect. More than half of the full brand pool falls into "Other," so category findings should be read directionally. Still, the labeled categories reveal useful patterns among groups with enough samples.
| Category | Sample | Shopify share in sample | Avg detected tools | TikTok | |
|---|---|---|---|---|---|
| Apparel & Footwear | 141 | 95.0% | 4.2 | 48.2% | 31.2% |
| Food & Beverage | 103 | 88.3% | 4.3 | 55.3% | 31.1% |
| Beauty & Skincare | 87 | 94.3% | 4.7 | 43.7% | 26.4% |
| Health & Wellness | 48 | 87.5% | 4.9 | 39.6% | 25.0% |
| Outdoor & Sports | 42 | 92.9% | 4.0 | 47.6% | 23.8% |
Beauty & Skincare and Health & Wellness have the deepest detected stacks in this table. That makes sense. These categories often involve education, trust, ingredients, subscriptions, routines, reviews, regulatory caution, and repeat purchase behavior. A wellness brand may need content, email education, quizzes, subscriptions, attribution, support, and behavior analytics to move a skeptical customer from awareness to repeat purchase.
Food & Beverage has the highest Instagram coverage in this view. That also fits the category. Food is visual, ritual-based, occasion-driven, and easy to show in lifestyle context. Apparel & Footwear has the highest TikTok coverage, roughly tied with Food & Beverage, which fits short-form try-on, styling, haul, and creator content.
For content marketers, this section is a strong repurposing opportunity. An omnibus benchmark is useful, but category-specific reports often travel farther. "What beauty DTC brands actually install" or "Why food DTC over-indexes on Instagram" will likely perform better inside those vertical communities than a general DTC stack story.
9. Homepage Copy: DTC Is More Transactional Than Its Self-Image
The value-proposition text scan looked at readable homepage text after stripping scripts and styles. The goal was not to judge brand quality. It was to see which phrases appear often enough to represent public positioning.
| Keyword or theme | Coverage |
|---|---|
| free shipping | 26.2% |
| best seller | 24.4% |
| press / as seen on | 22.6% |
| gift card | 19.8% |
| exclusive | 14.3% |
| subscription | 13.3% |
| craft / artisan | 11.5% |
| luxury | 5.7% |
| organic | 4.9% |
| vegan | 4.7% |
| sustainable | 4.6% |
| eco-friendly | 1.3% |
| cruelty free | 1.0% |
The most visible messages are practical and commercial: free shipping, best sellers, press credibility, gift cards, exclusivity, and subscriptions. Sustainability-related terms are much less frequent. That does not mean DTC brands are not sustainable. It means sustainability is not the primary homepage conversion language in this sample.
This is a useful counter-narrative for media and newsletters because DTC is often described through values, mission, sustainability, and community. The public homepage copy in this sample is more conversion-oriented. Brands still need to reduce friction, prove demand, show credibility, and move visitors toward purchase.
"Press / as seen on" at 22.6% is especially useful for PR teams. It suggests earned media is not just awareness. It becomes a reusable trust asset on the homepage. A strong press hit can live inside the conversion path long after the article publishes.
"Gift card" at 19.8% is also more interesting than it looks. Gift cards can function as revenue, acquisition, loyalty, and cash-flow tools. They are not just a holiday add-on. For DTC brands with strong giftability, a gift card module can reduce decision friction for customers who like the brand but do not know the recipient's size, taste, shade, or exact product need.
10. Head Versus Tail: Tool Count Is Not the Moat
The head-versus-tail split uses source visibility, not revenue. "Head" means a brand appeared in at least three source collections. "Tail" means a brand appeared in one source collection. It is a public-source visibility proxy.
| Dimension | Head group | Tail group |
|---|---|---|
| Sample size | 89 | 708 |
| Shopify share in sample | 93.3% | 84.7% |
| Avg detected analytics tools | 4.5 | 4.1 |
| Median detected analytics tools | 4 | 4 |
| Shop Pay | 82.0% | 77.1% |
| PayPal | 75.3% | 64.8% |
| Afterpay | 11.2% | 7.3% |
The stack-depth gap is small. That is important. It means smaller or less visible brands can access most of the same infrastructure as better-known brands. A modern ecommerce operator does not need a huge team to install GA4, Klaviyo, Shop Pay, PayPal, Microsoft Clarity, or basic pixels.
The difference is how those tools are used and which advanced tools appear next. A head brand may not have many more tools, but it is more likely to have stronger attribution, better checkout options, cleaner compliance, more mature support, and better governance. The moat is not the app list. The moat is operating discipline.
For mid-market DTC teams, the takeaway is encouraging and uncomfortable at the same time. Encouraging because the tools are accessible. Uncomfortable because if everyone can install the same tools, advantage shifts to execution: creative testing velocity, email segmentation, product-page quality, technical SEO, schema, speed, lifecycle measurement, and campaign discipline.
11. What Operators Should Do With This
The benchmark becomes useful only if it turns into decisions. Here is a practical order of operations.
First, audit the baseline. Confirm that GA4 events are clean, purchase tracking is reliable, Klaviyo or the retention platform is connected correctly, checkout options work, consent behavior is compliant, and all major paid pixels are intentional. Do not add tools to compensate for broken fundamentals.
Second, fix the AI-search and SEO basics. Validate meta description, canonical tags, Open Graph, hreflang where relevant, and JSON-LD. The biggest opportunity is Product schema. If the brand sells products online, product facts should be machine-readable on product pages.
Third, run a tag review. Export scripts and third-party domains. Assign an owner to each. Remove abandoned vendors. Delay non-critical scripts. Make consent behavior explicit. This is one of the rare tasks that helps SEO, engineering, analytics, and marketing at the same time.
Fourth, check checkout friction by category and AOV. If AOV is high, BNPL may be worth testing. If the brand sells internationally, PayPal and localized payment expectations matter. If Apple Pay or Google Pay are present but not publicly visible in the crawl, make sure the actual checkout experience still surfaces them clearly.
Fifth, connect the website to owned social deliberately. If Instagram, TikTok, YouTube, Pinterest, LinkedIn, or X matter to the brand, the official website should route users there. If a channel no longer matters, remove the stale icon.
Sixth, treat advanced tools as operating commitments. Triple Whale, Northbeam, Rebuy, Attentive, Gorgias, and behavior analytics tools can create value, but only if the team has a workflow around them. A tool without an owner is just another script.
Methodology
The starting pool contained 1,597 candidate DTC brands assembled from public ecommerce and DTC sources, including tool case-study libraries, Shopify ecosystem materials, and public DTC indexes. Of those, 1,431 candidates resolved to domains. The crawl completed homepage-level analysis for 1,238 websites and fetched homepage content for 1,240 domains on May 11, 2026.
The crawl attempted homepage, product page where discoverable, sitemap endpoints, llms.txt candidates, and about-page candidates. Raw HTML was stored by domain. Detection used fingerprint patterns for ecommerce platform, frontend framework, analytics and marketing tools, payment signals, SEO/schema fields, social links, and performance-related counts.
The analysis primarily reflects public website markup. It does not access internal analytics accounts, ad accounts, checkout admin settings, email performance, sales data, conversion rates, traffic levels, or revenue. It does not claim that a detected tool is configured correctly or actively used.
Caveats for Citation
-
This is not an industry census. The sample is biased toward brands visible in ecommerce tool ecosystems and public DTC lists. Use wording such as "among 1,238 complete DTC website samples in this study," not "all DTC brands."
-
Shopify is overrepresented by design. Shopify's share in the sample should be treated as a sample characteristic, not market share.
-
Tool detection is a lower bound. Dynamic scripts, consent-gated tags, inline checkout methods, and client-rendered content can be missed.
-
Homepage byte size is capped. The collection process capped HTML reads at 256KB, so homepage size should not be cited as a performance finding. Script count and third-party-domain count are more useful.
-
Social visibility is not social activity. Homepage social links show official-site routing, not follower count, posting frequency, creator distribution, paid social, or social revenue.
-
Category classification is directional. The taxonomy is keyword-based and has a large "Other" bucket. Category tables are useful for patterns, not exact market sizing.
-
This is a point-in-time snapshot. The data was collected on May 11, 2026. Websites change often, and future refreshes may show meaningful drift.
Reproducibility Notes
The delivery folder includes:
00_expand_brand_pool.py— expands the initial DTC brand candidate pool from public source lists.01_resolve_domains.py— resolves brand names and source entries into canonical domains.02_fetch_pages.py— fetches homepage, product-page, sitemap,llms.txt, and about-page candidates.03_detect_all.py— runs platform, analytics, payment, SEO, schema, social, and performance-signal detection.04_build_master.py— builds the unified per-brand analytical table.05_analyze_reports.py— generates aggregate statistics used in the report.07_categorize_brands.py— applies the keyword-based category classifier.08_extra_analysis.py— produces additional SEO, performance, CTA, value-prop, and co-occurrence outputs.
Methodology corrections, dataset issues, and follow-up analyses welcome at support@thunderbit.com. This report is published independent of any commercial position Thunderbit holds; we build an AI-powered web scraper, and we have a structural interest in ecommerce websites becoming more readable to humans, search engines, analytics systems, and AI agents. The benchmark is based on 1,238 complete DTC website samples collected on May 11, 2026. The data in this report stands on its own. — The Thunderbit research team, May 2026.