
Executive Summary
DTC marketing is often described as if every brand is everywhere: Instagram always on, TikTok always testing, YouTube always educating, Pinterest always collecting long-tail intent, X always talking, LinkedIn always recruiting, and Threads waiting in the wings. The public homepage evidence is more uneven and more useful than that story.
This report starts from 1,597 candidate DTC brands, resolves 1,431 domains, and analyzes 1,238 complete homepage samples collected on May 11, 2026. It measures one specific signal: whether the brand's own homepage exposes links to eight social platforms in the delivered page markup. Those platforms are Instagram, Facebook, TikTok, YouTube, X, Pinterest, LinkedIn, and Threads.
That means this report is not a ranking of social excellence. It does not measure follower count, post frequency, engagement rate, creator partnerships, paid social spend, affiliate traffic, TikTok Shop, YouTube revenue, or community quality. It asks a narrower but highly practical question: which social destinations are important enough for DTC brands to route visitors to from their own websites?
The answer is more surprising than the usual social playbook suggests.
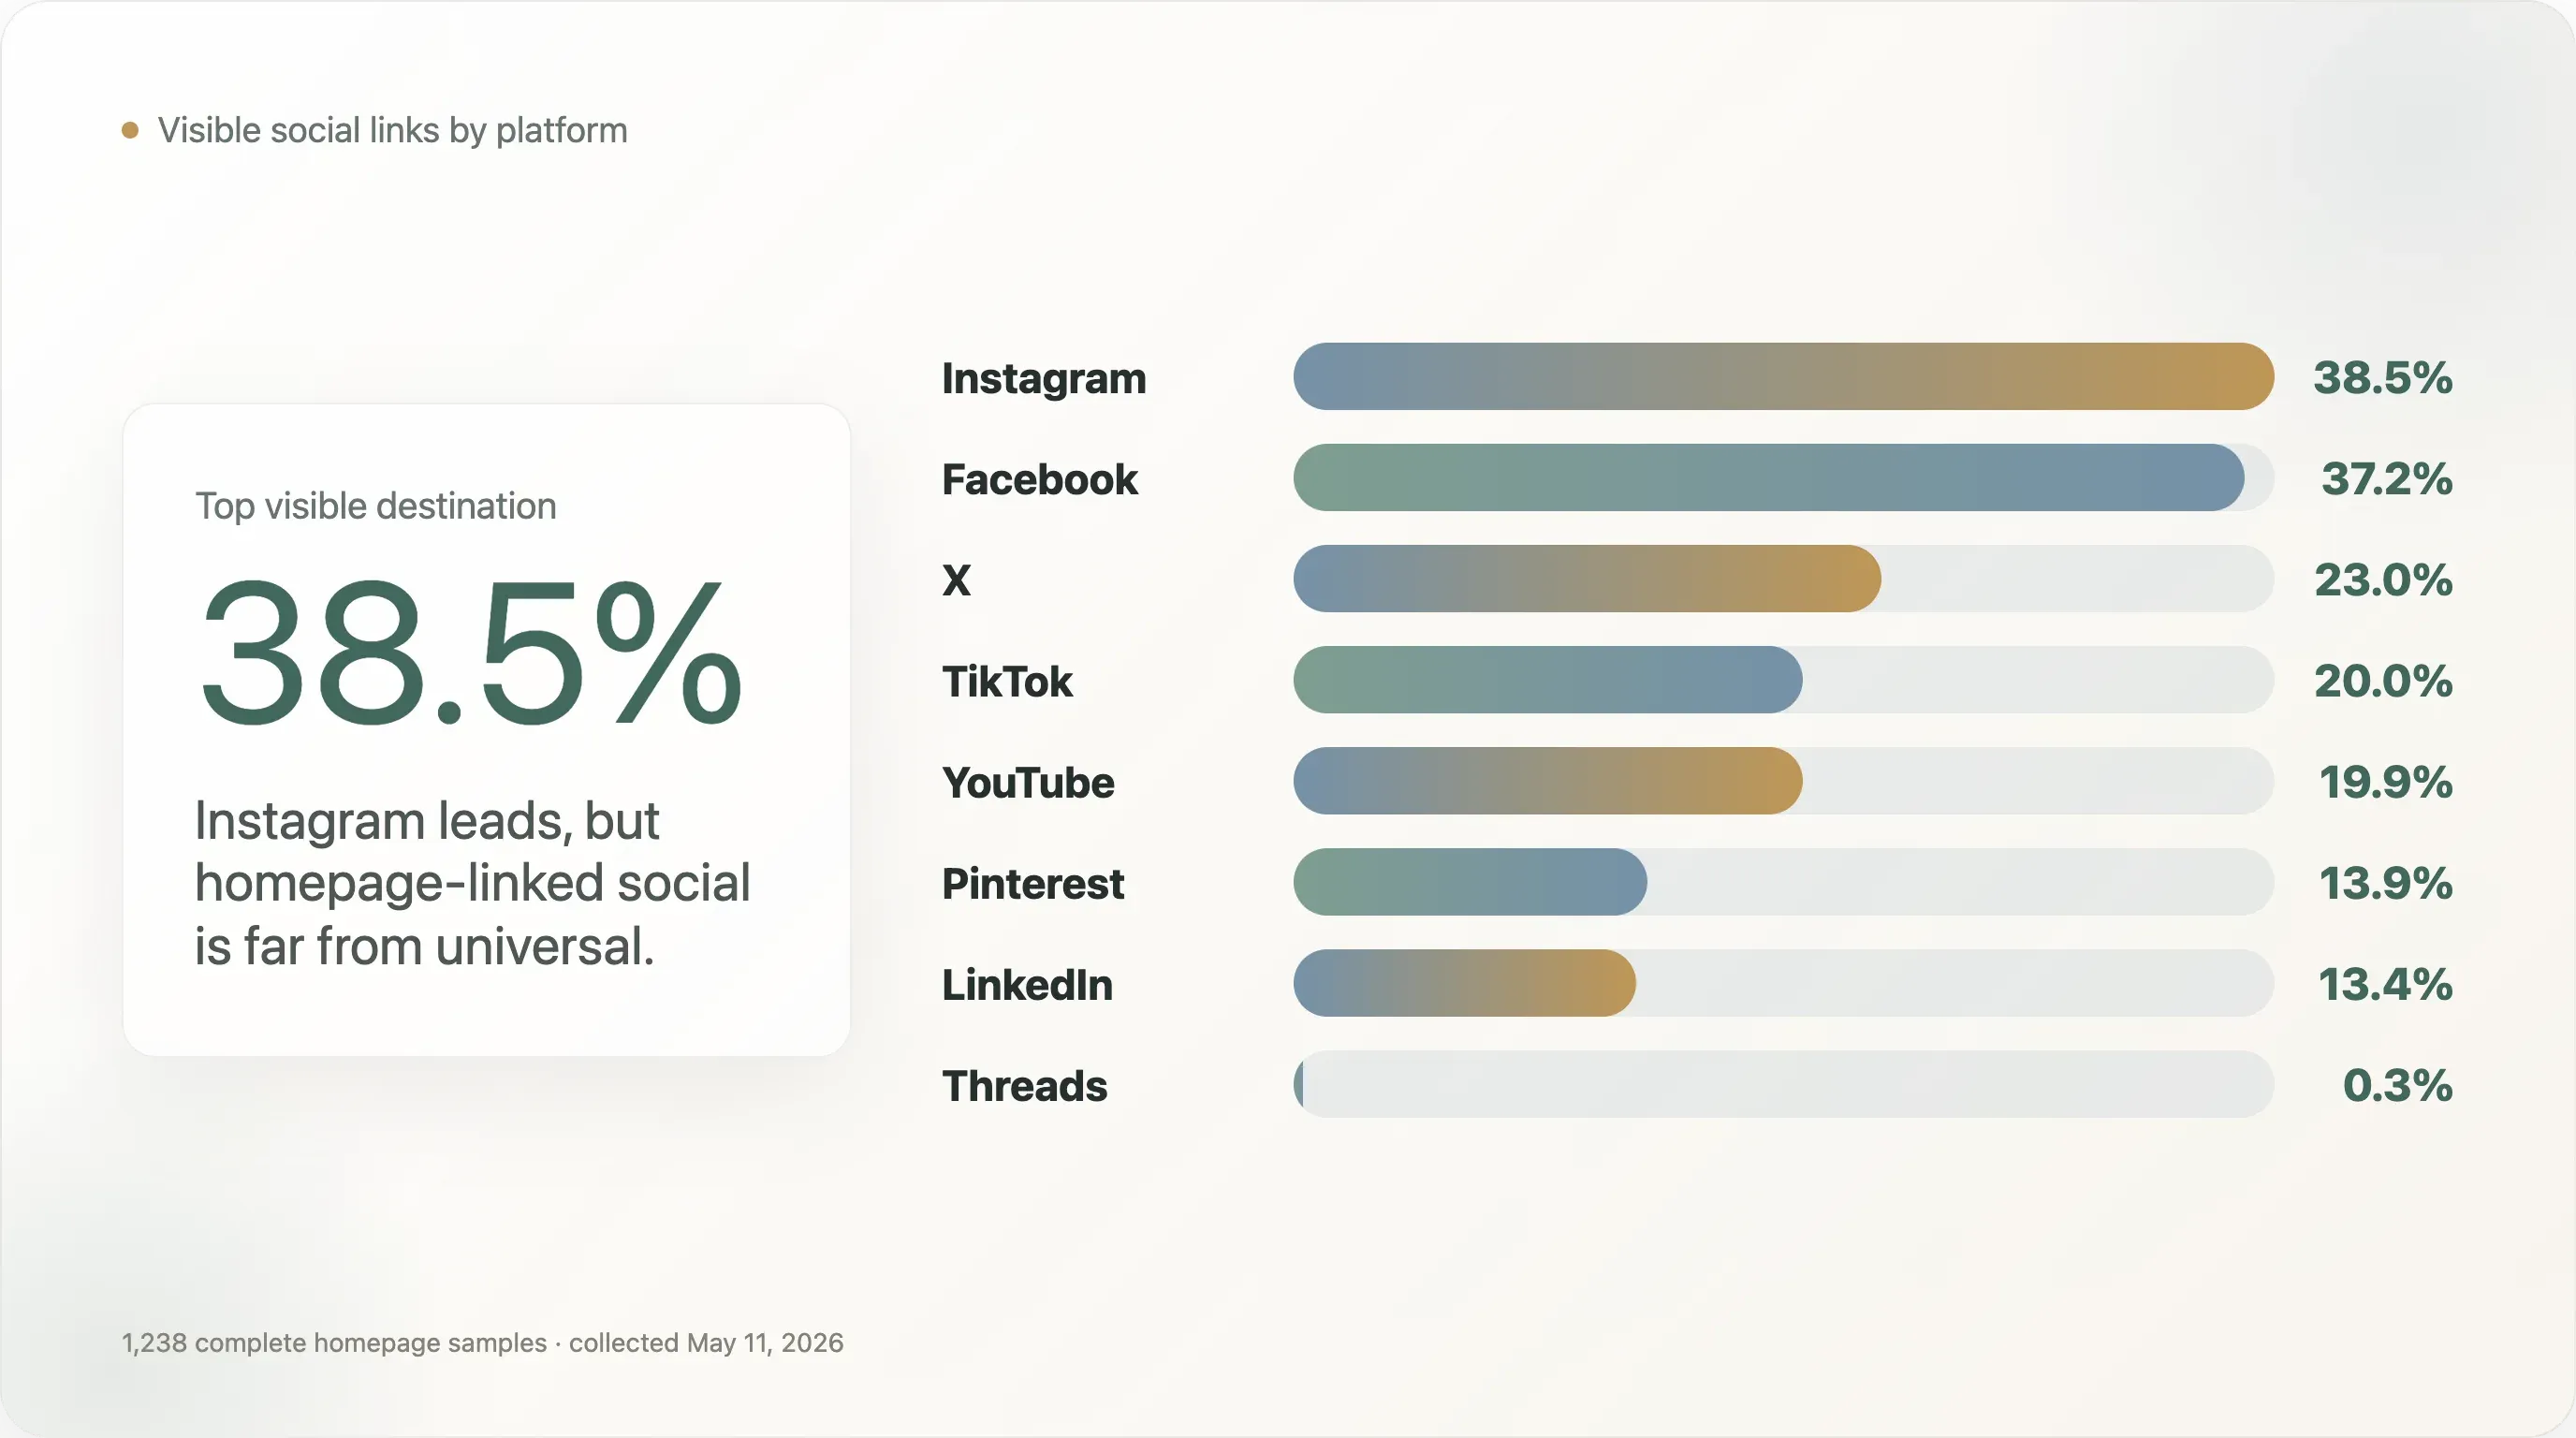
Instagram is the top visible social destination, but it appears on only 38.5% of complete homepage samples. Facebook is close behind at 37.2%. X appears on 23.0%, which is higher than TikTok at 20.0% and YouTube at 19.9% in this homepage-link view. Pinterest appears on 13.9%, LinkedIn on 13.4%, and Threads on just 0.3%, or 4 brands.
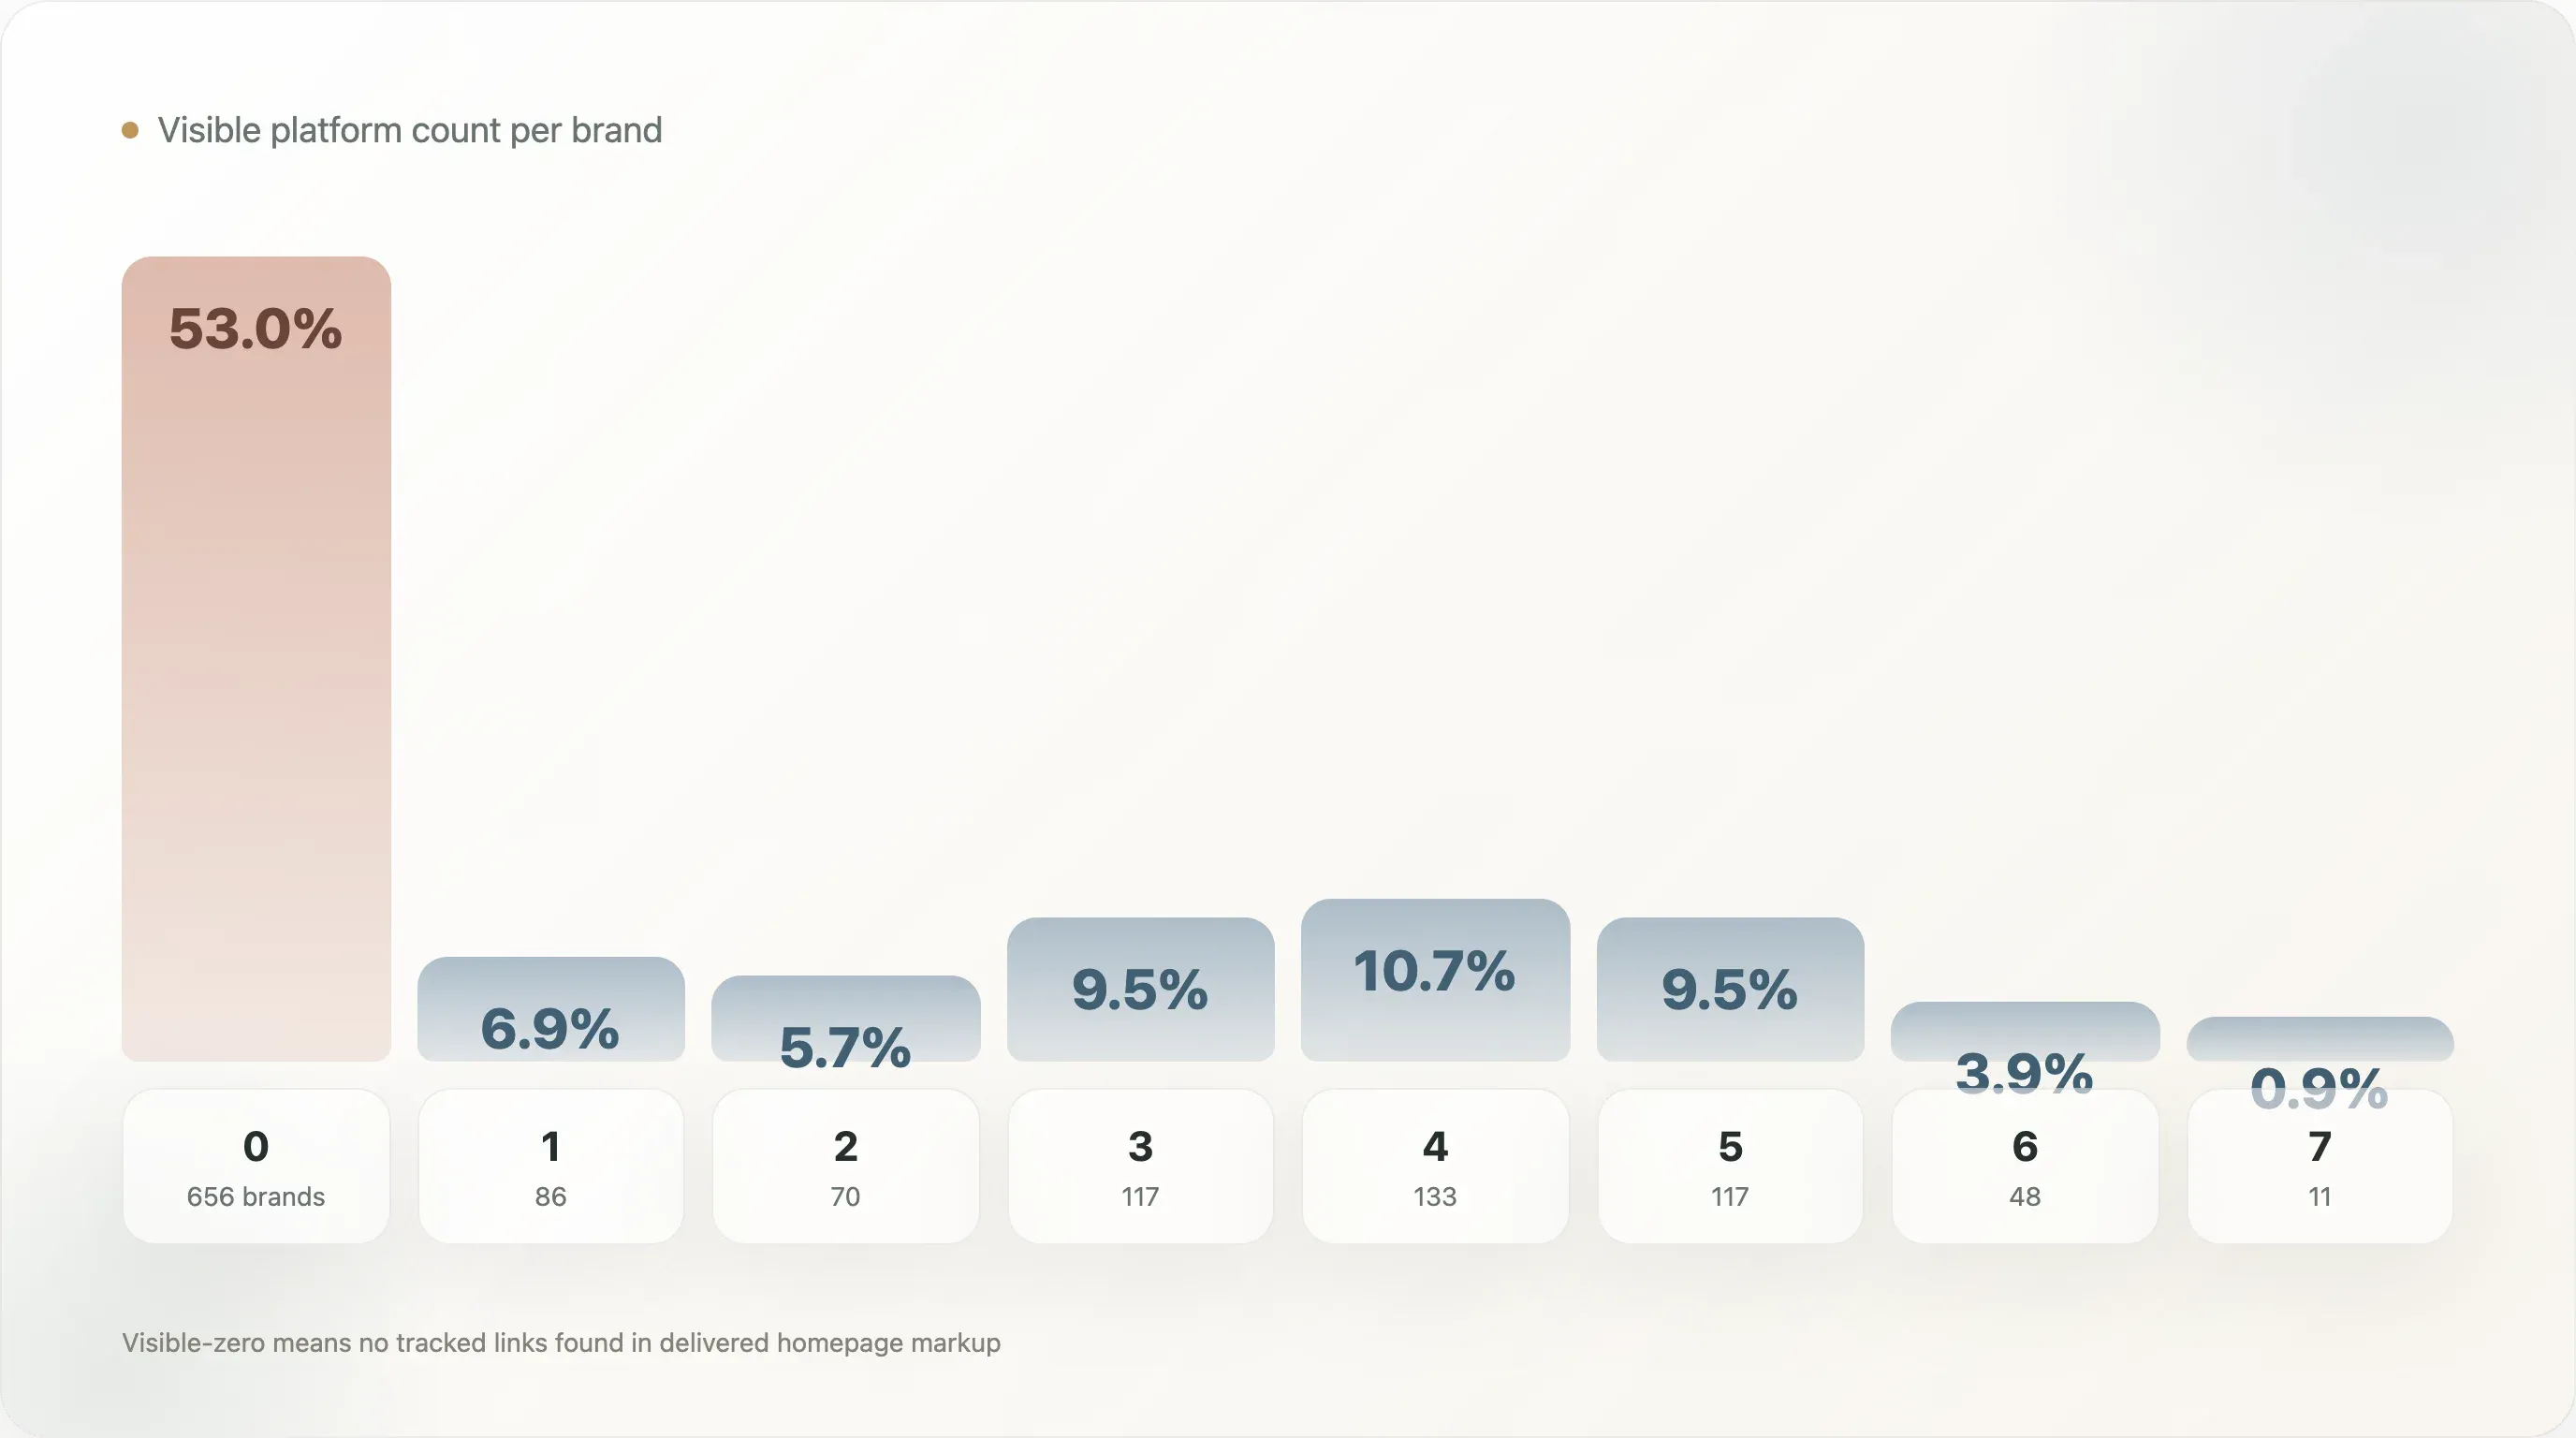
The biggest number is the most provocative: 656 of 1,238 complete homepage samples, or 53.0%, show zero visible links to the tracked social platforms. This does not prove that those brands have no social accounts. Some social links are hidden behind client-side rendering, region-specific footers, menus that require interaction, or other pages. Some brands may depend more on creators, marketplaces, affiliates, paid social, retail partners, or email than on routing homepage visitors to owned social accounts. Still, the visible-zero rate is too large to dismiss. It suggests that the handoff from owned website traffic to owned social surfaces is under-managed across a large part of the sample.
Among the 582 brands with at least one visible social platform, the pattern changes. These brands are not usually "Instagram only." The average visible-social brand links to 3.54 platforms. The practical DTC matrix is the 3-5 platform band, which includes 367 brands. That is 29.6% of the full sample and roughly 63.1% of brands with any visible social link. In other words, DTC social is not evenly distributed. Many brands expose nothing in the homepage snapshot, while the brands that do expose social often maintain a real matrix.
The strongest pair is predictable: Facebook + Instagram appears on 33.8% of complete samples. But the second layer is fragmented. Instagram + TikTok appears on 20.0%, Instagram + YouTube on 18.2%, Facebook + X on 18.0%, Instagram + X on 17.9%, and Facebook + TikTok / Facebook + YouTube both on 17.8%. That means TikTok is not the only modern second layer. YouTube and X are still very much in the visible DTC social mix.
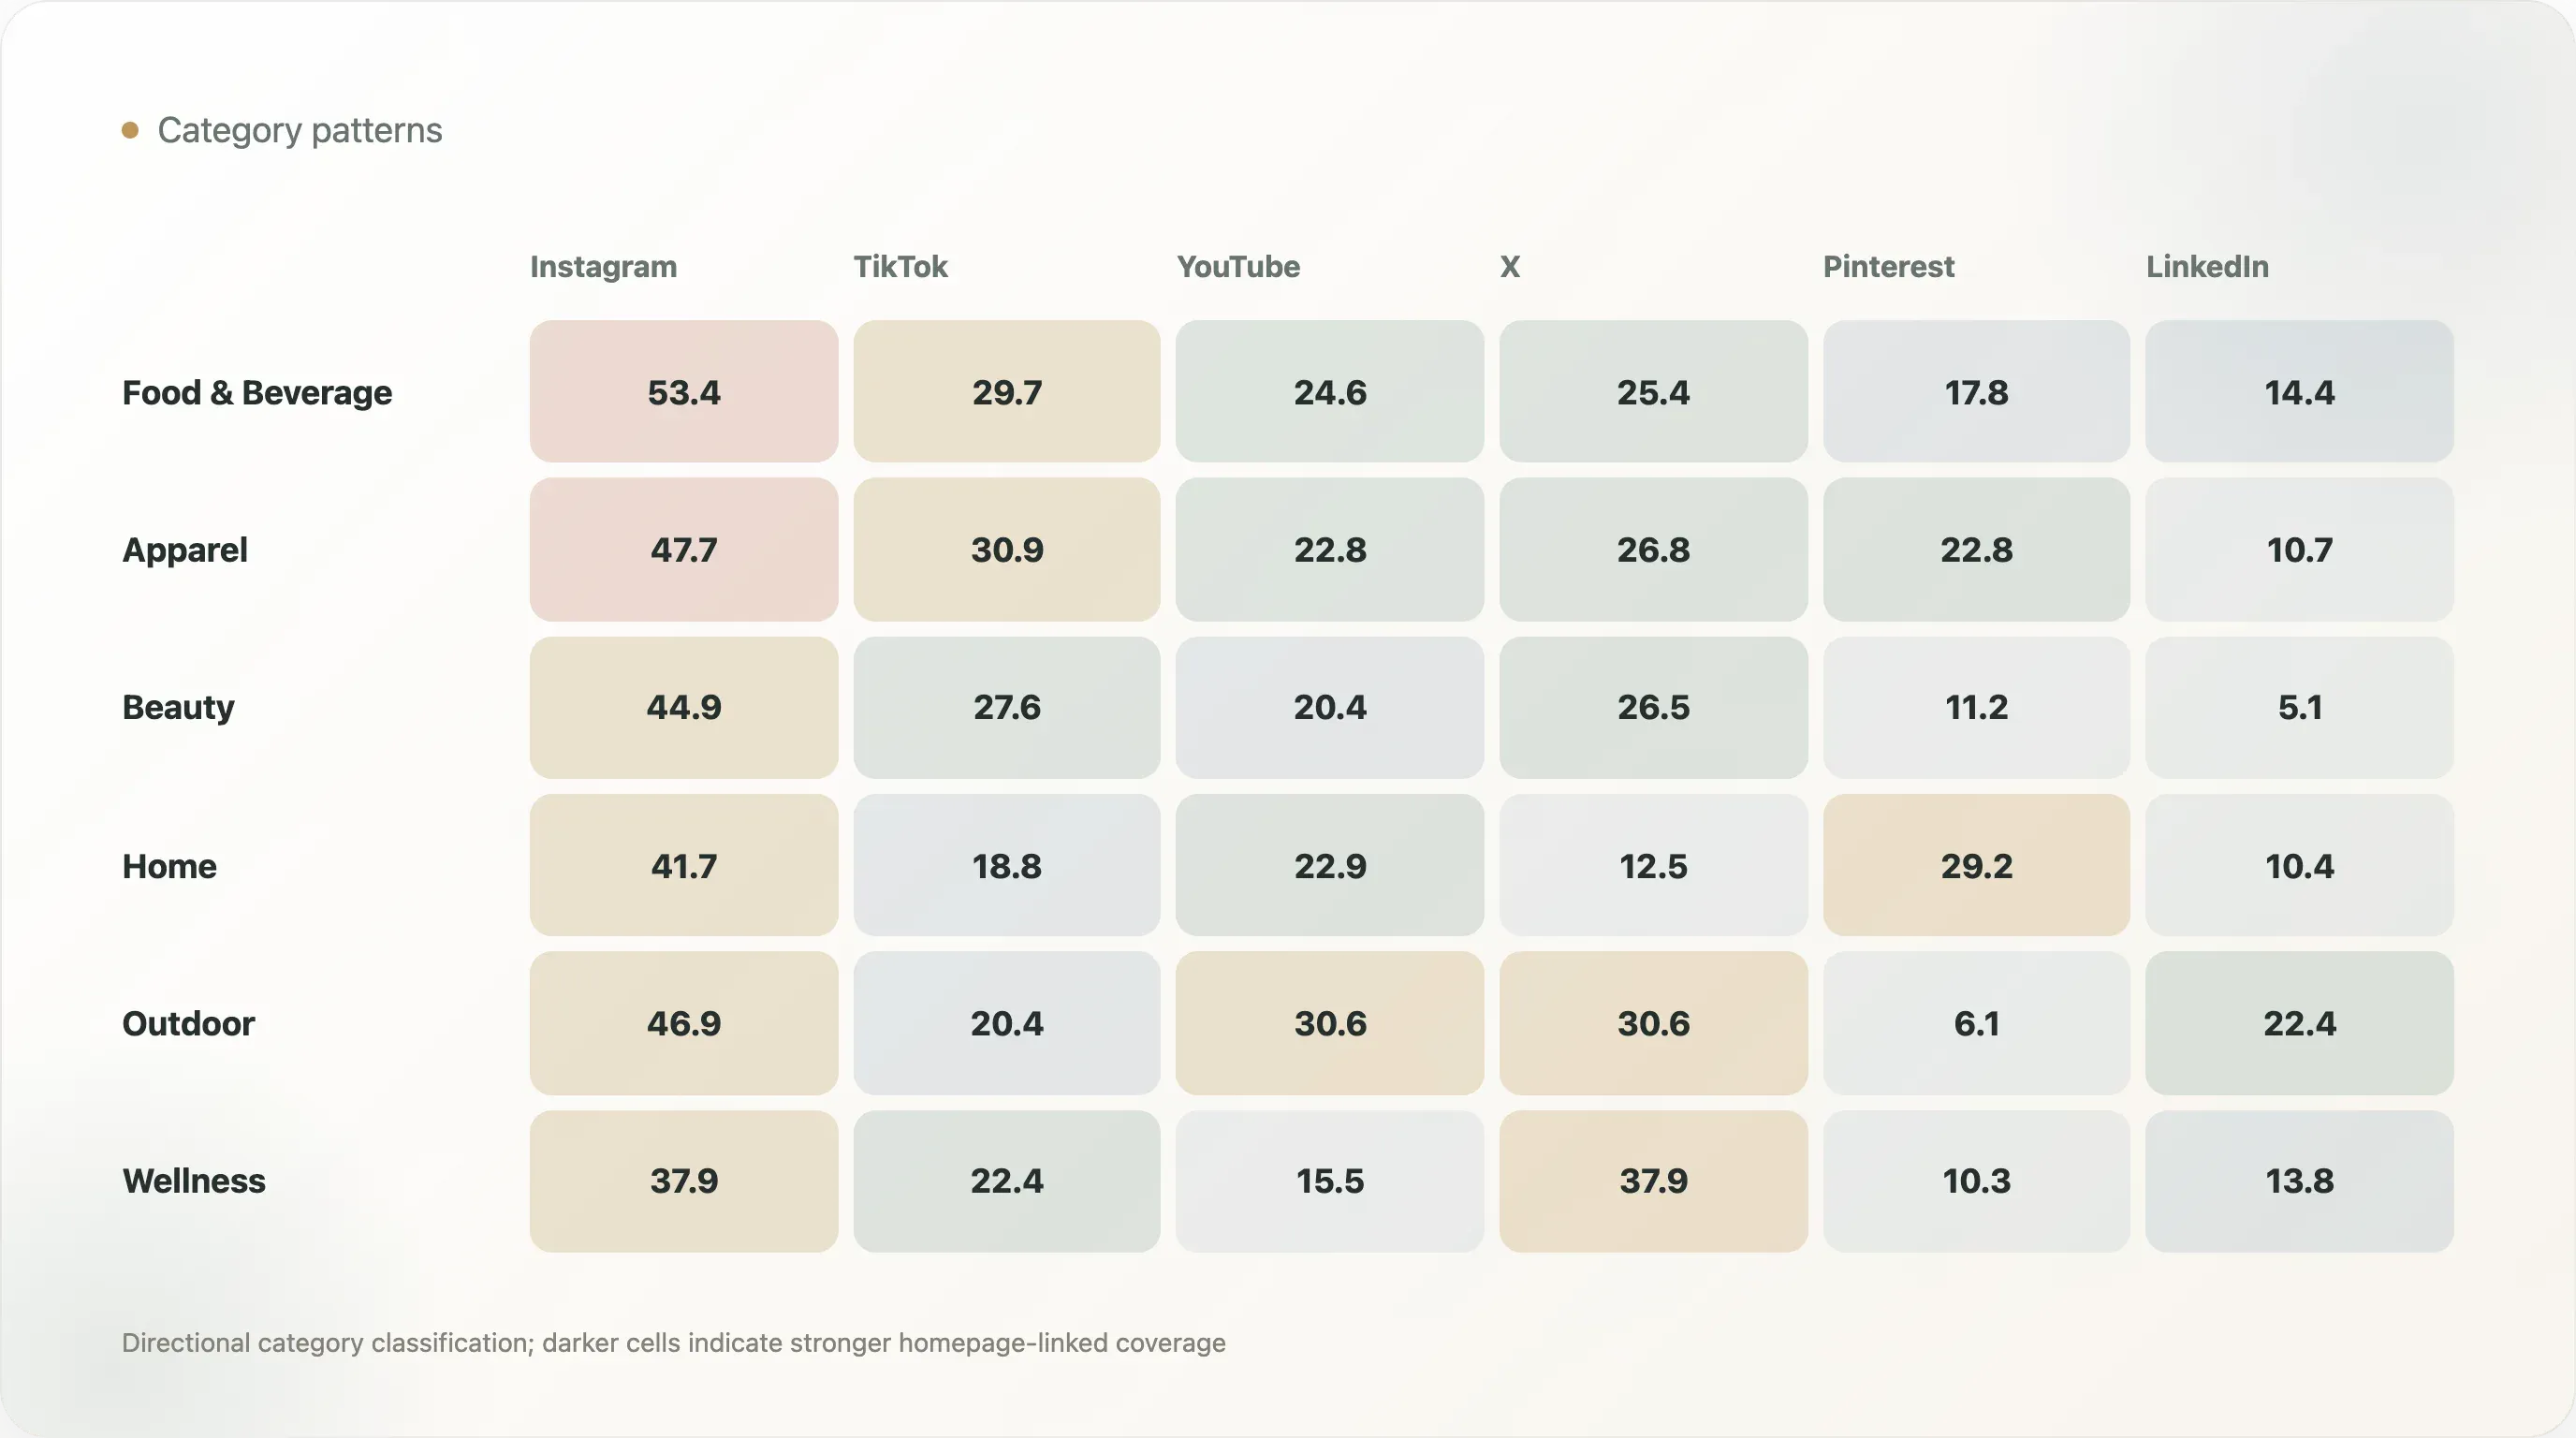
The category view matters even more. Food & Beverage has the highest Instagram coverage among the concrete categories shown here, at 53.4%. Apparel & Footwear has the strongest TikTok coverage, at 30.9%, and also a strong Pinterest rate at 22.8%. Home & Furniture is the clearest Pinterest category, at 29.2%. Outdoor & Sports leads on YouTube and X, both at 30.6%, which fits product education, performance proof, community, and real-world usage.
The head-versus-tail split is also useful because it corrects an easy assumption. More publicly visible brands are not dramatically more likely to expose Instagram or Facebook. The clearest gap is X, where head brands are at 32.1% and one-source tail brands are at 21.2%. TikTok also separates, at 26.8% for head brands versus 19.0% for tail brands. LinkedIn does not show the expected head-brand advantage in this dataset. That makes X a stronger visible maturity signal than LinkedIn in this homepage-link view.
This report is written for DTC social teams, ecommerce growth teams, newsletter authors, SEO writers, and media analysts who need original, caveated, citation-ready data. The central takeaway is simple: DTC social presence is narrower, less experimental, and more category-specific than the industry conversation often implies.
The Six Most Shareable Findings
-
Instagram is the top platform, but not universal. It appears on 38.5% of complete homepage samples, far below the idea that every DTC brand visibly routes users to Instagram.
-
X beats TikTok in homepage visibility. X appears on 23.0% of complete samples, compared with TikTok at 20.0% and YouTube at 19.9%. That does not mean X is more important for every brand, but it is a strong counterintuitive homepage-link finding.
-
Threads is almost absent. Only 4 of 1,238 complete samples visibly link to Threads, or 0.3%.
-
The visible-zero group is huge. 53.0% of complete homepage samples show no visible links to the tracked social platforms in static homepage markup. This is a visibility finding, not proof of no accounts.
-
Once brands expose social, they often expose a real matrix. Among brands with at least one visible social link, the average is 3.54 platforms.
-
Category beats generic best practice. Food is strongest on Instagram, Apparel is strongest on TikTok, Home is strongest on Pinterest, and Outdoor & Sports is strongest on YouTube and X.
1. What This Report Measures, and What It Does Not
This study measures homepage-linked social visibility. It answers a specific question: when someone or something crawls a DTC brand's homepage, which official social destinations are visible in the delivered page markup?
That is different from social activity. A brand can have a thriving TikTok account and still not link it from the homepage. A brand can use creators heavily without exposing a brand-owned social account. A brand can prioritize paid social and email capture over sending visitors away from the site. A brand can link social accounts only from a hamburger menu, a region-specific footer, a mobile-only element, a client-rendered component, or a separate contact page. All of those cases may be undercounted here.
Still, homepage-linked visibility is valuable because it reflects an owned-media decision. The brand controls its homepage. If a social platform is linked there, the brand is saying the platform is part of its public identity and visitor routing path. If it is not linked there, the platform may still matter, but the website is not making that handoff obvious in the crawled page.
This is also the kind of signal that many third parties see. Search engines, AI crawlers, SEO tools, competitive-intelligence tools, journalists, and newsletter authors often begin with public pages. If a brand wants its social ecosystem to be understood from the outside, public routing matters.
The report should therefore be used as a map of official-site social routing, not a scoreboard for social performance.
2. Platform Coverage: The Core DTC Matrix Is Narrower Than Expected
| Platform | Brands | Coverage |
|---|---|---|
| 477 | 38.5% | |
| 461 | 37.2% | |
| X | 285 | 23.0% |
| TikTok | 248 | 20.0% |
| YouTube | 246 | 19.9% |
| 172 | 13.9% | |
| 166 | 13.4% | |
| Threads | 4 | 0.3% |
Instagram is the leading visible destination at 38.5%. That makes sense. It remains the most natural public social surface for many DTC brands: product display, lifestyle imagery, social proof, launches, creator reposts, and brand world. But the number is not close to universal. For marketers who assume Instagram is always the public default, 38.5% is a useful reality check.
Facebook follows at 37.2%. Its near parity with Instagram suggests that the Meta layer remains bundled in many official social matrices. Facebook may not be the channel marketers talk about most, but it persists as infrastructure: retargeting, older audience segments, community pages, account linkage, customer service, and brand legitimacy.
The counterintuitive result is X. X appears on 23.0% of complete homepage samples, higher than TikTok or YouTube in this view. This does not mean X is a better growth channel for every DTC team. It does mean X remains a durable official-link destination for a meaningful subset of brands. DTC teams may use it for customer support, public response, press-facing communication, founder voice, category commentary, or community.
TikTok appears on 20.0%. That is high enough to confirm that TikTok belongs in the modern DTC conversation, but low enough to reject the idea that TikTok is already a universal homepage default. TikTok may be more active than visible because many brands operate through creators, paid media, affiliate accounts, or TikTok Shop without pushing homepage visitors to a brand-owned TikTok profile.
YouTube appears on 19.9%, nearly identical to TikTok. That tie is one of the most useful findings for content teams. TikTok and YouTube require different production models. TikTok rewards speed, trend fluency, and high-volume testing. YouTube rewards durable search intent, product education, thumbnails, structure, and content that can work for months or years. The homepage-link data suggests DTC brands still value durable video almost as much as short-form discovery.
Pinterest appears on 13.9% and LinkedIn on 13.4%. These are minority platforms in the aggregate, but they should not be dismissed. Pinterest can matter deeply in visual planning categories. LinkedIn can matter for hiring, employer brand, investors, partnerships, and executive credibility. Aggregate ranking hides category fit.
Threads appears on 0.3%, or just 4 brands. The fair interpretation is narrow: Threads is almost absent as a homepage-linked brand destination in this sample on May 11, 2026. The data does not prove that brands have no Threads accounts. It shows that brands are not generally treating Threads as a standard official website link.
3. The Visible-Zero Finding: A Big Gap With Big Caveats
| Visible platforms | Brands | Share |
|---|---|---|
| 0 | 656 | 53.0% |
| 1 | 86 | 6.9% |
| 2 | 70 | 5.7% |
| 3 | 117 | 9.5% |
| 4 | 133 | 10.7% |
| 5 | 117 | 9.5% |
| 6 | 48 | 3.9% |
| 7 | 11 | 0.9% |
The visible-zero number is the report's biggest and riskiest finding. 656 complete homepage samples show no visible links to the tracked platforms, or 53.0% of the sample.
It is risky because it can be overstated. It does not mean 53% of DTC brands have no social presence. It means the crawler did not find tracked social links in the delivered homepage markup. That distinction matters. Client-rendered footers may not appear in the static HTML. Some sites expose social links only after interaction. Some regional homepages differ. Some brands prioritize creator accounts, retail channels, marketplaces, SMS, email, or paid social over brand-owned social routing.
Even with those caveats, the number is operationally useful. It says that homepage-to-social routing is not as consistently managed as social discourse would suggest. DTC marketers spend heavily to bring people to their websites. If those visitors want to verify the brand on Instagram, watch product videos on YouTube, browse inspiration on Pinterest, or check public voice on X, the website should make the path simple when those channels matter.
This is not an argument that every brand should add every icon. A homepage full of inactive social icons can hurt credibility. The better argument is that every brand should make a deliberate decision. If a channel is active and strategically important, it should be easy to find. If a channel is inactive or not part of the brand's current strategy, it should not sit in the footer as a stale badge.
The distribution also reveals a split. The average complete sample has 1.66 visible platforms, but that average hides two different populations. Among the 582 brands with at least one visible platform, the average rises to 3.54 platforms. The visible-social brands are often serious about a matrix.
The practical center is 3 to 5 visible platforms, covering 367 brands. That is the most realistic DTC social matrix range: broad enough to include Meta, a discovery channel, and a durable or category-specific channel, but narrow enough to maintain.
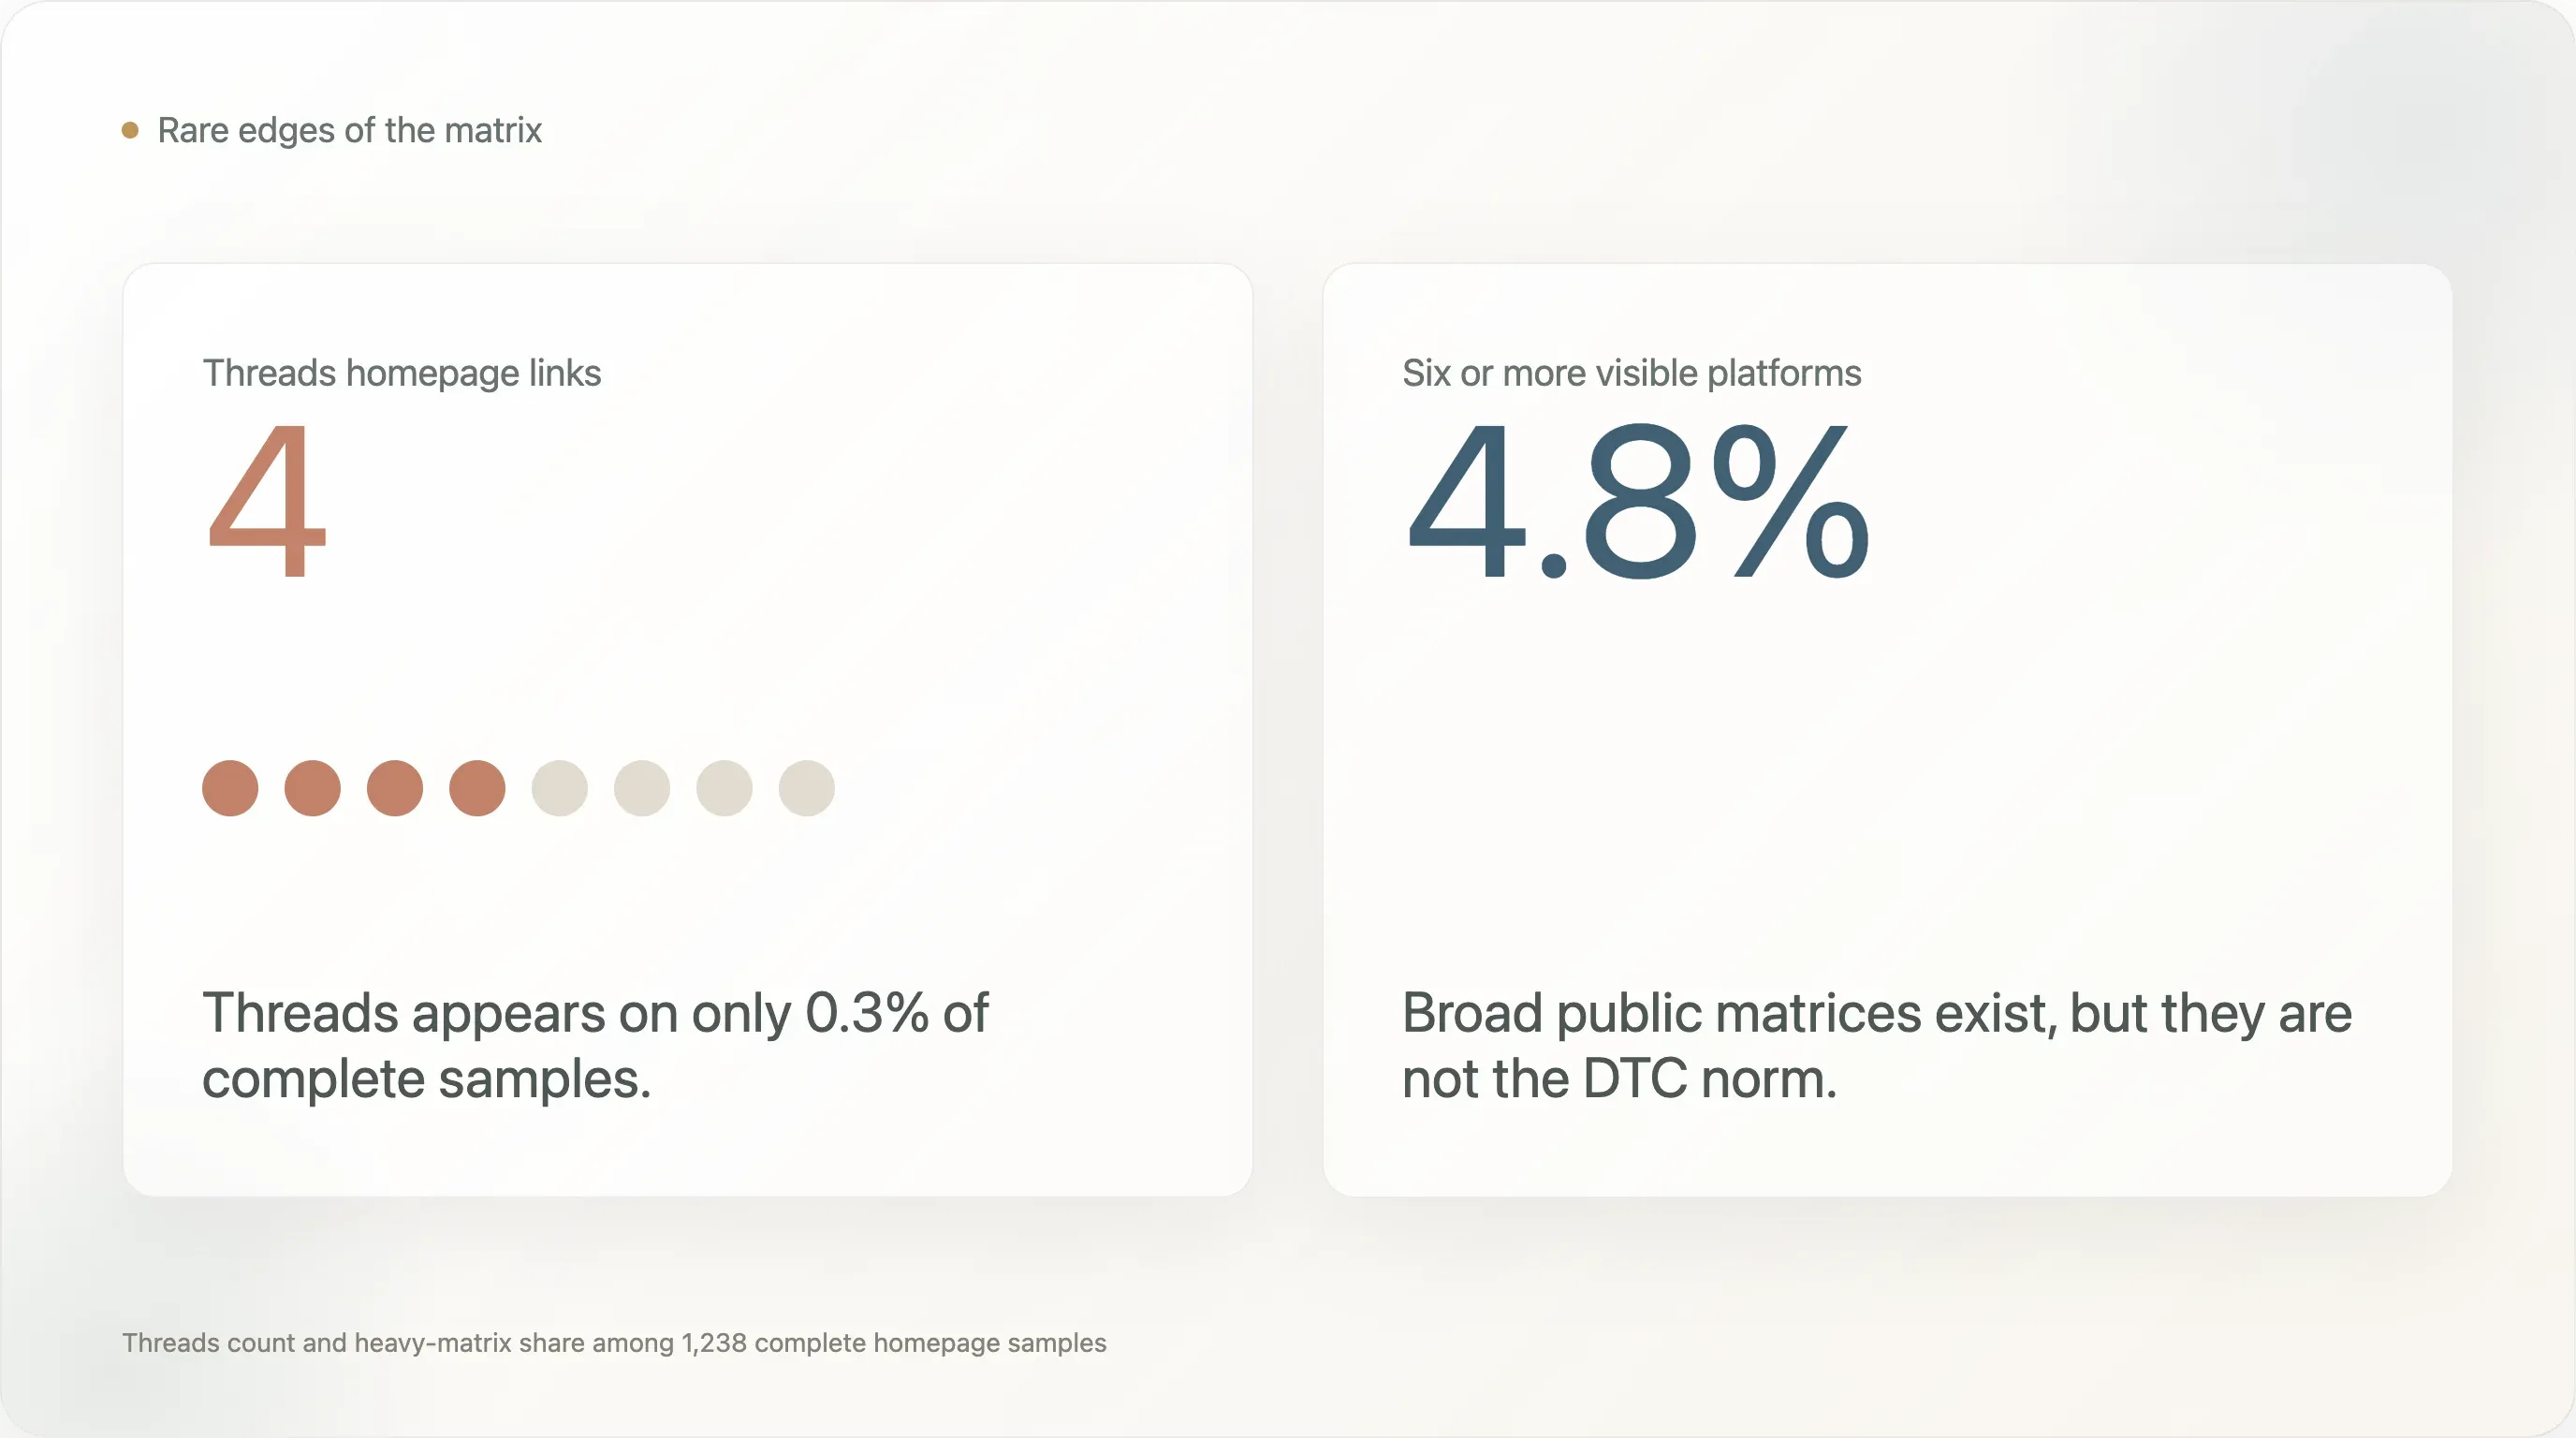
Heavy matrices are rare. Only 59 brands, or 4.8%, show six or more platforms. Examples of broad visible matrices in the crawl include Who Gives A Crap, Dollar Shave Club, Rebecca Minkoff, Dr. Squatch, Athletic Greens, Vuori, Curology, Ruggable, Babylist, and Rare Beauty. These are useful positive examples because they show that a broad matrix is possible, but not the norm.
4. Platform Pairs: Meta Is the Base, the Second Layer Is Fragmented
| Pair | Brands | Coverage |
|---|---|---|
| Facebook + Instagram | 418 | 33.8% |
| Instagram + TikTok | 247 | 20.0% |
| Instagram + YouTube | 225 | 18.2% |
| Facebook + X | 223 | 18.0% |
| Instagram + X | 222 | 17.9% |
| Facebook + TikTok | 220 | 17.8% |
| Facebook + YouTube | 220 | 17.8% |
| Instagram + Pinterest | 166 | 13.4% |
| Facebook + Pinterest | 162 | 13.1% |
| X + YouTube | 136 | 11.0% |
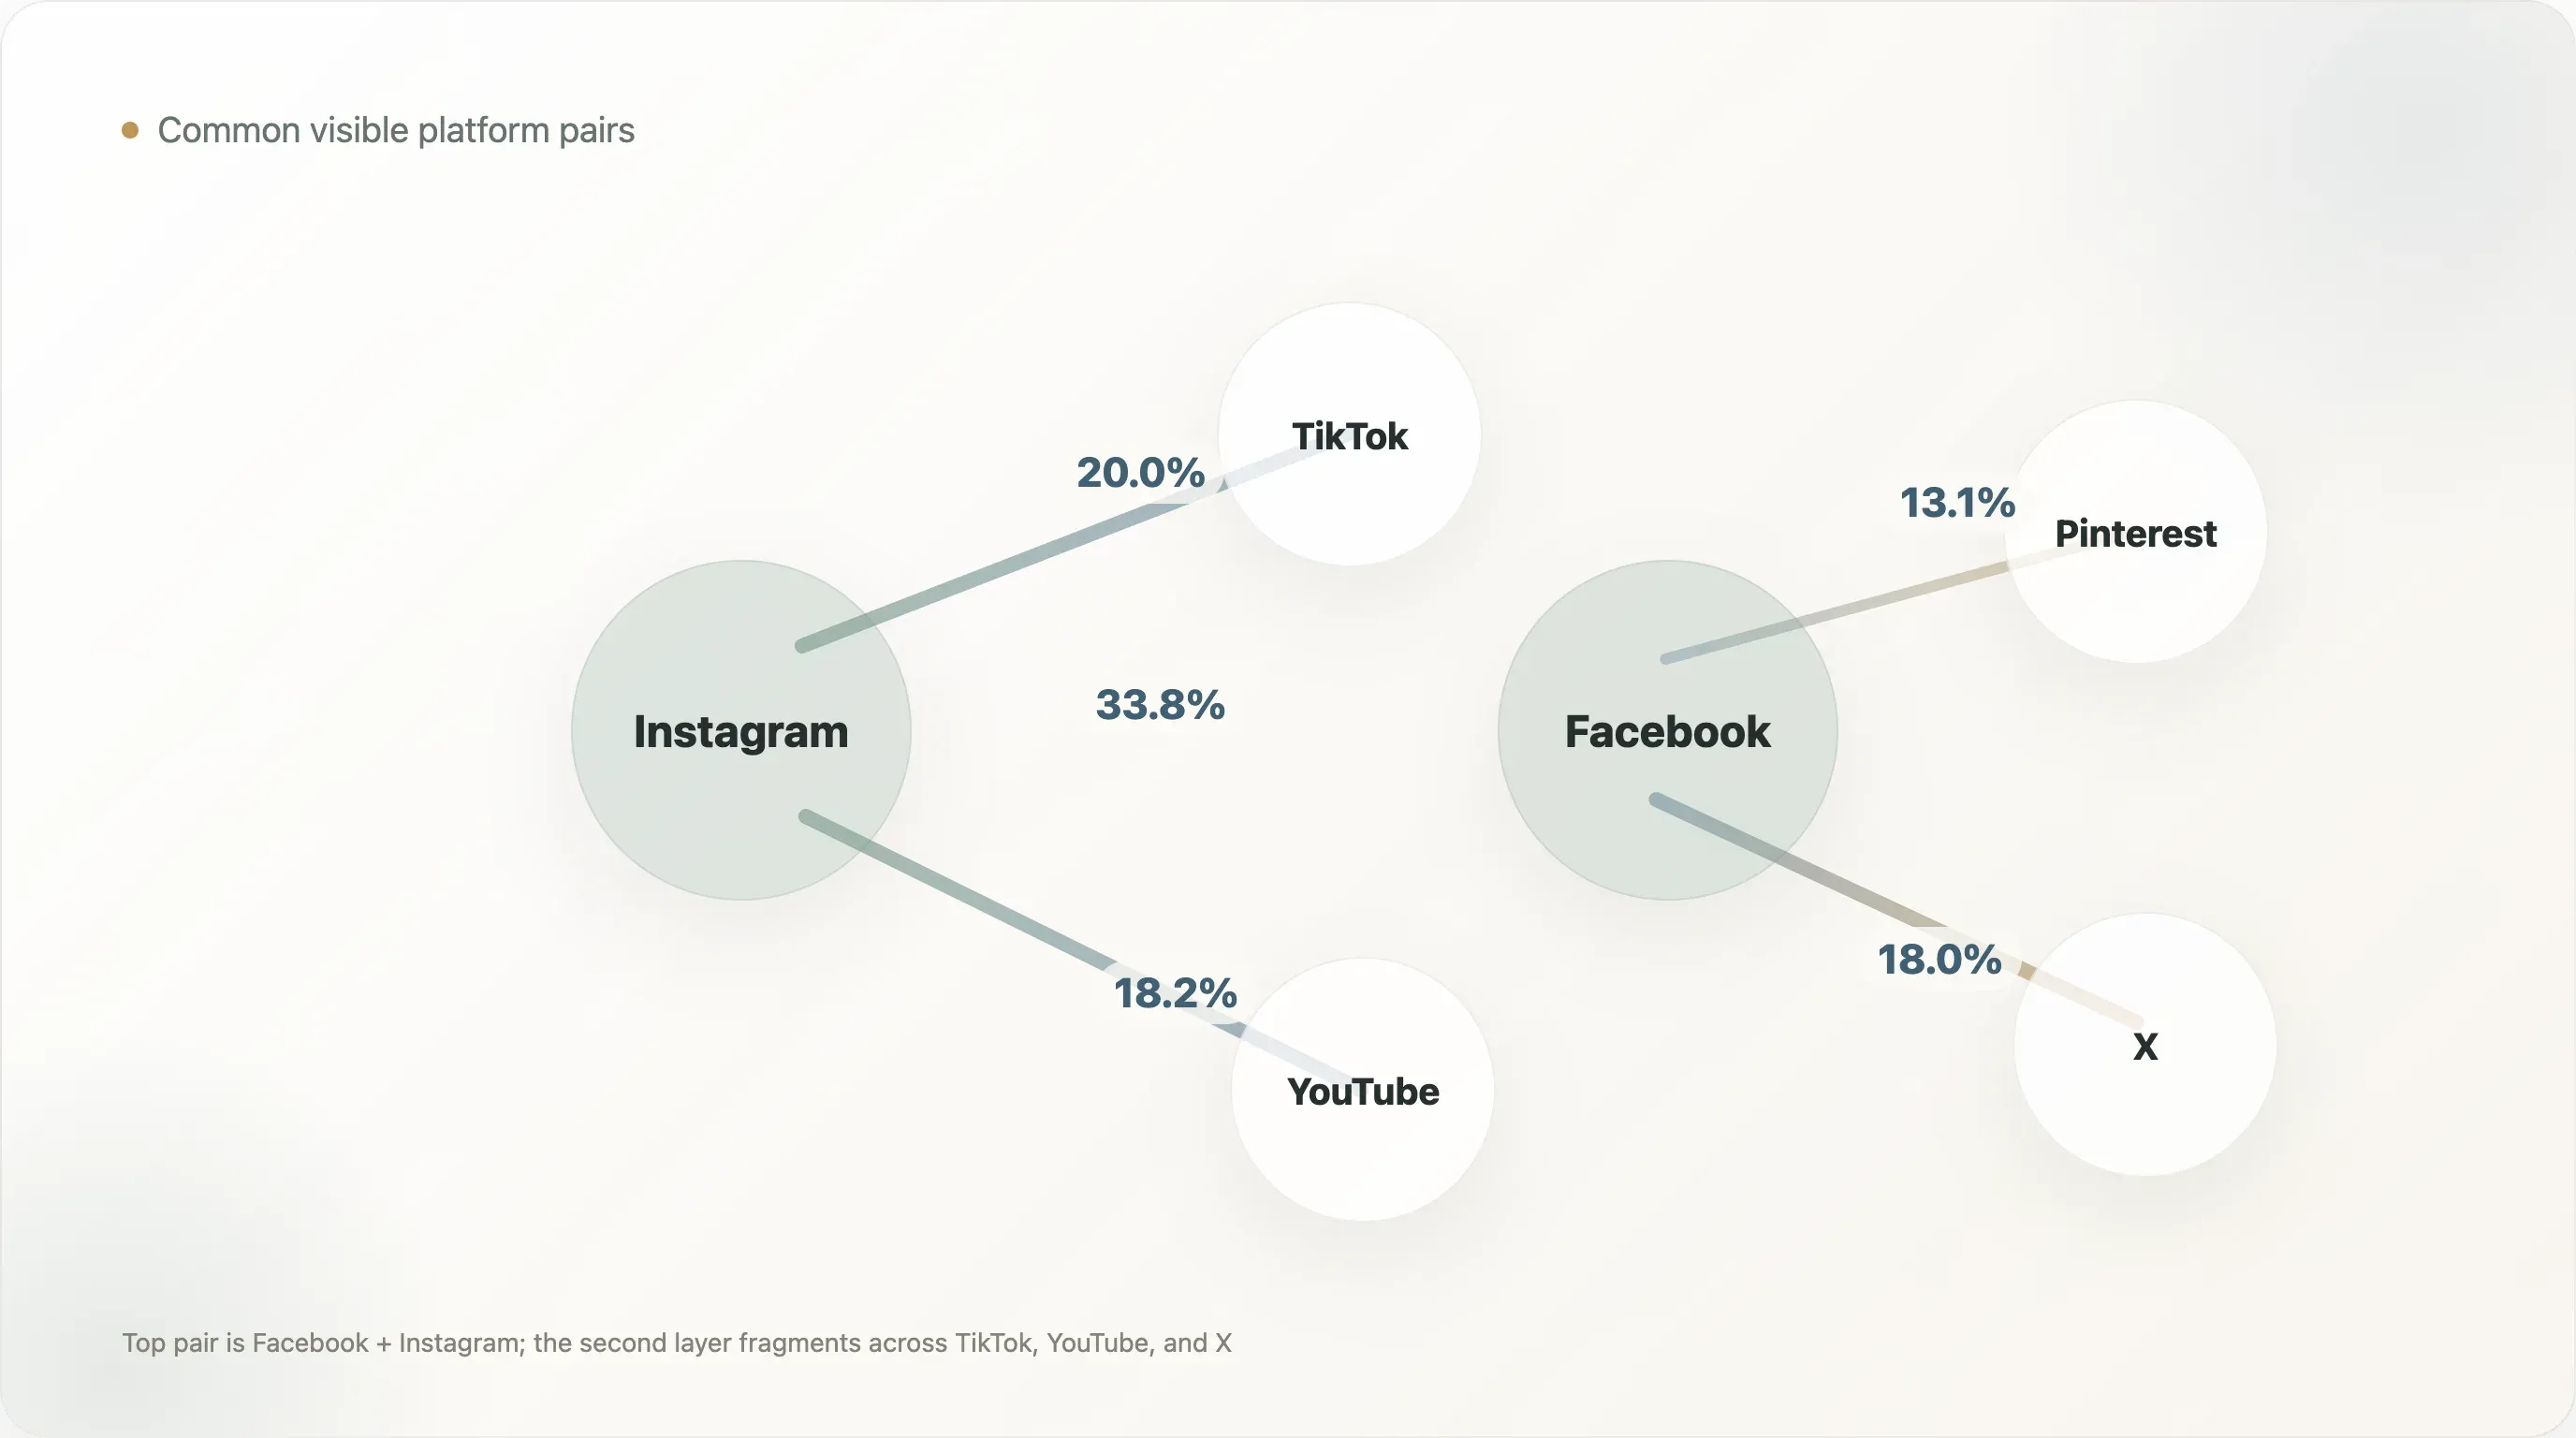
The top pair is unsurprising and important: Facebook + Instagram appears on 33.8% of complete homepage samples. This is the visible DTC social base. It reflects account bundling, shared Meta infrastructure, brand familiarity, and the fact that many teams still treat Meta properties as the first layer of owned social.
The second pair, Instagram + TikTok, appears on 20.0%. This pair represents the modern visual-discovery stack: Instagram for brand polish and social proof, TikTok for creator-native discovery and fast creative testing. A brand that can operate both well has to speak two different creative languages. Instagram rewards consistency and identity. TikTok rewards speed, format fluency, and the ability to make the product feel native to the feed.
The third pair, Instagram + YouTube, appears on 18.2%. This is a different strategic signal. YouTube is not just another social icon. It is a product-education library, search surface, support asset, consideration tool, and sometimes a community hub. For brands with explainable products, YouTube can keep working after a TikTok has stopped moving.
X appears in two top-five pairs: Facebook + X at 18.0% and Instagram + X at 17.9%. This shows X is not an isolated alternative to Meta. It sits alongside the core matrix. Its role is usually public voice, customer response, press, category conversation, or founder/executive communication.
Pinterest appears in two top-ten pairs: Instagram + Pinterest at 13.4% and Facebook + Pinterest at 13.1%. For most DTC categories, Pinterest is not a universal default. But for visual planning categories, these pairings matter. Pinterest works when customers save, compare, revisit, or plan.
The big conclusion from pair data is that the second layer is fragmented. TikTok, YouTube, and X are all competing for the next slot after Meta. A generic "add TikTok" recommendation is too simple. The right second layer depends on product complexity, creative capacity, audience age, purchase journey, and category behavior.
5. Category Patterns: Food Owns Instagram, Apparel Owns TikTok, Home Owns Pinterest
Category classification is directional, not perfect. The classifier is keyword-based, and many brands are ambiguous or multi-category. Still, among concrete categories with enough examples, the patterns are useful.
| Category | n | TikTok | YouTube | X | ||||
|---|---|---|---|---|---|---|---|---|
| Food & Beverage | 118 | 53.4% | 50.8% | 29.7% | 24.6% | 25.4% | 17.8% | 14.4% |
| Apparel & Footwear | 149 | 47.7% | 43.0% | 30.9% | 22.8% | 26.8% | 22.8% | 10.7% |
| Beauty & Skincare | 98 | 44.9% | 39.8% | 27.6% | 20.4% | 26.5% | 11.2% | 5.1% |
| Home & Furniture | 48 | 41.7% | 39.6% | 18.8% | 22.9% | 12.5% | 29.2% | 10.4% |
| Outdoor & Sports | 49 | 46.9% | 44.9% | 20.4% | 30.6% | 30.6% | 6.1% | 22.4% |
| Health & Wellness | 58 | 37.9% | 34.5% | 22.4% | 15.5% | 37.9% | 10.3% | 13.8% |
Food & Beverage has the highest Instagram coverage in this table at 53.4%. That fits the category. Food and beverage products are naturally visual. They can be shown through rituals, recipes, packaging, occasions, ingredients, creators, and lifestyle context. Instagram is a strong brand-world surface for a category where appetite, aesthetics, and daily habit all matter.
Apparel & Footwear has the highest TikTok coverage at 30.9% and a strong Pinterest rate at 22.8%. That combination reflects the category's discovery path. A customer may discover a product through a short-form try-on, styling video, haul, or creator post, then save outfit ideas or product references for later. Apparel is one of the clearest categories where TikTok and Pinterest can play different roles in the same journey.
Beauty & Skincare is active across Instagram and TikTok, but it does not dominate either platform in this homepage-link view. Instagram appears on 44.9%, TikTok on 27.6%, and YouTube on 20.4%. This may surprise marketers because beauty is one of the most social categories in practice. The likely explanation is that brand-owned homepage links capture only part of the beauty ecosystem. Beauty often flows through creators, affiliates, retailers, tutorials, earned media, and platform-native discovery that may not be fully reflected in footer links.
Home & Furniture is the clearest Pinterest category. Its Pinterest coverage is 29.2%, the highest in the table. That is exactly where Pinterest should matter: rooms, design ideas, renovation planning, seasonal refreshes, product comparison, gifting, and long consideration windows. Home teams should be careful not to underweight Pinterest just because its aggregate DTC coverage is only 13.9%.
Outdoor & Sports leads the table on YouTube at 30.6% and also reaches 30.6% on X. This is one of the strongest category-specific findings. Outdoor and sports products often need demonstration, performance proof, setup, education, community, and real-world credibility. YouTube is a natural place for that. X can support community conversation, product drops, athlete or founder voice, and public updates.
Health & Wellness has X and Instagram both at 37.9% in this table. That is unusual and worth further research. Health-related brands face trust, evidence, compliance, and education burdens. X may function as a public conversation and credibility channel for certain brands, while Instagram handles lifestyle and product identity.
The operator lesson is clear: category beats generic best practice. The right matrix for a food brand is not the right matrix for a furniture brand. The right matrix for apparel is not the right matrix for outdoor equipment. Social strategy should begin with the product's discovery behavior, not with a universal channel checklist.
6. Head, Middle, and Tail: X Is the Clearest Visibility Separator
The head-versus-tail split uses source visibility, not revenue. A head brand appears in at least three source collections. A middle brand appears in two. A tail brand appears in one. This is a proxy for public visibility in the assembled ecommerce source universe, not a sales ranking.
| Source-visibility group | n | TikTok | YouTube | X | Threads | ||||
|---|---|---|---|---|---|---|---|---|---|
| Head: source_count >= 3 | 112 | 40.2% | 40.2% | 26.8% | 20.5% | 32.1% | 16.1% | 11.6% | 0.0% |
| Middle: source_count = 2 | 159 | 38.4% | 38.4% | 21.4% | 17.6% | 27.7% | 17.6% | 16.4% | 0.0% |
| Tail: source_count = 1 | 967 | 38.4% | 36.7% | 19.0% | 20.2% | 21.2% | 13.0% | 13.1% | 0.4% |
The clearest gap is X. Head brands show 32.1% X coverage, compared with 21.2% for tail brands. That is a 10.9 percentage-point difference. In this homepage-link view, X is the strongest visible separator.
This does not mean every mature DTC brand needs X. It means that among brands with more public source visibility, X is more likely to be part of the official website-linked social matrix. That makes sense. Publicly visible brands may have more press exposure, more customer-service volume, more founder voice, more category conversation, or more need to respond in public.
TikTok also separates. Head brands are at 26.8%, while tail brands are at 19.0%. That suggests TikTok is moving from experiment to official social layer among more visible brands. The gap is meaningful but not universal.
Instagram and Facebook barely separate. Head brands are at 40.2% on both. Tail brands are at 38.4% for Instagram and 36.7% for Facebook. These are small differences. Meta presence is therefore not a strong head-brand differentiator. It is closer to baseline infrastructure.
YouTube also does not separate much: 20.5% for head brands and 20.2% for tail brands. That may seem surprising because YouTube is harder to produce. But it suggests YouTube visibility may be driven more by product education needs than by public brand visibility. A smaller brand with a complicated product may need YouTube more than a larger brand with a simple product.
LinkedIn is the correction. It does not show a head-brand advantage in this completed data. Head brands are at 11.6%, while tail brands are at 13.1%. LinkedIn can still matter for specific brands with hiring, investor, press, or executive communication needs, but this dataset does not support calling LinkedIn a broad DTC maturity badge.
7. Platform-by-Platform Operator Read
Instagram remains the top visible platform, but 38.5% coverage means it is not universal in the homepage-link layer. For brands that use Instagram well, it is still the fastest way to communicate brand world, product desirability, social proof, UGC, creator relationships, and launches.
The operator risk is treating Instagram as the whole social strategy. Instagram is best understood as the visual identity layer. It should be paired with the right second layer: TikTok for fast discovery, YouTube for education, Pinterest for planning, or X for public voice.
Positive broad-matrix examples such as Vuori, Rare Beauty, Ruggable, and Who Gives A Crap show Instagram as part of a broader social system, not a standalone destination.
Facebook's 37.2% visible coverage is close to Instagram's. It is less fashionable as a growth talking point, but it remains durable infrastructure. Many brands likely keep Facebook for audience continuity, ads-adjacent account structure, community, retargeting, and customer familiarity.
The key is not whether Facebook is exciting. The key is whether it still serves a real audience or operational purpose. If the answer is yes, keep it visible. If the account is inactive and the audience has moved elsewhere, do not keep it only because it feels traditional.
TikTok
TikTok appears on 20.0% of complete homepage samples and is strongest in Apparel & Footwear among the categories shown. It has clearly become part of the modern DTC toolkit, but homepage visibility is far from universal.
TikTok requires a content engine, not just an icon. Brands need volume, format fluency, creator understanding, fast editing, and comfort with less polished material. The website link is only useful if the account feels alive.
For apparel, beauty, food, personal care, and youth-driven categories, TikTok may be closer to a required discovery layer. For long-consideration or technical categories, TikTok may still matter, but YouTube or Pinterest may provide better durable value.
YouTube
YouTube's 19.9% coverage is nearly equal to TikTok's. That is one of the most important corrections in the report. DTC video is not only short-form. Many brands still need long-lived video assets.
YouTube is strongest when the product benefits from education: setup, recipe, routine, performance proof, troubleshooting, comparison, installation, styling, or customer transformation. Outdoor & Sports leads the table on YouTube at 30.6%, which fits the platform's strengths.
The content cost is higher than TikTok, but the asset life is longer. A strong YouTube video can support search, product pages, post-purchase emails, support replies, and sales conversations for years. For operators with limited creative bandwidth, fewer durable YouTube assets may be more useful than constant short-form churn.
X
X appears on 23.0% of complete samples and is the clearest head-versus-tail separator. That makes it more important than many DTC marketers might expect from homepage data alone.
X is not a safe generic channel. It is a public-voice channel. It works best when a brand has something to say, a founder voice, a category point of view, customer-service needs, launch news, community conversation, or press relevance. A bland X account adds little. A careless X account can create risk.
For brands with the right voice and governance, X can be a maturity signal. For brands without those, it may be better to avoid adding another channel just to match a checklist.
Pinterest appears on 13.9% overall but is much stronger in specific categories, especially Home & Furniture at 29.2% and Apparel & Footwear at 22.8%.
Pinterest is not a conversation channel. It is a planning and discovery surface. It matters when customers save ideas, collect visual references, plan rooms, compare looks, prepare gifts, or revisit ideas later. That makes it more durable than many social platforms for the right categories.
For home, furniture, apparel, beauty, wedding, gifting, and lifestyle categories, Pinterest deserves a real audit before being dismissed.
LinkedIn appears on 13.4% overall. It is not a broad DTC growth default in this sample. It is better understood as corporate infrastructure: hiring, employer brand, leadership, investor communication, partnerships, and credibility.
The head-versus-tail data does not support LinkedIn as a universal maturity badge. Add it when the brand has a reason to speak to employees, candidates, partners, investors, press, or professional communities. Do not add it just because the brand is getting bigger.
Threads
Threads appears on 0.3% of complete homepage samples. That is close to zero in homepage-linked visibility.
This creates two possible readings. Conservative teams can treat Threads as optional until more brands visibly adopt it. Experimental teams can treat the low number as an early-adopter opening, especially if they already have Instagram content and can test lightweight posting. Astrid appeared in the crawl as one of the rare broad-matrix examples that included Threads, which shows that some brands are experimenting, but the behavior is not mainstream.
8. Positive Brand Patterns Worth Studying
This report avoids negative brand callouts. The goal is not to name brands that are missing a channel. The goal is to show useful positive patterns.
Broad visible matrix examples: Brands such as Who Gives A Crap, Dollar Shave Club, Rebecca Minkoff, Dr. Squatch, Vuori, Curology, Babylist, Ruggable, and Rare Beauty show six or more visible social destinations in the crawl. This is not automatically better than a focused matrix, but it shows a deliberate public routing system.
Video and education-oriented examples: Brands with visible YouTube as part of a broader matrix, such as Dr. Squatch, Athletic Greens, Curology, Ruggable, and Babylist, show how YouTube can sit alongside short-form and social-proof platforms. The value of YouTube is highest when products need education, demonstration, or reassurance.
Pinterest-aware examples: Brands such as Rebecca Minkoff, Ruggable, Babylist, and Rare Beauty appeared with Pinterest as part of a broader social set. That is useful because Pinterest often gets under-discussed in generic DTC social advice, even though it can be meaningful in fashion, home, baby, beauty, and gifting contexts.
Public voice examples: Brands such as Who Gives A Crap, Dollar Shave Club, Dr. Squatch, and Vuori appeared with X in broad matrices. Again, this does not mean every brand should use X. It means brands with distinctive voice, customer-service needs, or public conversation can treat X as part of the official matrix.
The practical lesson is not "copy these brands exactly." It is to study the logic of the matrix. A broad matrix should map to real content capacity and audience need. A focused matrix should be intentional, not accidental.
9. A Practical Social Matrix Playbook
Start with the website audit. Open the homepage, footer, navigation, mobile menu, and regional homepages. Confirm which social links are visible, current, official, and active. Remove dead links. Fix links that point to old handles. Make sure mobile users can find the same destinations.
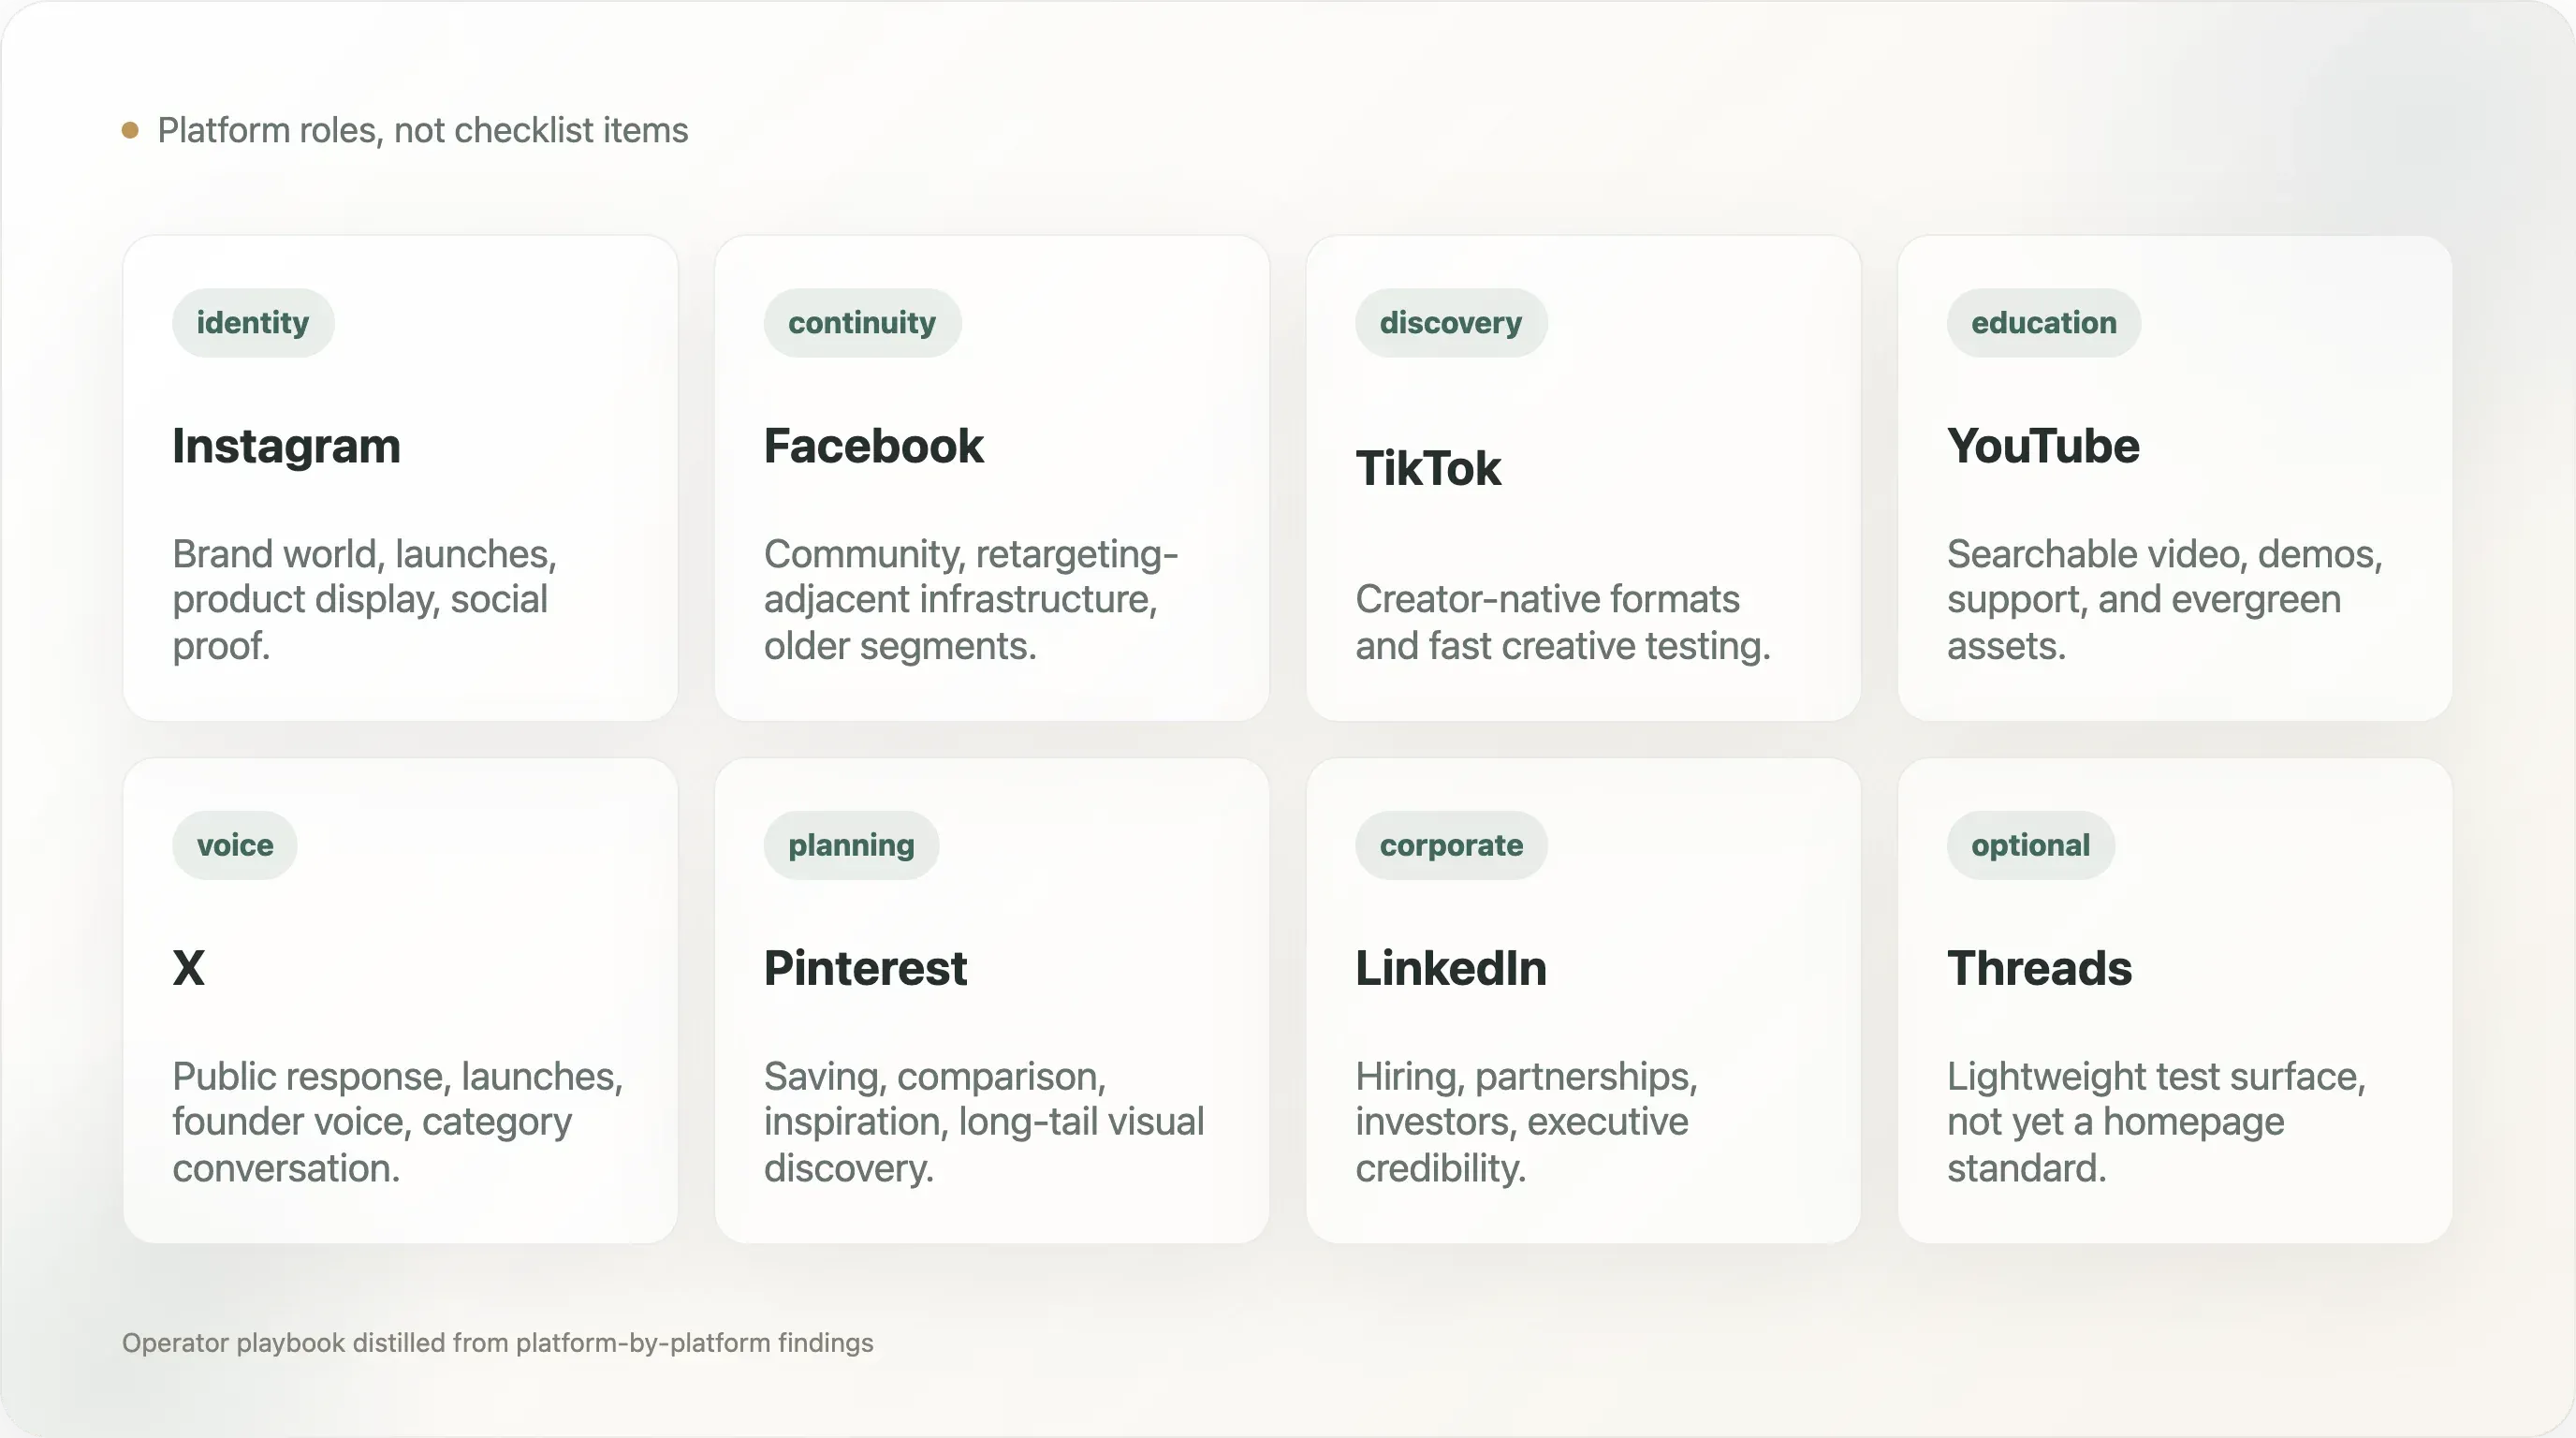
Then define the role of each channel:
Instagram: brand world, social proof, product display, creator reposts.
Facebook: continuity, community, retargeting-adjacent infrastructure, older audience segments.
TikTok: fast discovery, creator-native formats, high-volume creative testing.
YouTube: product education, search intent, support, evergreen video assets.
Pinterest: planning, saving, visual discovery, long-tail inspiration.
X: public voice, launches, customer response, press-facing conversation.
LinkedIn: employer brand, hiring, executive credibility, investor and partner communication.
Threads: optional test surface, not yet a homepage standard in this sample.
Next, choose the matrix by category:
Food & Beverage should usually treat Instagram as a core channel and consider TikTok for discovery, YouTube for recipes or education, and X only if the brand has public voice or community.
Apparel & Footwear should treat Instagram and TikTok as core, then evaluate Pinterest for outfit planning and YouTube for styling, founder story, fit, or product education.
Beauty & Skincare should not rely on homepage links alone to understand the ecosystem. Creator distribution may matter more than official profile links. Still, Instagram, TikTok, and YouTube should be evaluated carefully.
Home & Furniture should give Pinterest serious attention. It is one of the clearest category-platform fits in the data.
Outdoor & Sports should evaluate YouTube earlier than most categories because product demonstration and education are often central to purchase confidence.
Health & Wellness should treat trust and compliance carefully. The right mix may include Instagram for identity, email for education, YouTube for explanations, and X only when the brand can manage public conversation responsibly.
Finally, match channel count to operating capacity. The most common active range is 3-5 visible platforms. A small team should not maintain seven public channels unless each has a clear purpose and owner. A brand with one strong social channel may be better off adding one durable channel well than adding four weak ones.
10. Why Content Marketers and SEO Writers Should Care
This dataset is useful for content creators because it challenges generic assumptions with specific numbers. Instead of writing "DTC brands are all on TikTok," a stronger claim is: in this homepage-link sample, TikTok appears on 20.0% of complete DTC brand homepages, nearly tied with YouTube at 19.9% and behind X at 23.0%.
Instead of writing "Threads is the next big brand platform," a stronger claim is: Threads appears on only 0.3% of complete homepage samples in this DTC crawl.
Instead of writing "every brand should be on every platform," a stronger claim is: among brands with visible social links, the average matrix is 3.54 platforms, while only 4.8% of the full sample shows six or more platforms.
Instead of writing "Pinterest is dead," a stronger claim is: Pinterest appears on 29.2% of Home & Furniture homepages in the category table, more than double its aggregate 13.9% coverage.
These are better content angles because they are specific, caveated, and useful. They also generate follow-up stories: TikTok versus YouTube, X as a maturity signal, category-specific social matrices, the homepage social-link gap, and whether Threads has any real DTC brand adoption.
Methodology
The starting pool contained 1,597 candidate DTC brands assembled from public ecommerce and DTC source collections, including tool case-study libraries, Shopify ecosystem sources, and public DTC indexes. Of those, 1,431 brands resolved to domains. The report uses 1,238 complete homepage samples collected on May 11, 2026.
For each complete homepage sample, the analysis extracted links from the homepage markup and matched them against profile URL patterns for Instagram, Facebook, TikTok, YouTube, X, Pinterest, LinkedIn, and Threads. The measurement is binary by platform: a platform link was either visible in the homepage snapshot or it was not.
The report excludes share links, generic platform pages, and non-profile paths where possible. It does not manually review every social account. It does not collect follower counts, post frequency, engagement, paid social spend, creator content, TikTok Shop presence, affiliate activity, or social referral traffic.
Category labels are rule-based and directional. They are useful for broad platform-pattern comparison, especially where sample sizes are above 40, but they are not a perfect taxonomy. Some brands span multiple categories, and many brands fall into an "Other" bucket not emphasized in the category section.
The source-visibility split is also directional. It groups brands by how many independent source collections they appeared in. It is not a revenue, funding, traffic, or awareness ranking.
Caveats for Citation
-
This is homepage-linked visibility, not social activity. A brand may be active on a platform without linking to it from the homepage.
-
The visible-zero number is likely an overcount of true social absence. Client-rendered footers, menus requiring interaction, regional pages, and links outside the homepage can be missed.
-
The sample is not a full DTC census. It is biased toward brands visible in ecommerce tool ecosystems and public DTC lists. Cite it as a sample, not as total industry market share.
-
Platform links do not indicate account quality. The crawl does not distinguish active, inactive, large, small, strong, or weak accounts.
-
Creator-led distribution is not captured. Many brands, especially in beauty, apparel, and food, may drive social demand through creators or affiliates rather than brand-owned profile links.
-
Category labels are directional. Use category findings as pattern evidence, not exact category market sizing.
-
This is a point-in-time snapshot. The data was collected on May 11, 2026. Social routing can change quickly, especially for TikTok, YouTube, X, and Threads.
Reproducibility Notes
The delivery folder includes:
00_expand_brand_pool.py— expands the initial DTC brand candidate pool from public source lists.01_resolve_domains.py— resolves brand names and source entries into canonical domains.02_fetch_pages.py— fetches homepage, product-page, sitemap,llms.txt, and about-page candidates.03_detect_all.py— extracts platform, analytics, payment, SEO, schema, social-link, and performance signals.04_build_master.py— builds the unified per-brand analytical table used by both DTC reports.05_analyze_reports.py— generates aggregate statistics used in the website operations and social matrix reports.07_categorize_brands.py— applies the keyword-based category classifier used for category-level social comparisons.
Methodology corrections, dataset issues, and follow-up analyses welcome at support@thunderbit.com. This report is published independent of any commercial position Thunderbit holds; we build an AI-powered web scraper, and we have a structural interest in public websites remaining inspectable enough for researchers, operators, search engines, and AI agents to understand how brands present themselves online. The atlas is based on 1,238 complete DTC homepage samples collected on May 11, 2026. The data in this report stands on its own. — The Thunderbit research team, May 2026.