
Reader Positioning
This report is written primarily for DTC and ecommerce operators: founders, growth leads, ecommerce managers, lifecycle marketers, and marketing operations teams who want to know what "mature" looks like beyond vague brand reputation. It is also useful for SEO writers, ecommerce newsletter authors, and analysts who need original, citation-ready data about how DTC operating systems are evolving.
The report is not a ranking of the best brands. It is not a revenue estimate. It does not claim to know each company's internal team quality, margin, retention rate, or customer satisfaction. It asks a narrower and more practical question: can observable storefront, marketing, payment, social, SEO, and AI-discoverability signals be combined into a useful maturity model for DTC brands?
The answer is yes, with caveats. Public website signals cannot tell us everything, but they can show whether a brand has moved beyond a simple storefront into a multi-layer operating system: acquisition measurement, retention lifecycle, checkout optionality, customer-experience infrastructure, technical discoverability, AI-search preparation, social distribution, compliance, and observability.
Executive Summary
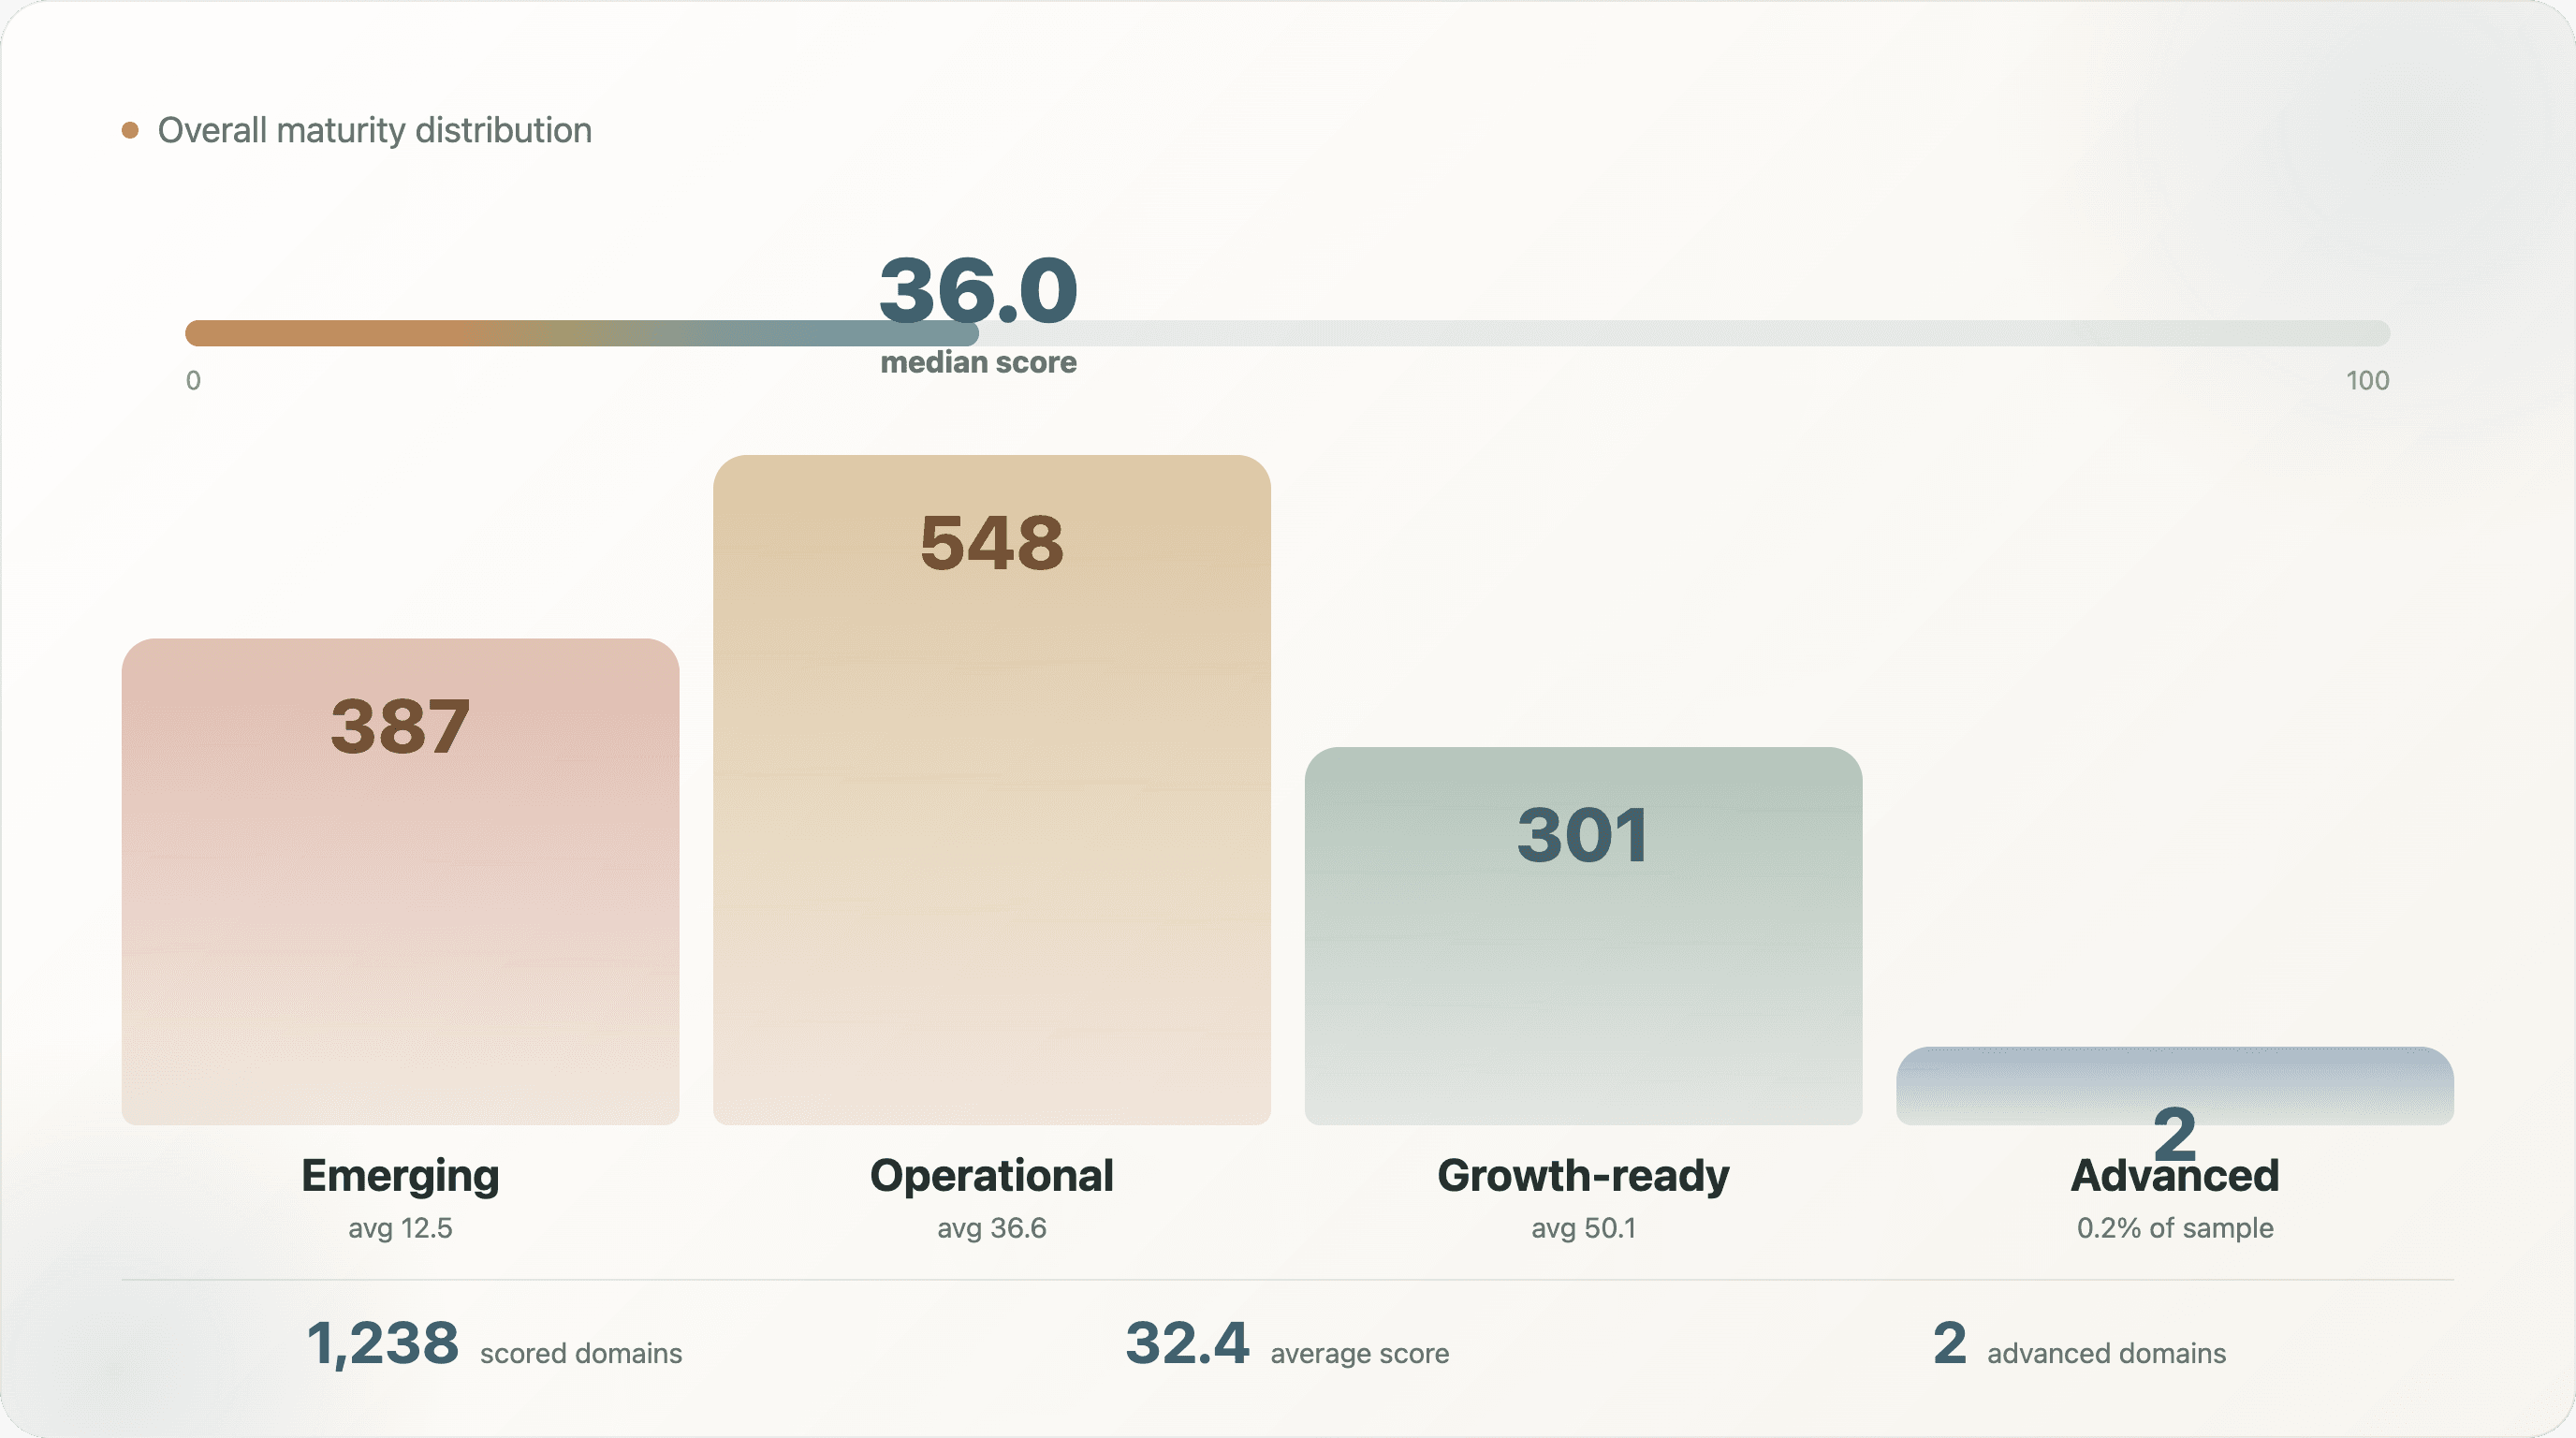
In this research, 1,238 DTC domains were scored using a 100-point maturity index built from eight observable dimensions. The average score was 32.4 out of 100, and the median was 36.0. Only 2 domains, or 0.2% of scored domains, reached the advanced tier. No separate elite tier appeared in the final distribution. The result is the first major takeaway: most DTC websites in this sample are not "immature" because they lack a storefront. They are immature because their operating layers are uneven.
The strongest average dimension was technical discoverability, with an average of 9.4 out of 15 and a median of 10.0. That means many brands have the basic SEO and crawlability layer in place: metadata, canonical signals, mobile viewport, Open Graph, and similar public-page fundamentals. The weakest average dimension was compliance and observability, with an average of 1.2 out of 5. Customer experience was also weak, averaging 1.6 out of 15, and social distribution averaged only 2.7 out of 10.
This creates a more interesting picture than a simple "DTC brands use Shopify" story. Platform choice is not maturity. Many brands can get a solid ecommerce baseline from their platform. The gap appears when you ask whether the brand has built the layers that turn a storefront into a repeatable growth system: lifecycle marketing, support, reviews, payment optionality, social routing, AI-search readiness, consent, experimentation, behavior analytics, and error monitoring.
The tier distribution is also revealing:
| Maturity tier | Domains | Average score | Median analytics tools | Median visible social platforms | Average scripts |
|---|---|---|---|---|---|
| Emerging | 387 | 12.5 | 1.0 | 0.0 | 15.6 |
| Operational | 548 | 36.6 | 3.0 | 0.0 | 54.5 |
| Growth-ready | 301 | 50.1 | 6.0 | 3.0 | 70.9 |
| Advanced | 2 | 66.8 | 10.5 | 5.5 | 81.5 |
The jump from operational to growth_ready is not just a higher score. It is a change in operating shape. Growth-ready brands have more instrumentation, more payment and retention layers, more social visibility, and more front-end dependency burden. Mature operations are more capable, but also more complex.
That is the report's central argument: DTC maturity is no longer defined by whether a brand has an ecommerce site. It is defined by how many operating layers work together, and whether the team can govern the complexity those layers create.
The Most Shareable Findings
-
The average DTC maturity score is only 32.4/100. In this sample, most brands have a storefront and some tooling, but few show a fully layered operating system.
-
Only 0.2% reached the advanced tier. Just 2 of 1,238 scored domains crossed the
advancedthreshold under this model. -
Technical SEO is the strongest layer. Technical discoverability averaged 9.4/15, making it the best-developed dimension.
-
Compliance and observability are the weakest layer. This dimension averaged only 1.2/5, showing that public signals for consent, monitoring, and operational resilience remain sparse.
-
The head-versus-tail gap is smaller than expected. Brands appearing in at least three source collections averaged 37.0, while the rest averaged 31.9. Public visibility helps, but it does not guarantee maturity.
-
Growth-ready brands carry more infrastructure burden. They have a median of 6 analytics tools and average 70.9 scripts, compared with 3 analytics tools and 54.5 scripts for operational brands.
1. Why a Maturity Index Matters
Most ecommerce benchmark reports list tools, platforms, payment methods, or social channels one by one. That is useful, but incomplete. A brand can have GA4 and still lack a retention system. It can have Shop Pay and still lack structured product data. It can have Instagram and still lack product education. It can have many scripts and still lack observability. It can have a modern frontend and still be weak on lifecycle marketing.
Operators need a model that combines signals. That is what this maturity index tries to do.
The index uses eight dimensions:
| Dimension | Max points | What it captures |
|---|---|---|
| Acquisition analytics | 15 | Measurement, tag management, paid-media visibility, attribution signals |
| Retention lifecycle | 15 | Email, SMS, loyalty, subscription, post-purchase or lifecycle tools |
| Commerce and payment | 15 | Checkout and payment optionality |
| Customer experience | 15 | Reviews, support, personalization, quizzes, returns, upsell, trust infrastructure |
| Technical discoverability | 15 | SEO and crawlability signals |
| AI search | 10 | llms.txt and structured AI/search readiness indicators |
| Social distribution | 10 | Visible official-site routing to social platforms |
| Compliance and observability | 5 | Consent, monitoring, privacy, and reliability signals |
The index is intentionally public-signal based. It does not claim to know internal performance. It scores what can be observed from the storefront and related detection data. That makes it useful for benchmarking, competitive analysis, SEO content, investor-style landscape writing, and internal audits.
The index also makes one philosophical choice: it does not treat any single platform as maturity. A Shopify store with default payments and basic metadata is not automatically mature. A headless site without retention, support, or structured data is not automatically mature either. Maturity is multi-layered.
2. The Overall Distribution: Most Brands Are Operational, Not Mature
The average score across 1,238 domains is 32.4, with a median of 36.0. That means the typical brand is not at zero. It likely has some analytics, some checkout capability, some SEO basics, and perhaps one or two additional operating layers. But it does not show a strong, balanced system across the full index.
The largest tier is operational, with 548 domains. These brands generally have a working ecommerce presence and some growth infrastructure. The second largest is emerging, with 387 domains. These brands show fewer public operating signals. The growth_ready tier includes 301 domains, and the advanced tier includes only 2 domains.
That distribution is useful because it avoids two bad narratives. The first bad narrative is that DTC is universally sophisticated. It is not, at least not in public website signals. The second bad narrative is that most brands are unsophisticated. That is also too harsh. The better reading is that most brands are operationally functional but uneven.
The tier table also shows how maturity changes the surface area of the website. Emerging brands average 15.6 scripts, operational brands average 54.5, growth-ready brands average 70.9, and advanced brands average 81.5. Maturity brings more capabilities, but those capabilities add front-end complexity. That is why the maturity conversation must include governance.
3. Dimension Benchmarks: Where DTC Is Strong and Weak
The dimension benchmarks reveal the shape of the market:
| Dimension | Average | Median | p75 | Max |
|---|---|---|---|---|
| Acquisition analytics | 5.4 | 5.0 | 7.5 | 13.5 |
| Retention lifecycle | 2.7 | 3.0 | 5.0 | 8.0 |
| Commerce and payment | 6.2 | 7.0 | 11.0 | 13.0 |
| Customer experience | 1.6 | 0.0 | 3.0 | 12.0 |
| Technical discoverability | 9.4 | 10.0 | 12.0 | 15.0 |
| AI search | 3.2 | 3.0 | 5.0 | 8.5 |
| Social distribution | 2.7 | 0.0 | 5.8 | 10.0 |
| Compliance and observability | 1.2 | 1.0 | 2.0 | 5.0 |
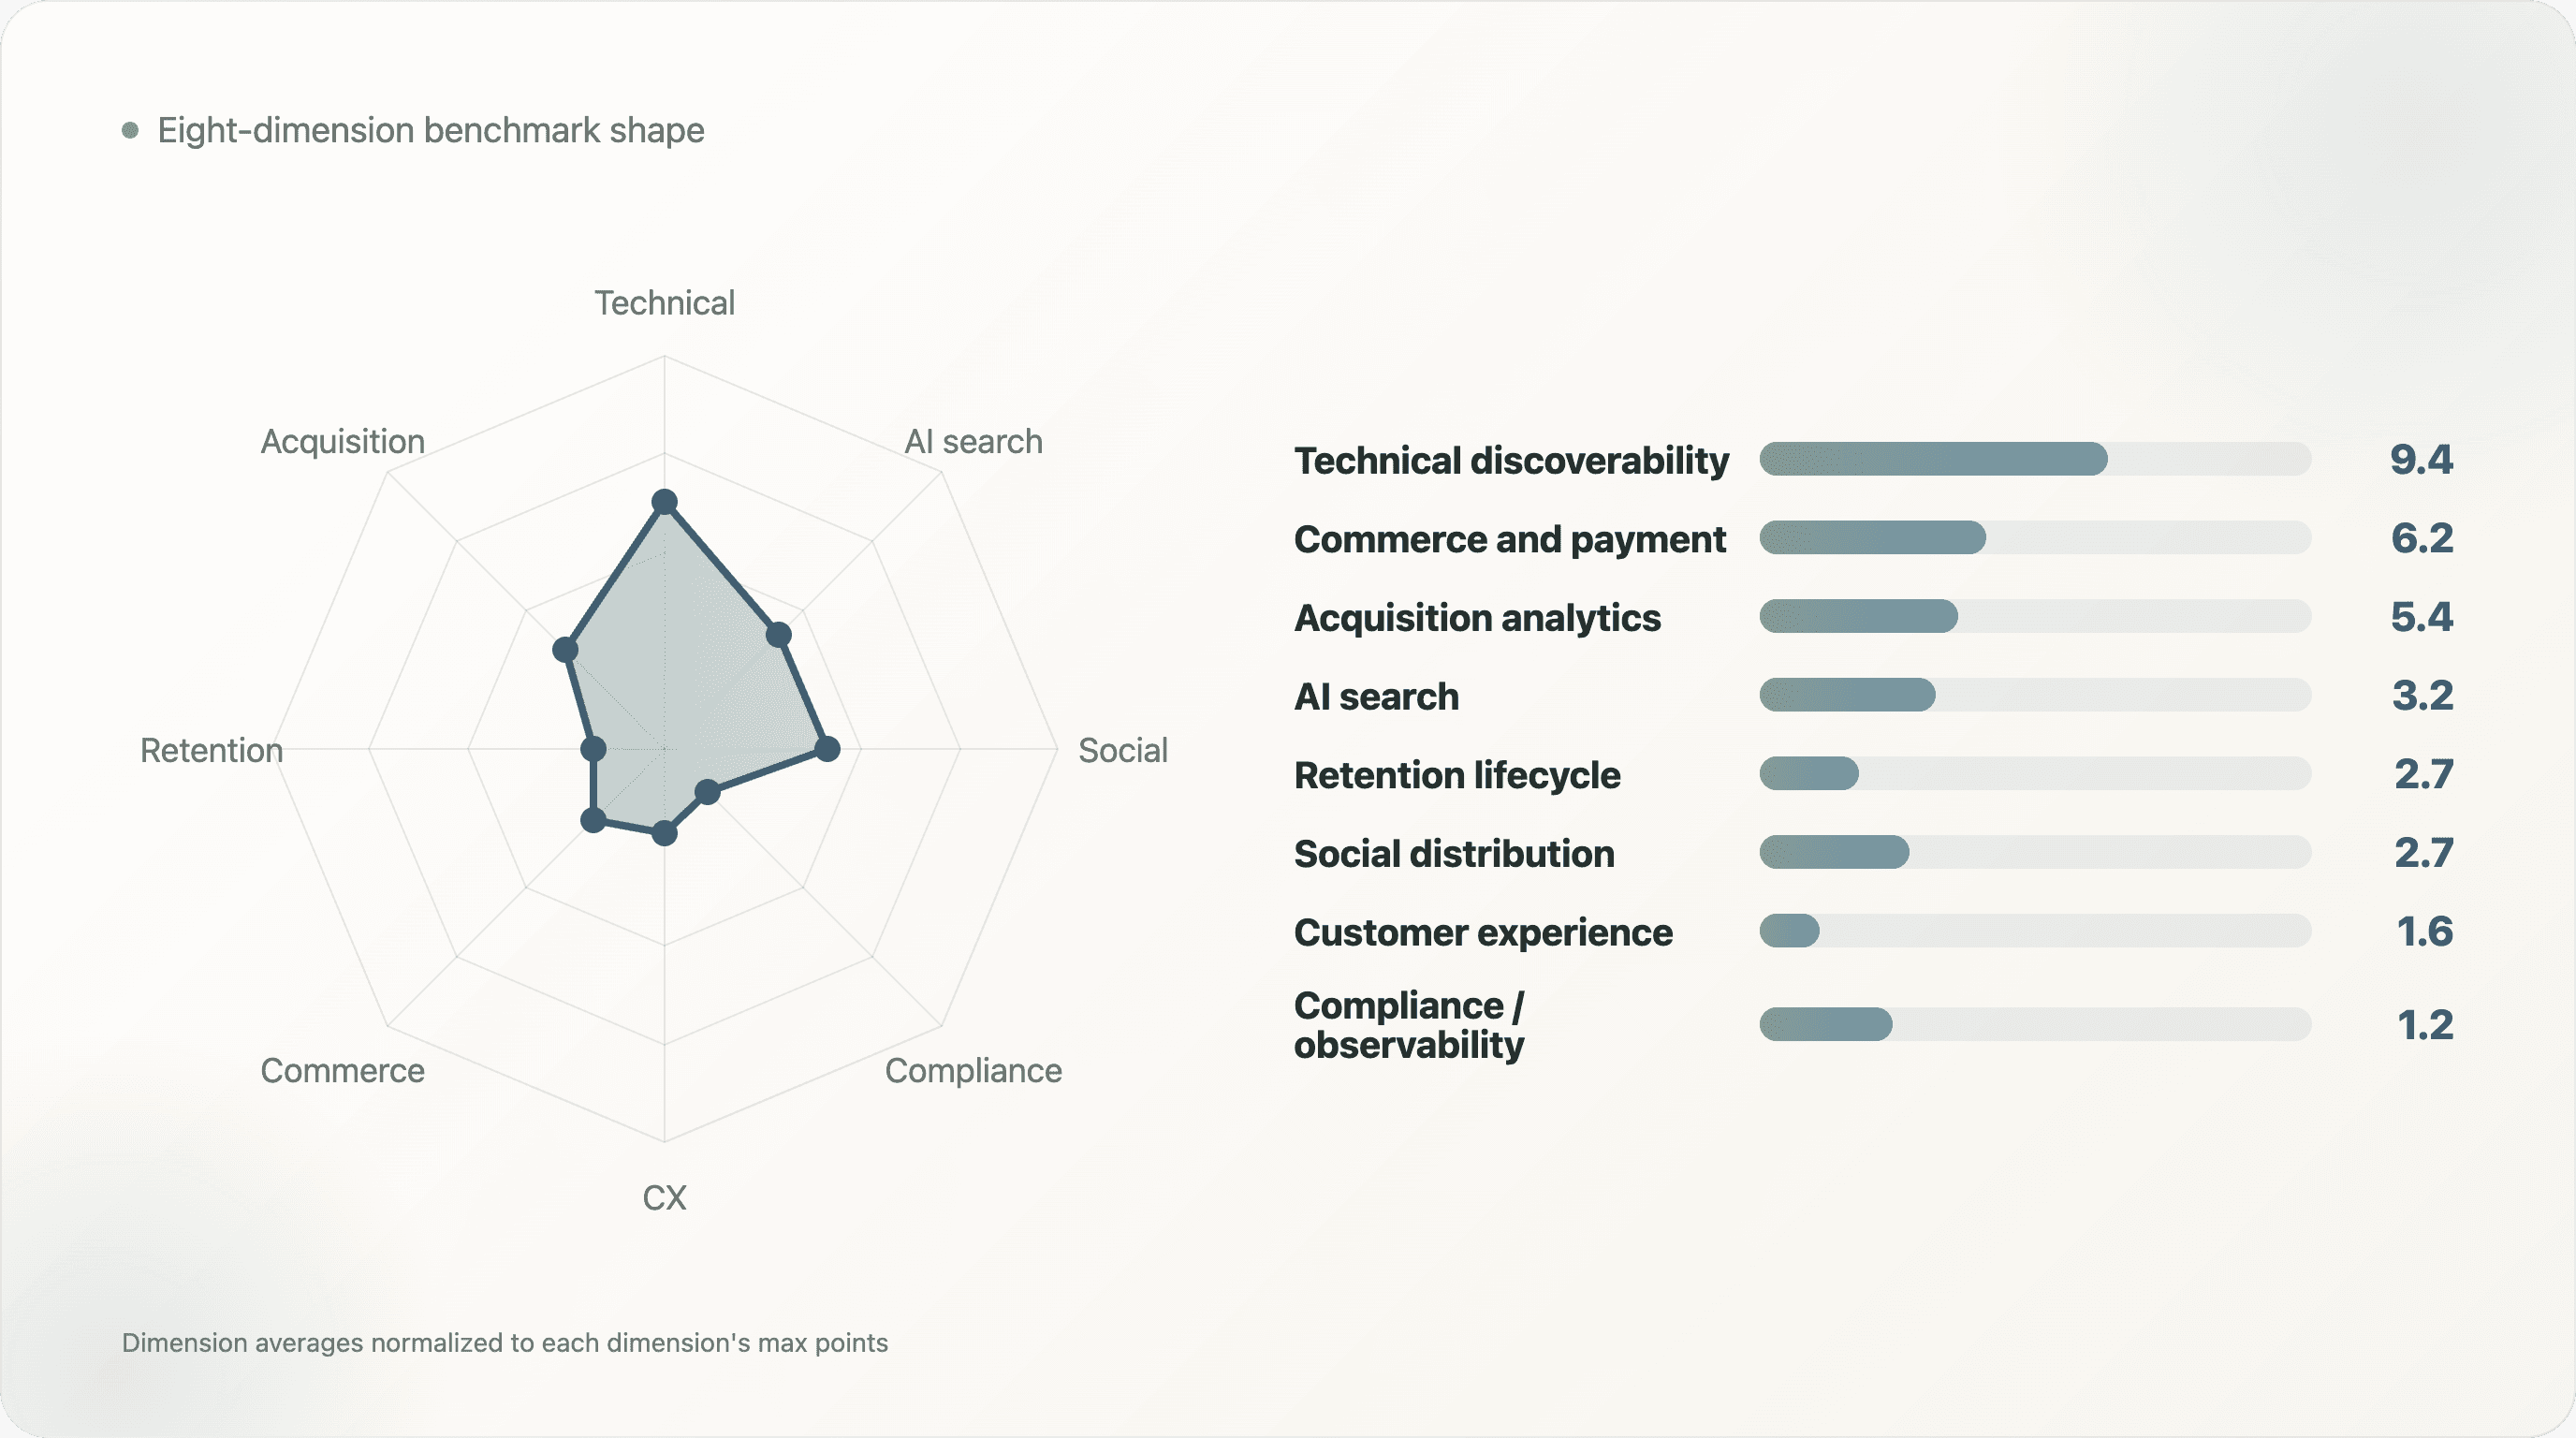
Technical discoverability is the strongest dimension. That likely reflects platform defaults, SEO plugins, theme conventions, and years of ecommerce SEO practice. Most brands understand that pages need meta descriptions, canonical tags, mobile viewports, and social preview metadata. This does not mean every site has excellent SEO. It means the basic public signals are the most mature layer in the index.
Commerce and payment is the second relatively strong layer. That also fits the market. Payment tooling is close to the platform core. Many brands benefit from checkout defaults and familiar payment providers without building custom infrastructure.
The weakest layers are more revealing. Customer experience has a median of 0.0, meaning many brands show no detected public signals in that dimension. Compliance and observability averages 1.2 out of 5. Social distribution has a median of 0.0. These are not obscure technical nice-to-haves. They are the layers that show whether a brand is managing trust, support, public distribution, privacy, and operational resilience.
AI search is still early, averaging 3.2 out of 10. This aligns with the separate AI-search readiness research: many brands have some machine-readable entry point, especially via platform defaults, but far fewer expose high-quality structured product and brand information.
4. What Advanced Looks Like: Positive Examples
Only two domains reached the advanced tier under this model: Nakedcashmere and Rare Beauty.
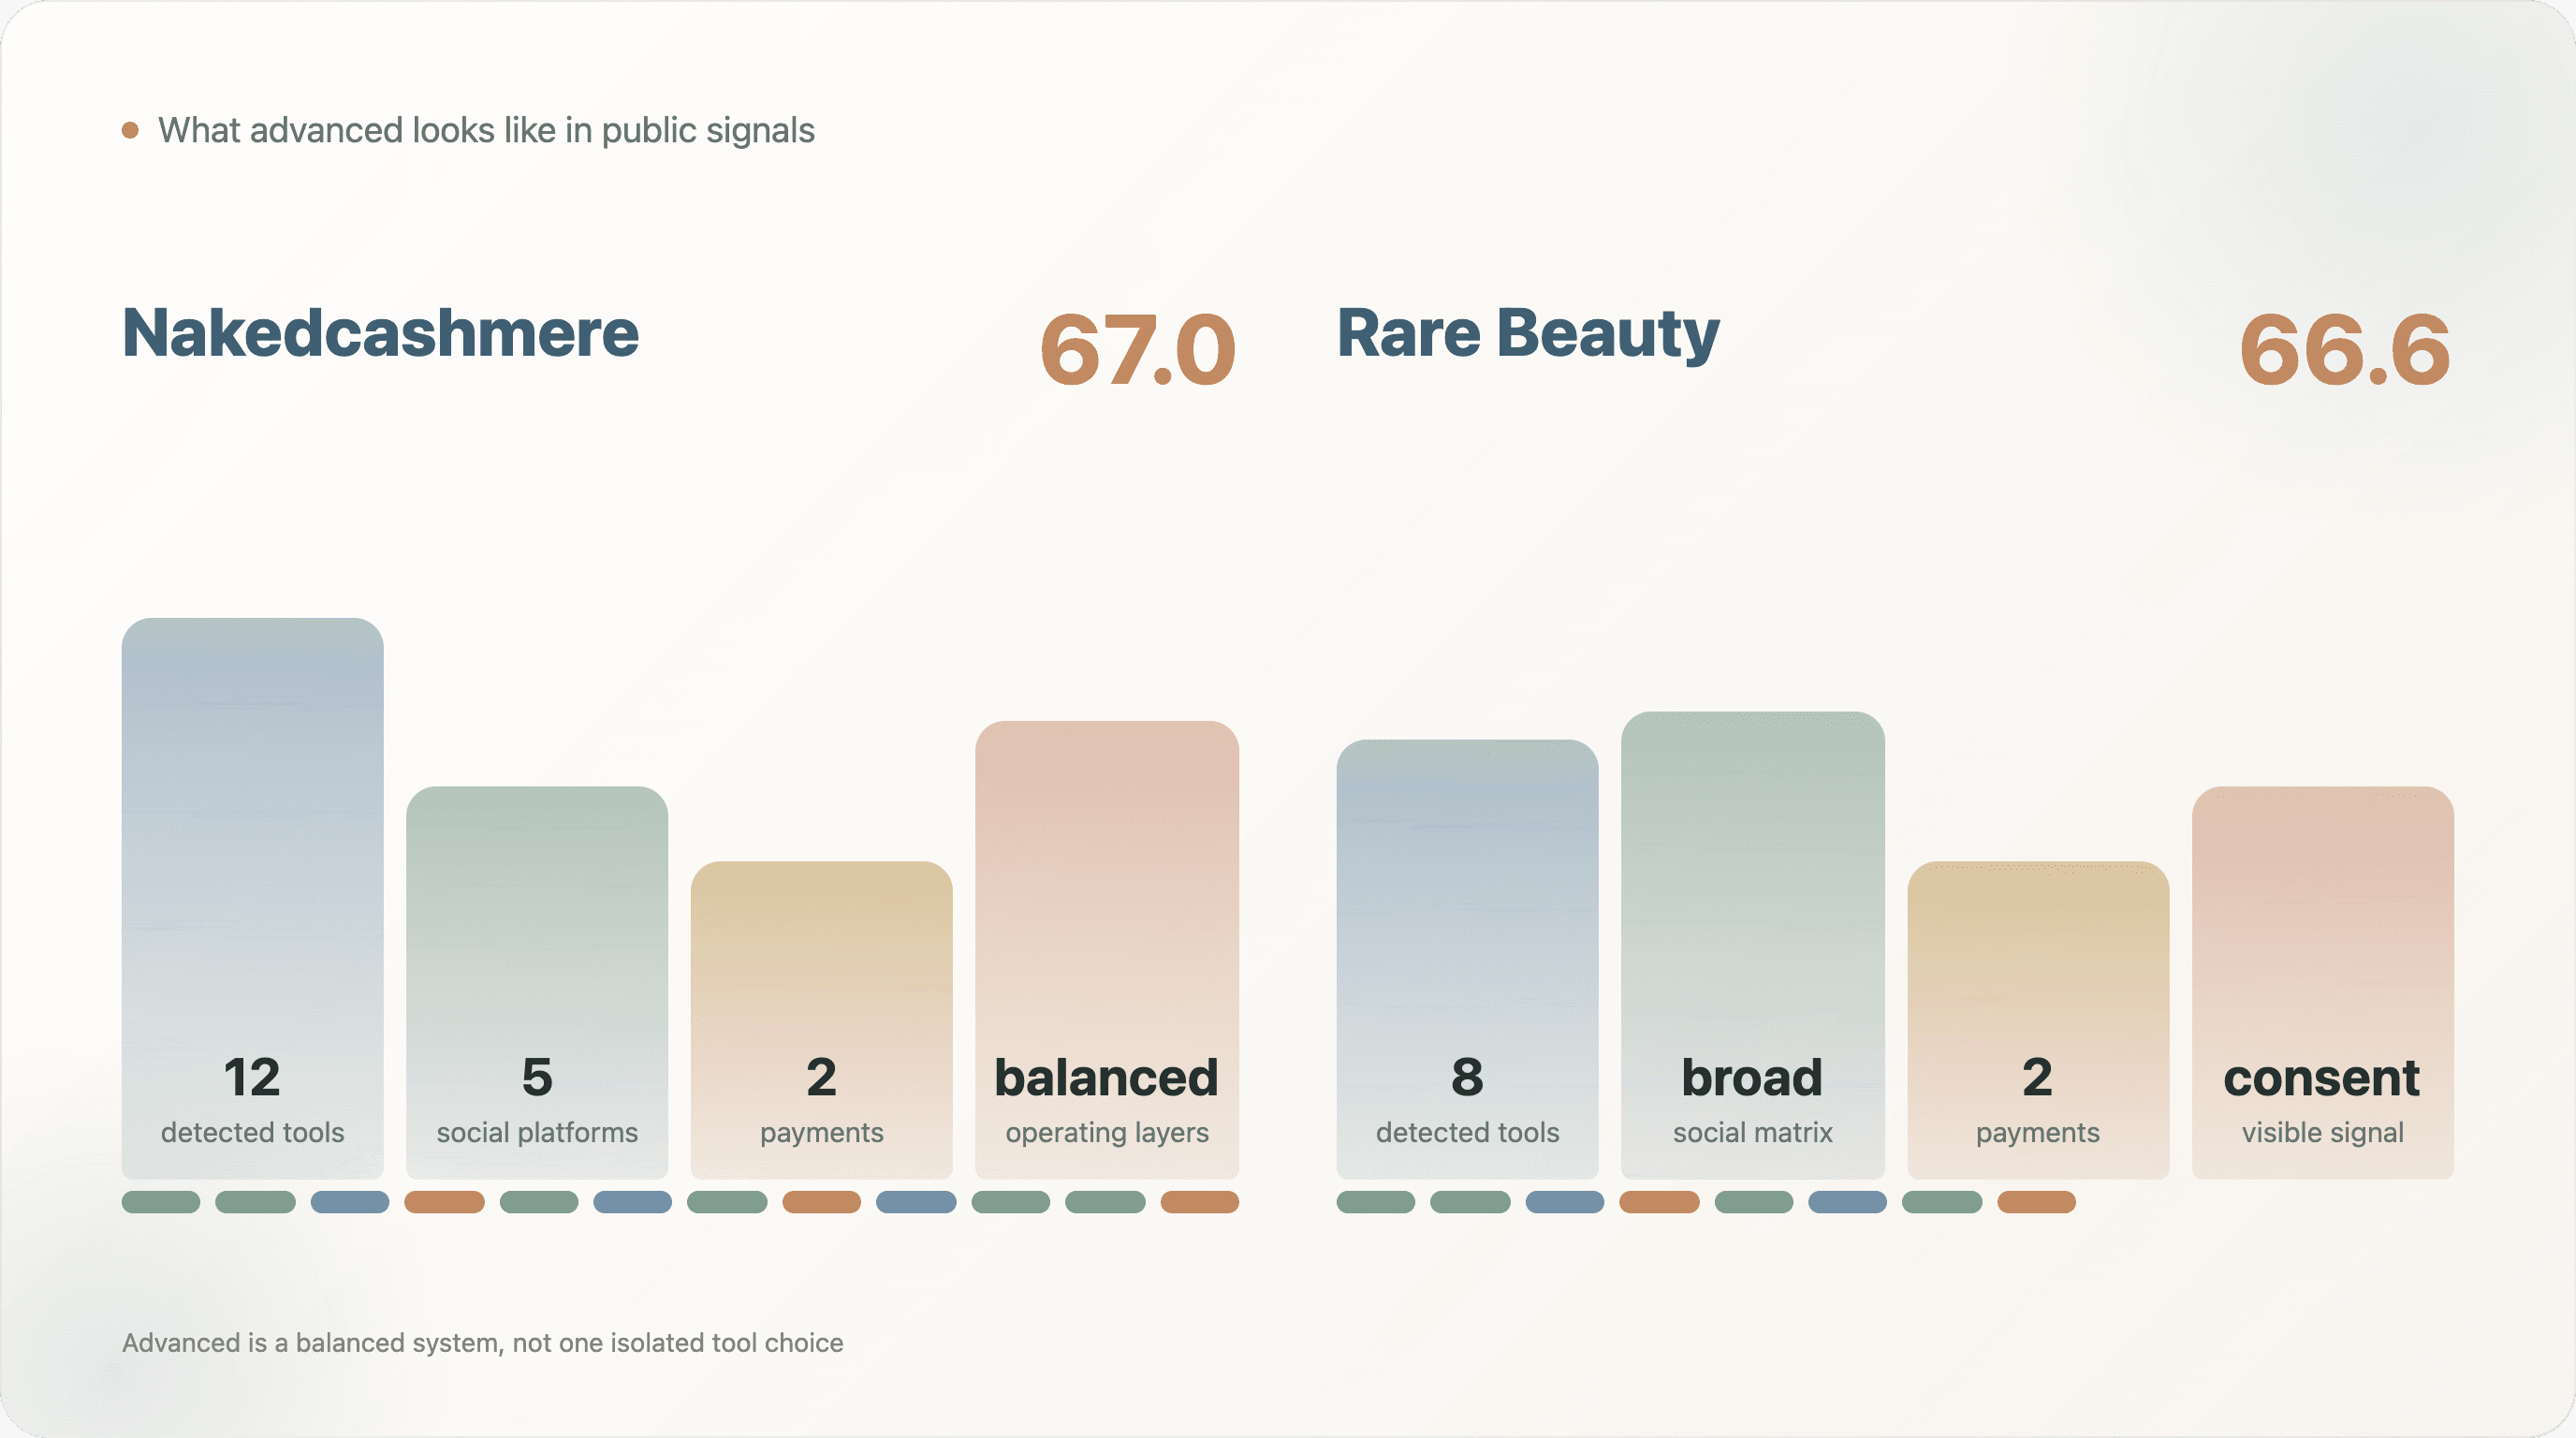
Nakedcashmere scored 67.0. In the public detection data, it showed a broad operating stack: Attentive, Bing UET, GA4, GTM, Gorgias, Hotjar, Klaviyo Onsite, Loop Returns, Microsoft Clarity, TikTok Pixel, Triple Whale, Universal Analytics, and Yotpo, plus PayPal and Shop Pay. It also had visible social distribution across five platforms. This is a useful example of a brand with many operating layers: acquisition measurement, retention, customer support, returns, behavior analytics, attribution, reviews, and checkout.
Rare Beauty scored 66.6. It showed Attentive, Bing UET, Cookiebot / OneTrust, GA4, GTM, Gorgias, Klaviyo Onsite, and Yotpo, with PayPal and Shop Pay, plus a broad social matrix. The important point is not that every brand should copy this exact stack. The point is that advanced maturity looks like a balanced system, not a single tool.
The next group of high-scoring examples includes Kaged, Venus Et Fleur, Au Vodka, Polysleep, BedJet, Tubby Todd, Heatonist, Balance Me, The Inkey List, Three Ships Beauty, Little Sleepies, Kizik, and Dollar Shave Club. These names are useful for readers because they make the index concrete. They show that maturity patterns appear across apparel, beauty, food and beverage, wellness, baby, home, and personal care.
The report deliberately avoids using low-scoring brands as negative examples. That would be unfair because the index only reads public signals. A brand may be operationally strong in ways the crawl cannot see. Positive examples are safer and more useful.
5. Category Patterns: Apparel and Beauty Lead, But Not by a Huge Margin
Category classification is directional and keyword-based, so it should not be treated as exact market sizing. Still, the category benchmarks are useful:
| Category | Sample | Average maturity | Advanced count | Avg AI search | Avg retention | Avg social |
|---|---|---|---|---|---|---|
| Apparel & Footwear | 149 | 40.5 | 1 | 3.9 | 3.7 | 3.3 |
| Beauty & Skincare | 98 | 40.0 | 1 | 3.8 | 3.6 | 2.8 |
| Personal Care | 7 | 38.1 | 0 | 3.8 | 3.6 | 3.1 |
| Jewelry & Accessories | 34 | 37.8 | 0 | 3.6 | 3.9 | 1.9 |
| Food & Beverage | 118 | 37.7 | 0 | 3.8 | 3.8 | 3.4 |
| Home & Furniture | 48 | 37.4 | 0 | 3.6 | 3.1 | 2.7 |
| Health & Wellness | 58 | 37.3 | 0 | 3.5 | 3.5 | 2.9 |
| Outdoor & Sports | 49 | 36.3 | 0 | 3.3 | 2.4 | 3.4 |
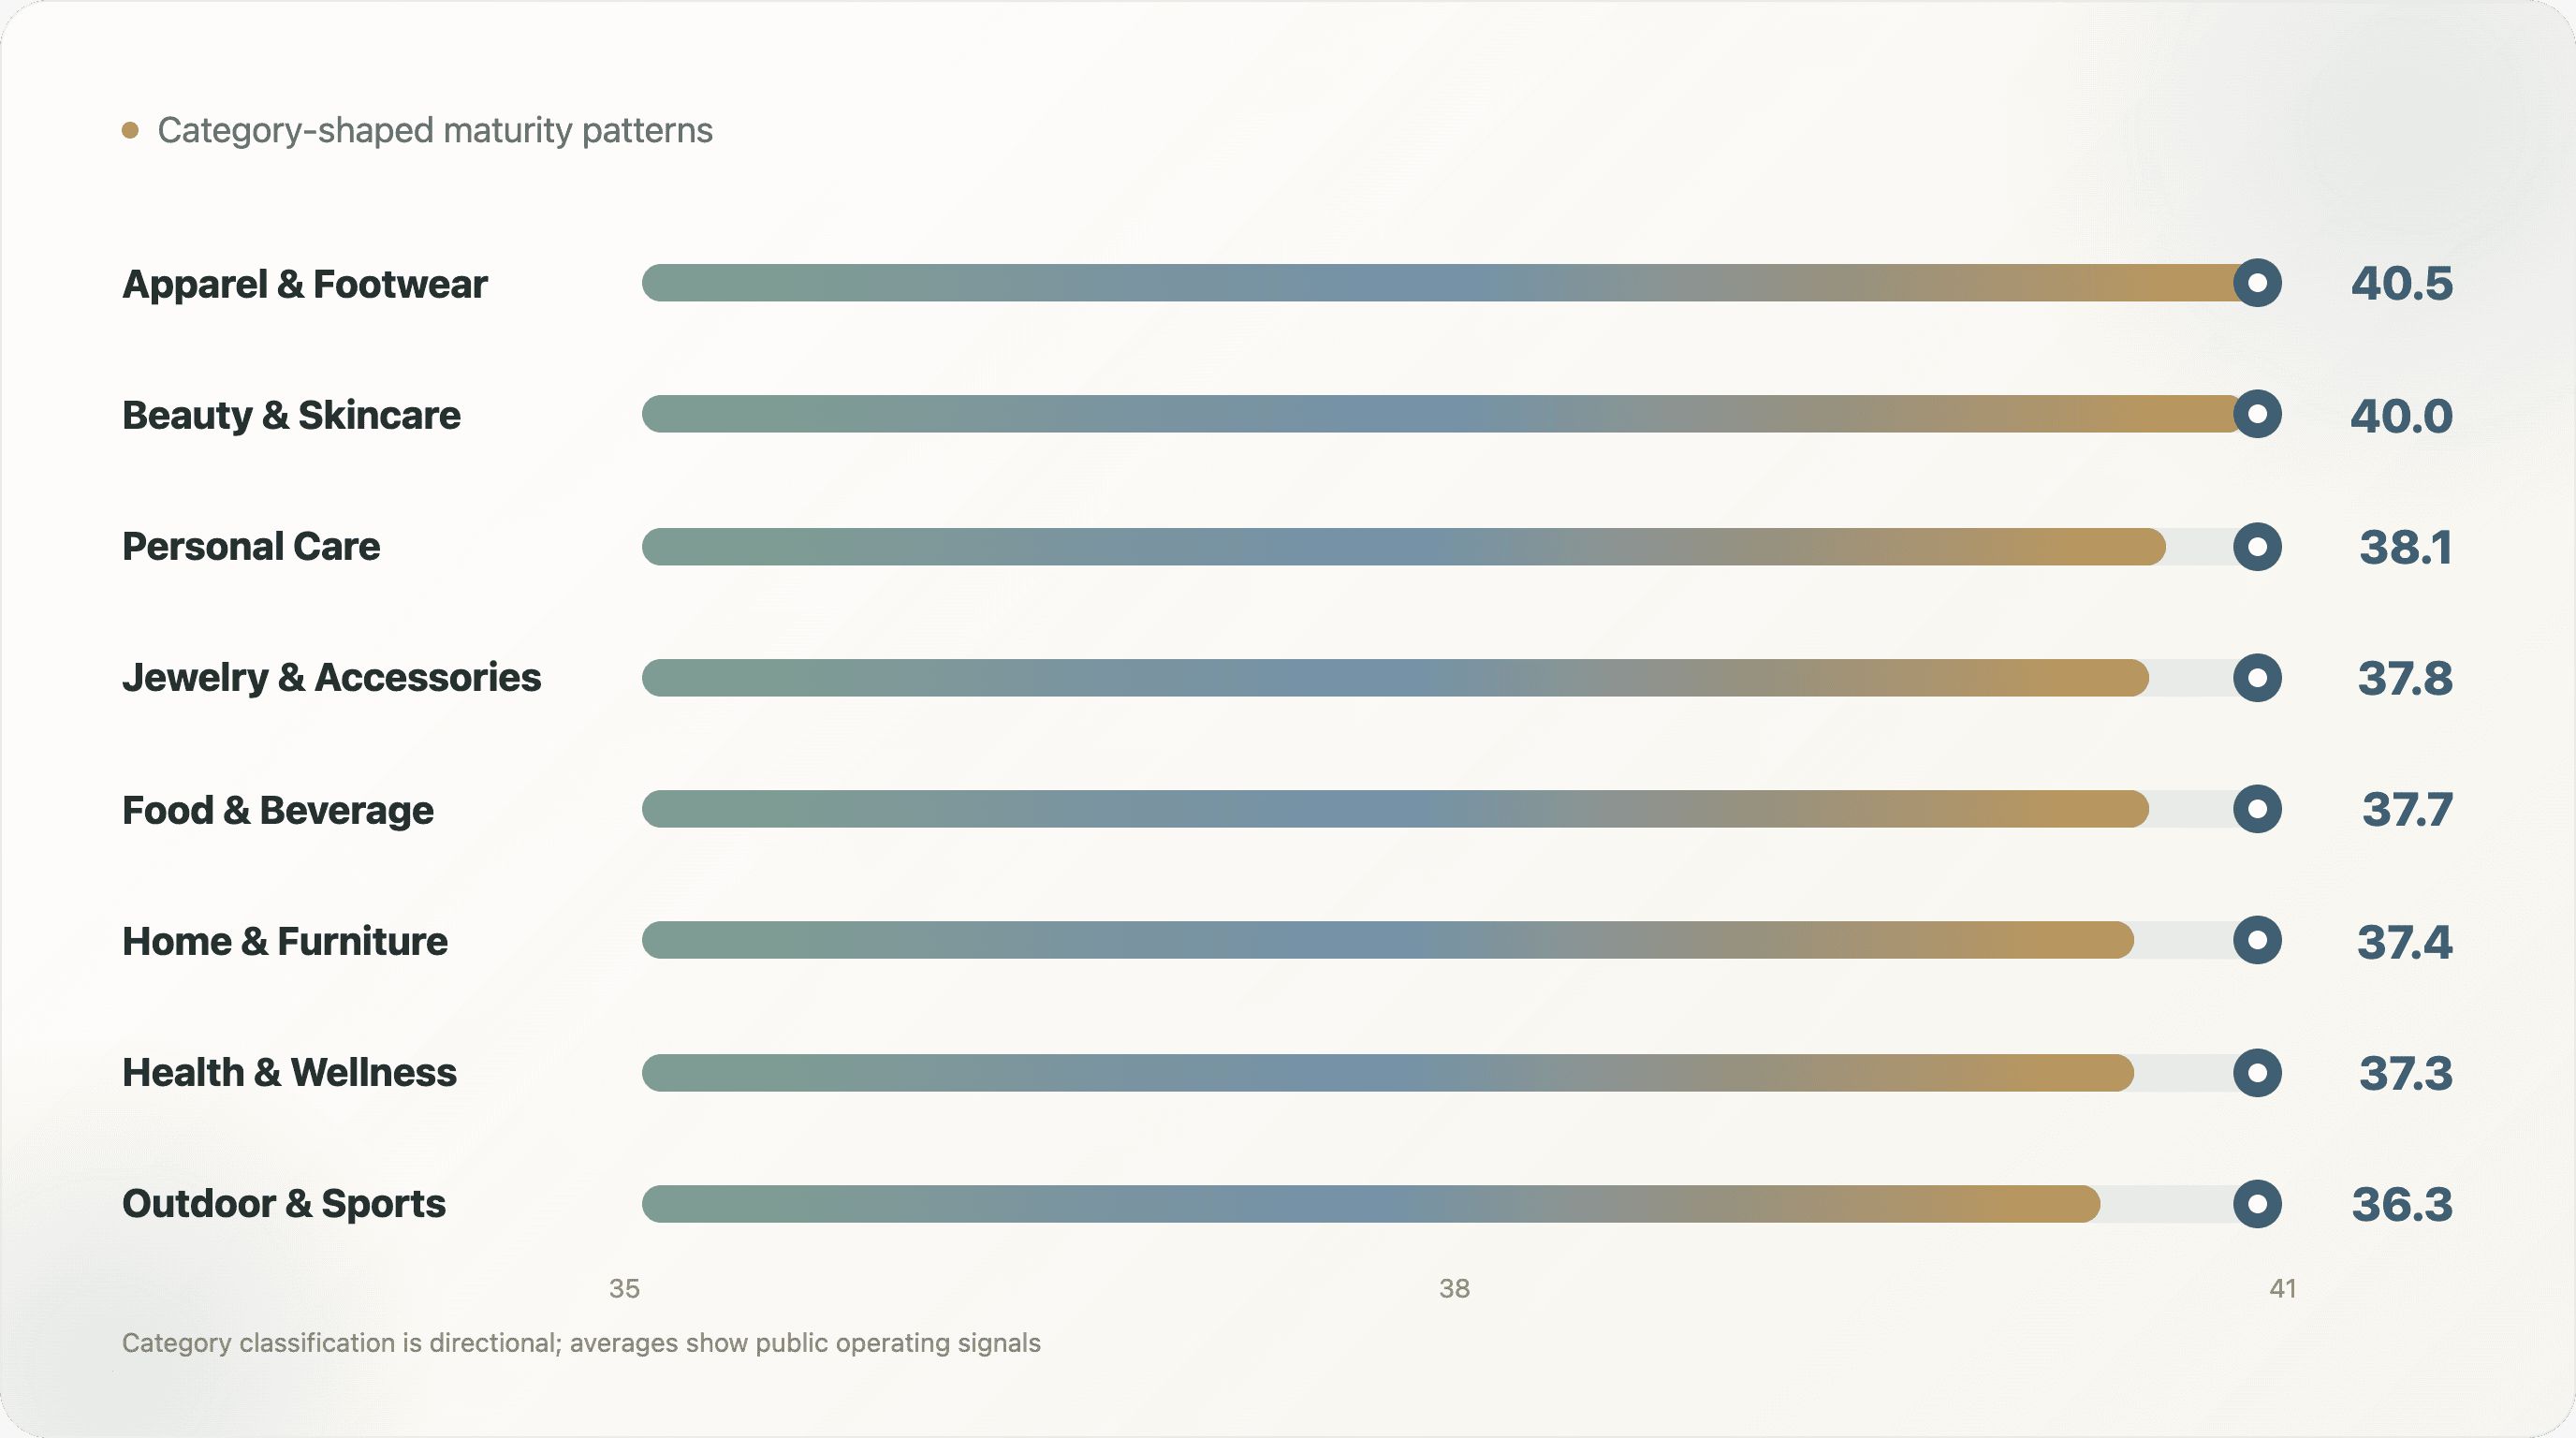
Apparel & Footwear and Beauty & Skincare lead the category table, with average scores of 40.5 and 40.0. That makes sense. These categories tend to be competitive, visually driven, paid-media heavy, and retention-oriented. They often need email, SMS, reviews, social proof, creator distribution, and payment flexibility.
Food & Beverage scores 37.7, with relatively strong social and retention signals. Food brands often depend on repeat purchase, rituals, subscriptions, recipes, and Instagram-friendly content. Health & Wellness scores 37.3, which is slightly lower than one might expect given its education burden. That may reflect uneven public signals rather than weak operations.
Outdoor & Sports has a lower average maturity score than Apparel or Beauty, but its social score is relatively strong. That matches the separate social matrix finding that Outdoor & Sports over-indexes on YouTube and X. Some categories may have strong content and community behavior without showing the broad lifecycle or customer-experience stack that lifts the maturity index.
The category lesson is that maturity is category-shaped. A mature beauty brand may need reviews, creators, quizzes, subscriptions, and lifecycle education. A mature home brand may need Pinterest, financing, long-form content, and customer support. A mature food brand may need subscriptions, bundles, email, recipes, and social proof. The same 100-point index helps compare layers, but the operating playbook differs by category.
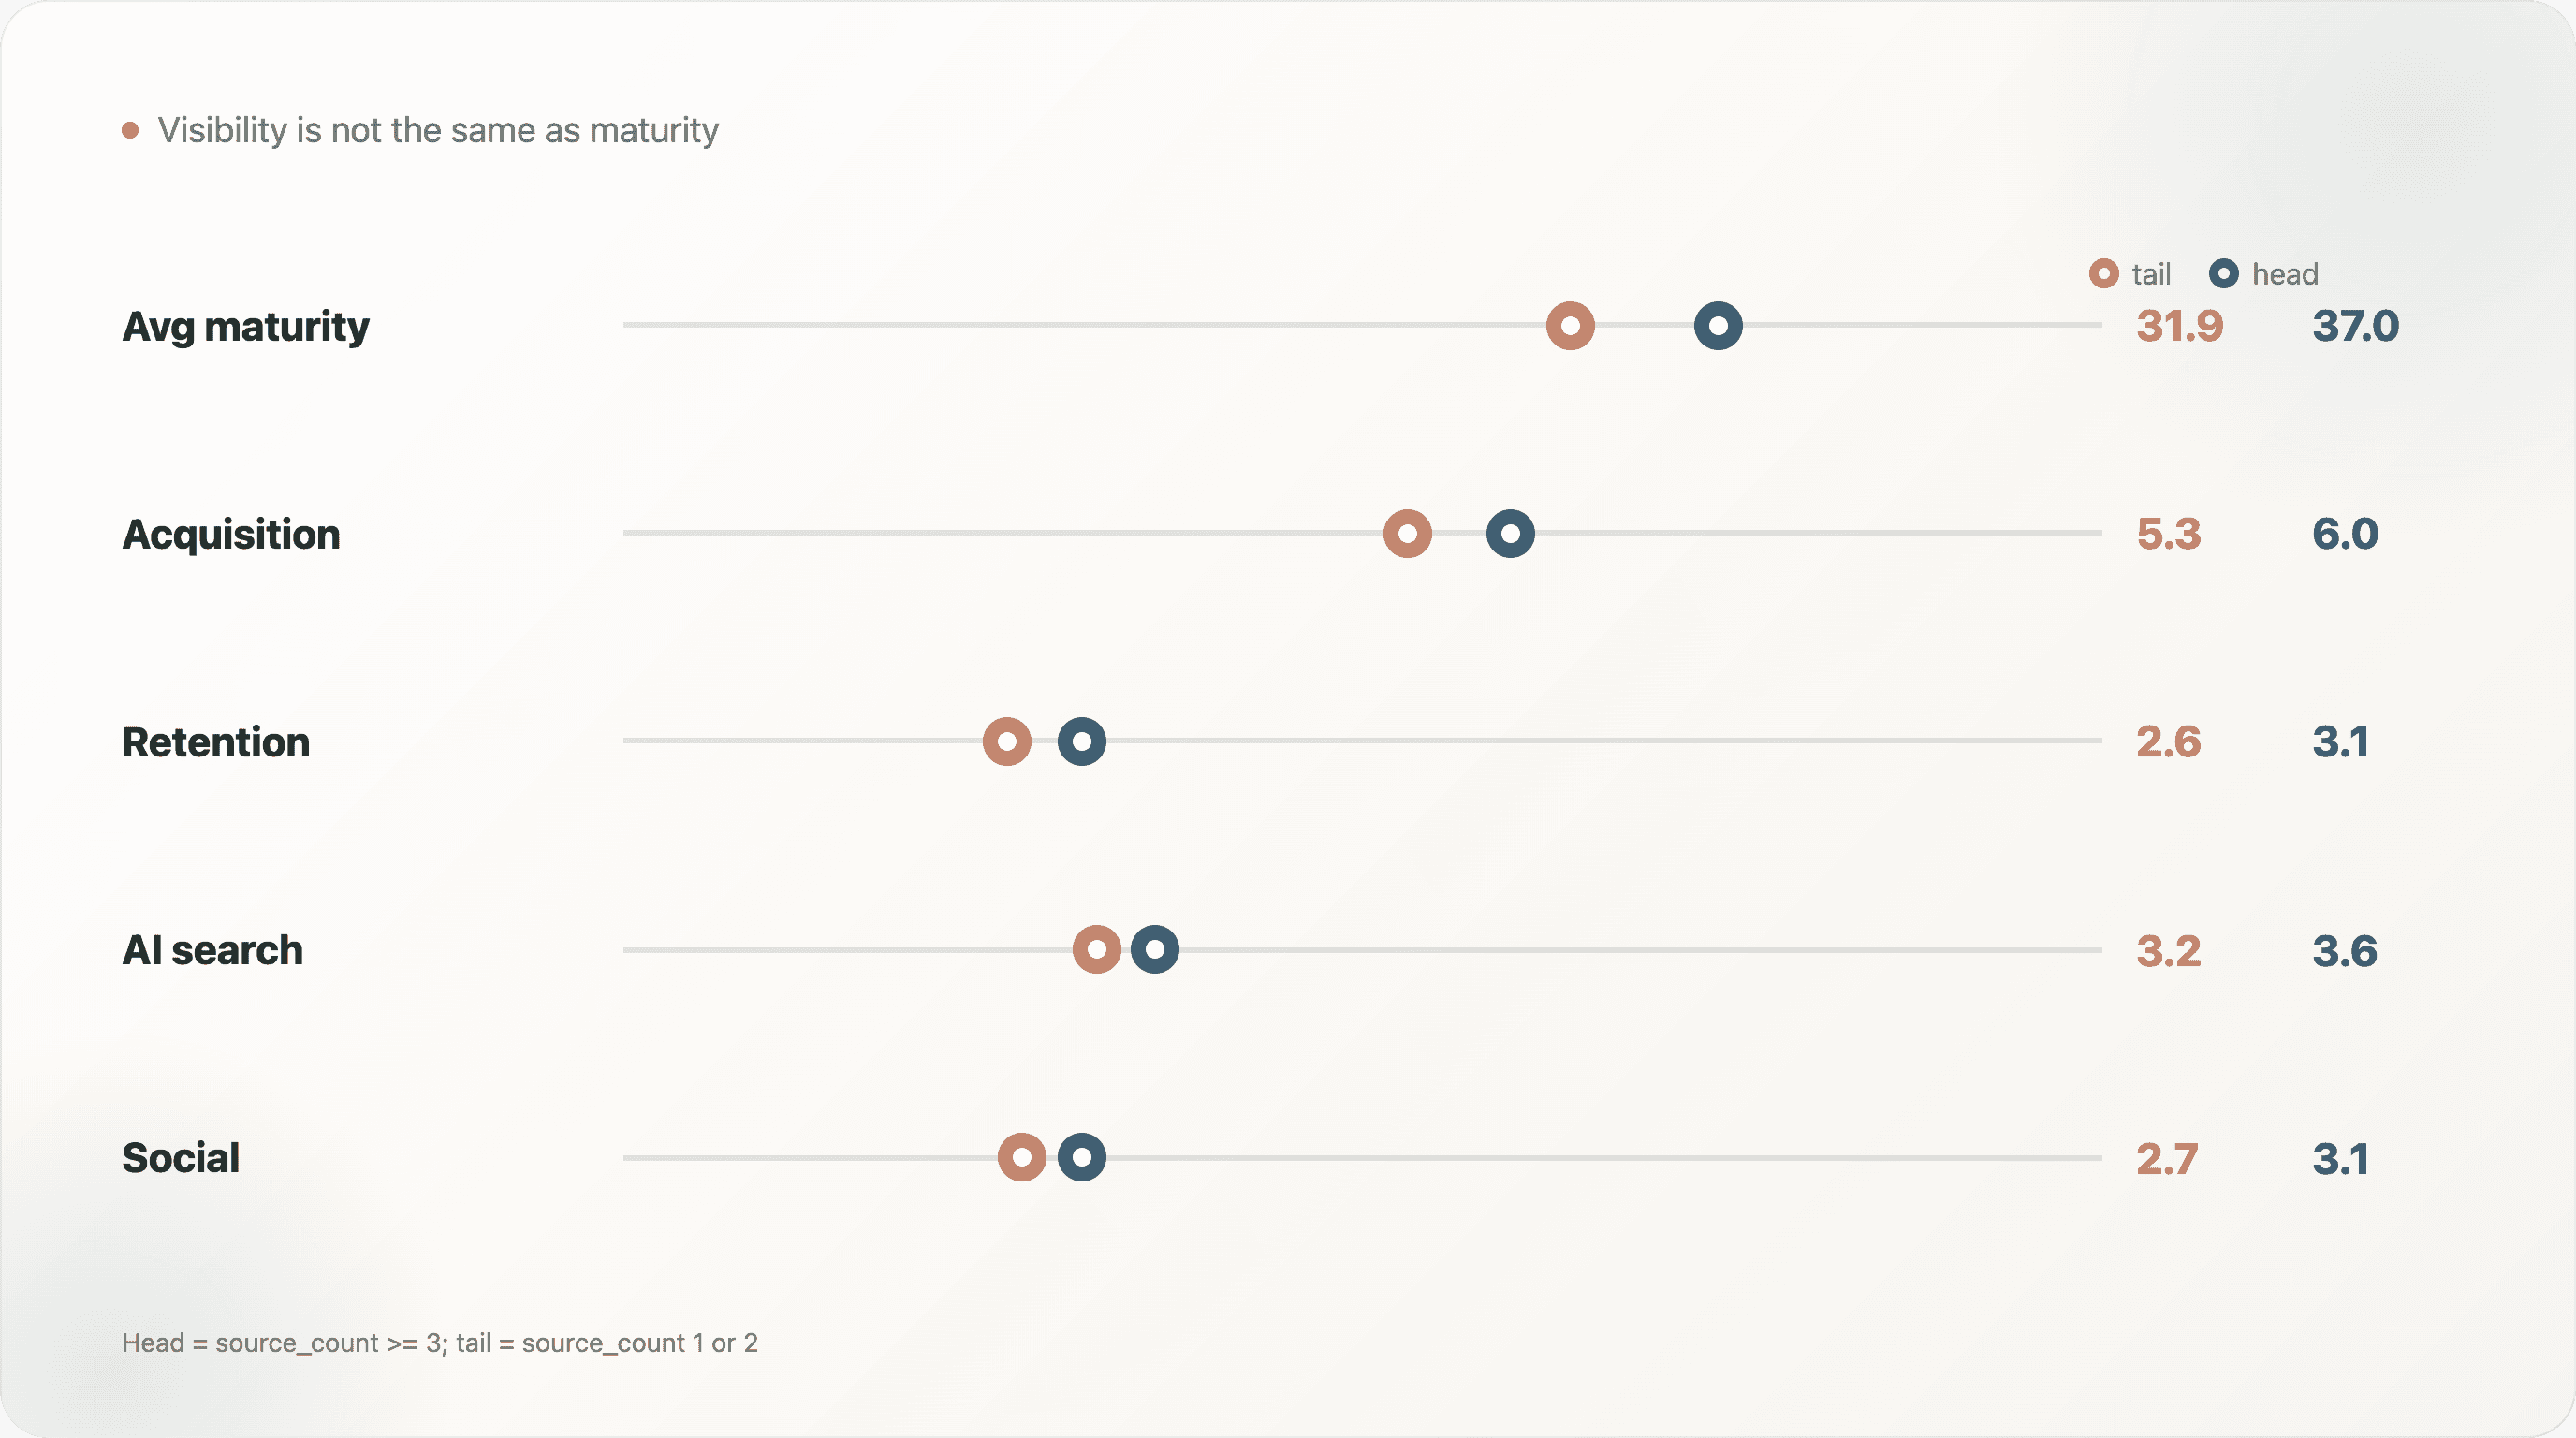
6. Head Versus Tail: Visibility Is Not the Same as Maturity
The head-versus-tail comparison is one of the more counterintuitive parts of the study.
| Segment | Sample | Avg maturity | Avg acquisition | Avg retention | Avg AI search | Avg social |
|---|---|---|---|---|---|---|
| Head: source_count >= 3 | 112 | 37.0 | 6.0 | 3.1 | 3.6 | 3.1 |
| Tail: source_count 1 or 2 | 1,126 | 31.9 | 5.3 | 2.6 | 3.2 | 2.7 |
Brands appearing in at least three source collections score higher, but the gap is only 5.1 points. That is meaningful, but not massive. Public visibility in case studies and ecommerce lists is associated with higher maturity, but it does not guarantee a fully mature operating system.
This is important for operators because it reduces intimidation. Smaller or less-public brands can access many of the same tools. The default stack is widely available. Payment providers, email platforms, behavior analytics, review tools, and schema improvements are not restricted to the most famous brands.
It is also a warning to visible brands. Being mentioned in more source lists does not automatically mean the storefront is mature across lifecycle, AI readiness, social distribution, and compliance. A brand can be well known and still have gaps.
For content writers, the headline is strong: DTC maturity is not the same as DTC fame. The public operating signals of more visible brands are better, but not overwhelmingly better.
7. The Maturity Paradox: Capability Creates Complexity
The tier table shows a clear pattern: higher maturity comes with more scripts.
Emerging brands average 15.6 scripts. Operational brands average 54.5. Growth-ready brands average 70.9. Advanced brands average 81.5.
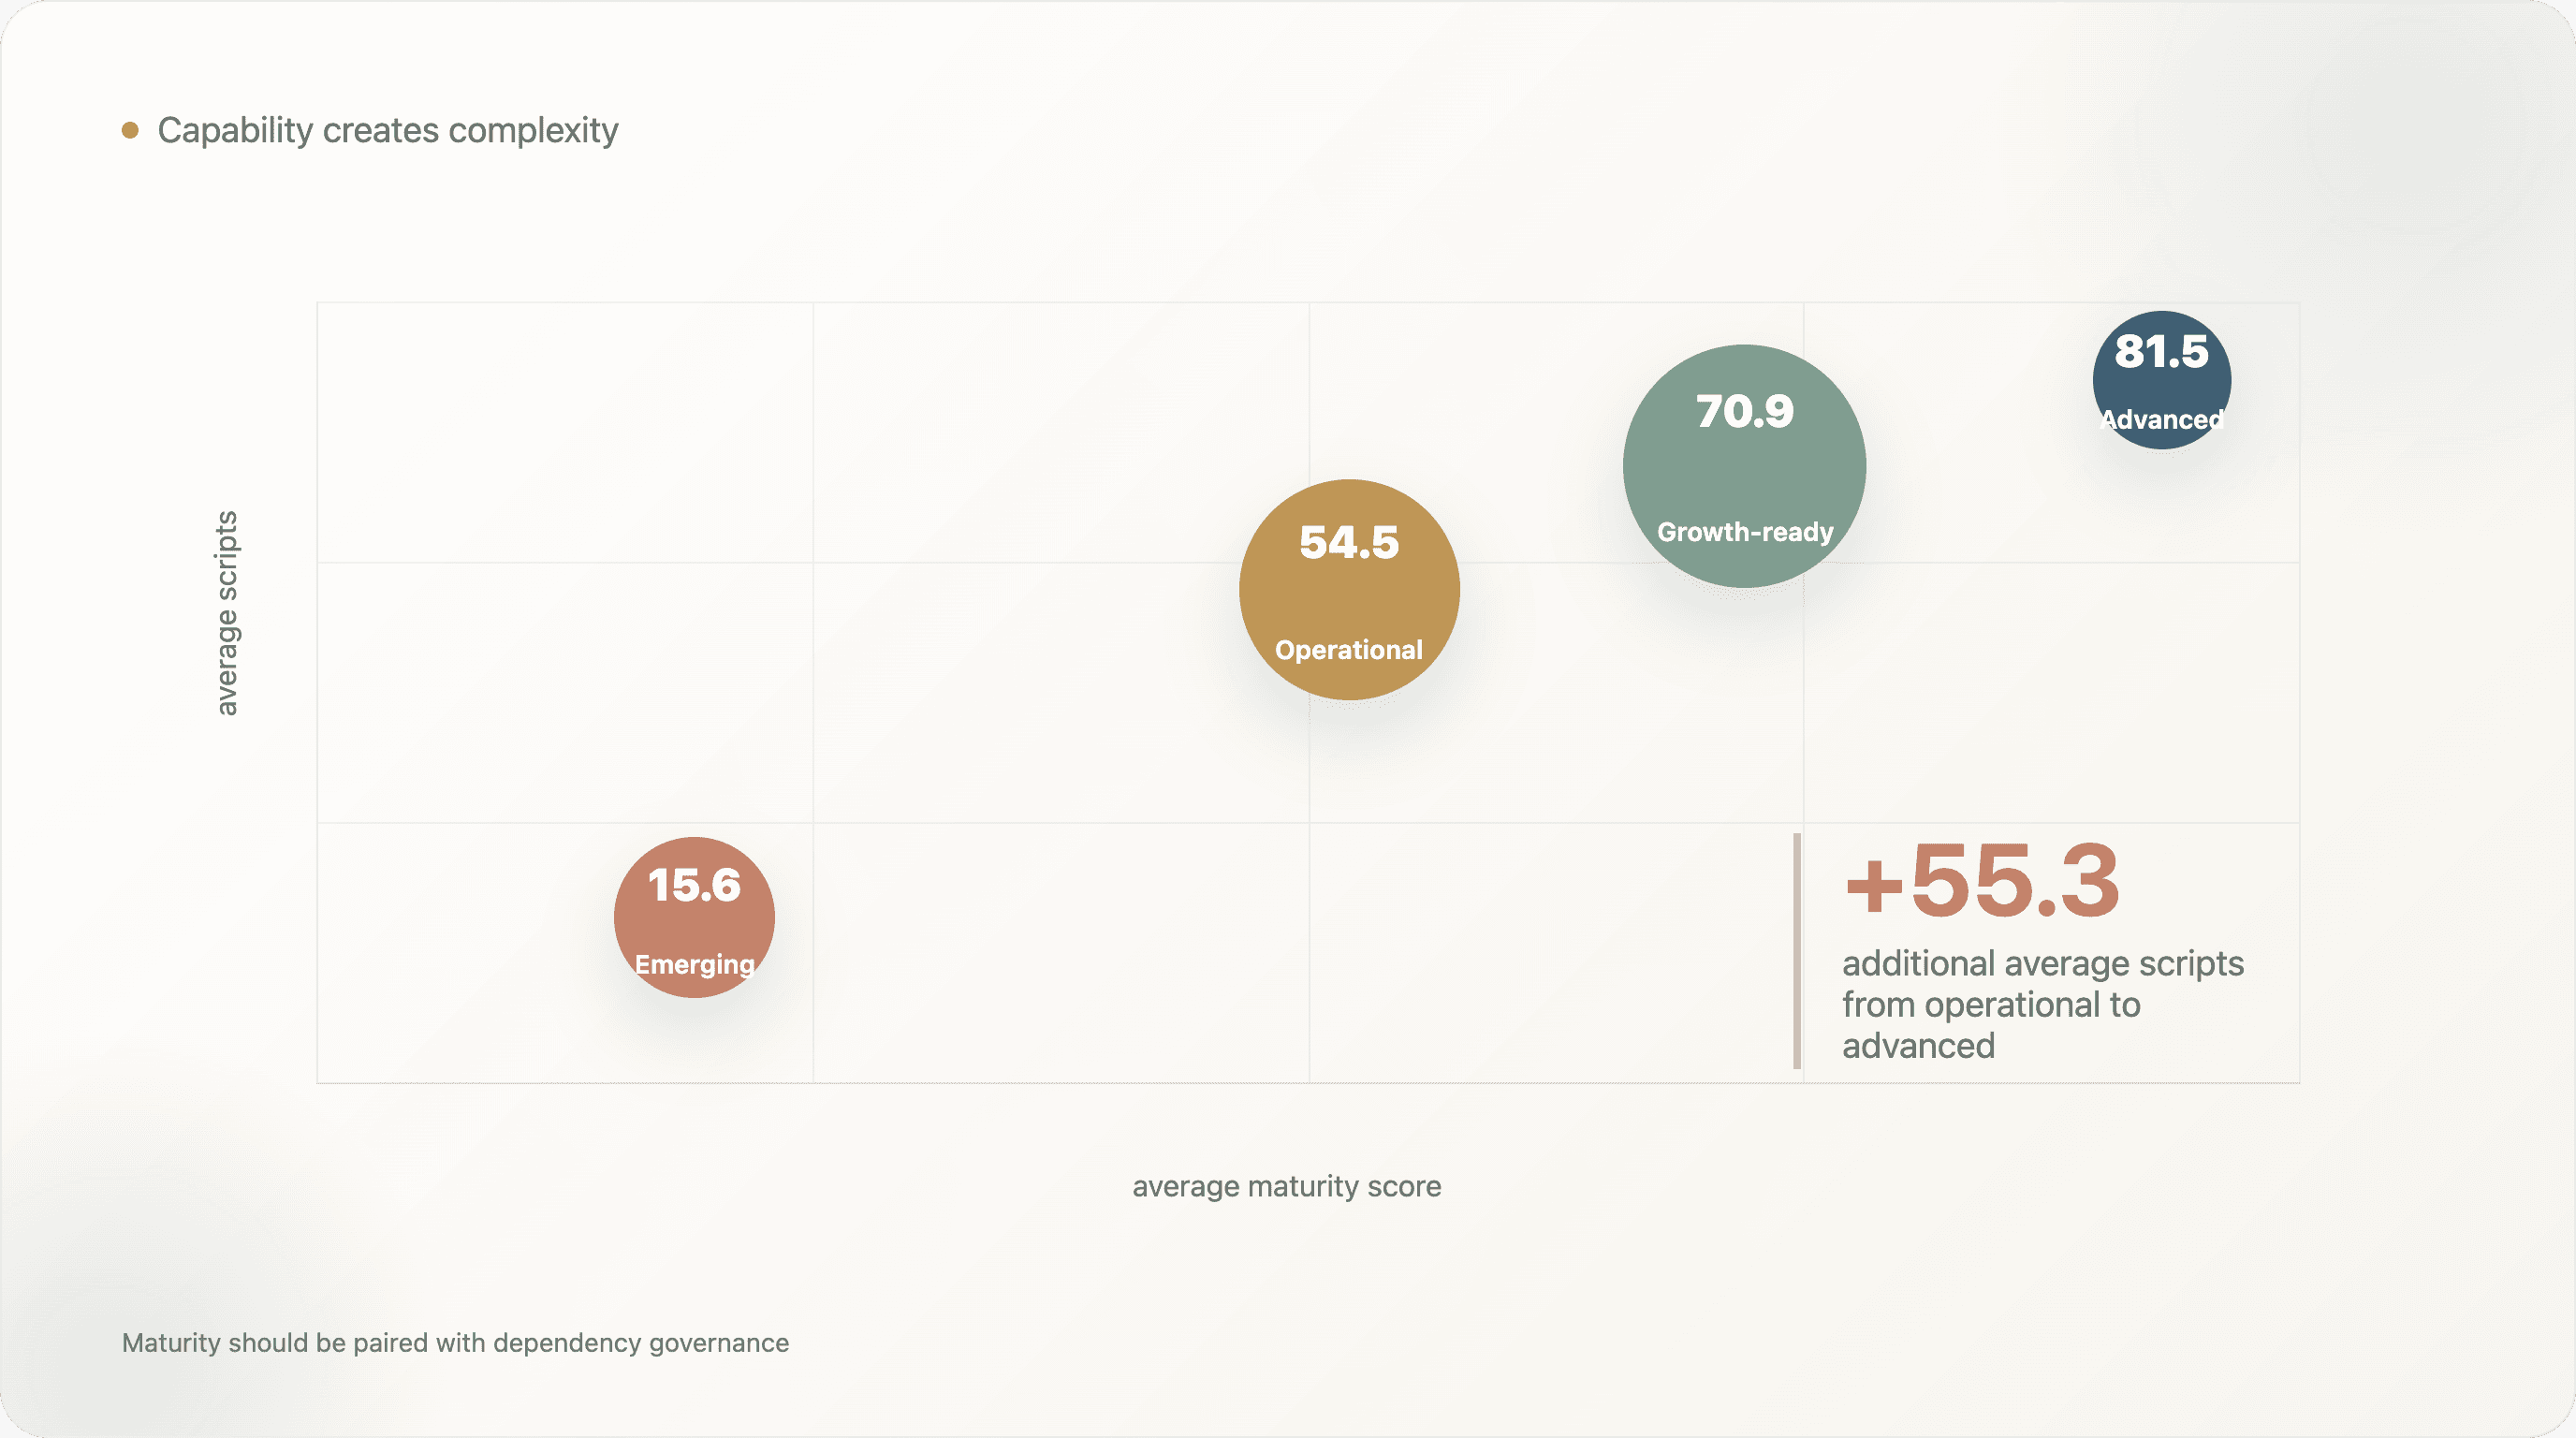
This does not mean scripts are bad. A script may support attribution, reviews, chat, personalization, experimentation, consent, analytics, or support. Those are real capabilities. But each script also adds potential cost: slower pages, QA risk, consent complexity, data leakage risk, tag conflicts, attribution noise, and vendor maintenance.
This is why a maturity index should not be interpreted as "more tools is always better." The best operators are not the ones with the most tools. They are the ones with the right tools, clear ownership, clean event governance, and a review cycle for dependencies.
The maturity paradox is useful for teams because it reframes the question. The goal is not to maximize score at any cost. The goal is to build the next layer only when the organization can operate it.
8. How Operators Can Use the Index
The practical use of the index is diagnostic. Teams can score themselves against the dimensions, then ask which layer is the real constraint.
If acquisition analytics is weak, the team may not trust campaign performance data. The next step is event cleanup, GA4 validation, pixel governance, or attribution review.
If retention lifecycle is weak, the team may be too dependent on paid acquisition. The next step is email capture, segmentation, SMS strategy, loyalty, subscription, or replenishment flows.
If commerce and payment is weak, checkout may be creating unnecessary friction. The next step is payment optionality, one-click checkout, BNPL testing for high-AOV products, or international payment review.
If customer experience is weak, the team may lack public trust and post-purchase systems. The next step is reviews, support workflows, returns, quiz, personalization, or upsell.
If technical discoverability is weak, SEO basics are likely holding back organic growth. The next step is metadata, canonical tags, schema, crawlability, and page templates.
If AI search is weak, the brand may be discoverable only at a thin level. The next step is structured product data, better llms.txt quality, product-page facts, and clean entity signals.
If social distribution is weak, the website may not route visitors to active owned social channels. The next step is a social link audit and channel role definition.
If compliance and observability is weak, the site may have limited public evidence of consent, monitoring, or resilience. The next step is consent management, error monitoring, performance monitoring, or privacy review.
9. What Content Marketers Can Cite
This research creates several strong citation angles:
"Only 0.2% of scored DTC domains reached the advanced tier." This is the broadest maturity hook.
"Technical discoverability is the strongest DTC maturity layer, while compliance and observability is the weakest." This is useful for SEO and operations audiences.
"The head-versus-tail maturity gap is smaller than expected." This is useful for founder and growth audiences because it challenges brand-size assumptions.
"Growth-ready brands have more scripts." This connects maturity to performance and governance.
"DTC maturity is multi-layered." This can anchor articles about why platform choice alone no longer explains ecommerce competitiveness.
The key is to cite the caveat: these are public website signals from 1,238 scored domains, not internal business performance.
10. How to Use the Index by Team
The maturity index is most useful when different teams read it through their own operating lens. A founder, a lifecycle marketer, an SEO lead, and a frontend engineer will not see the same problem, even if they are looking at the same score.
For founders and general managers, the index is a prioritization tool. A low score does not mean the business is weak. It means the public storefront is not yet showing many mature operating layers. The immediate question is: which missing layer is most likely to unlock the next stage of growth? For an early brand, that may be retention capture and clean checkout. For a mid-market brand, it may be reviews, support, attribution, or structured product data. For a brand preparing for international expansion, it may be compliance, hreflang, payment localization, and consent.
For growth teams, the index helps separate acquisition problems from operating-system problems. If paid performance is weak but acquisition analytics is also weak, the first job is measurement, not more spend. If paid performance is expensive but retention lifecycle is weak, the team may be overusing acquisition to compensate for poor repeat-purchase infrastructure. If social distribution is weak, the brand may be losing the chance to route high-intent website visitors into owned audience channels.
For lifecycle teams, the retention score is the starting point. Many brands have the basic store and checkout layer but do not show strong lifecycle infrastructure. A retention team can use this benchmark to argue for email capture improvements, segmentation, SMS testing, replenishment flows, loyalty, subscription logic, and post-purchase education. The strongest lifecycle programs are not just email campaigns; they are connected to product-page education, checkout behavior, customer support, and repeat-purchase timing.
For SEO and content teams, the technical discoverability and AI-search dimensions matter most. Traditional SEO basics are relatively strong in the sample, but AI-search readiness remains early. That creates a clear content and technical roadmap: improve product-page schema, expose product facts, clean up metadata, align category pages with search intent, and make product claims easier for machines and humans to verify. SEO teams can use the index to move beyond keyword rankings into storefront readiness.
For customer-experience teams, the low customer-experience score is an opportunity. Reviews, support, returns, quizzes, personalization, upsell, and trust infrastructure are not only service layers. They shape conversion. If shoppers cannot see proof, ask questions, understand fit, compare options, or recover after a poor experience, the brand will pay for that friction in conversion rate and retention.
For engineering and marketing operations, the index should be paired with a dependency audit. Higher maturity often means more scripts, more tools, and more integration points. That does not make maturity bad; it means maturity needs governance. Engineering should not be asked simply to "make the site faster" while every team continues adding vendors. The index can create a shared language: which capability is worth its technical cost?
11. A Practical Maturity Roadmap
The index can be turned into a simple staged roadmap.
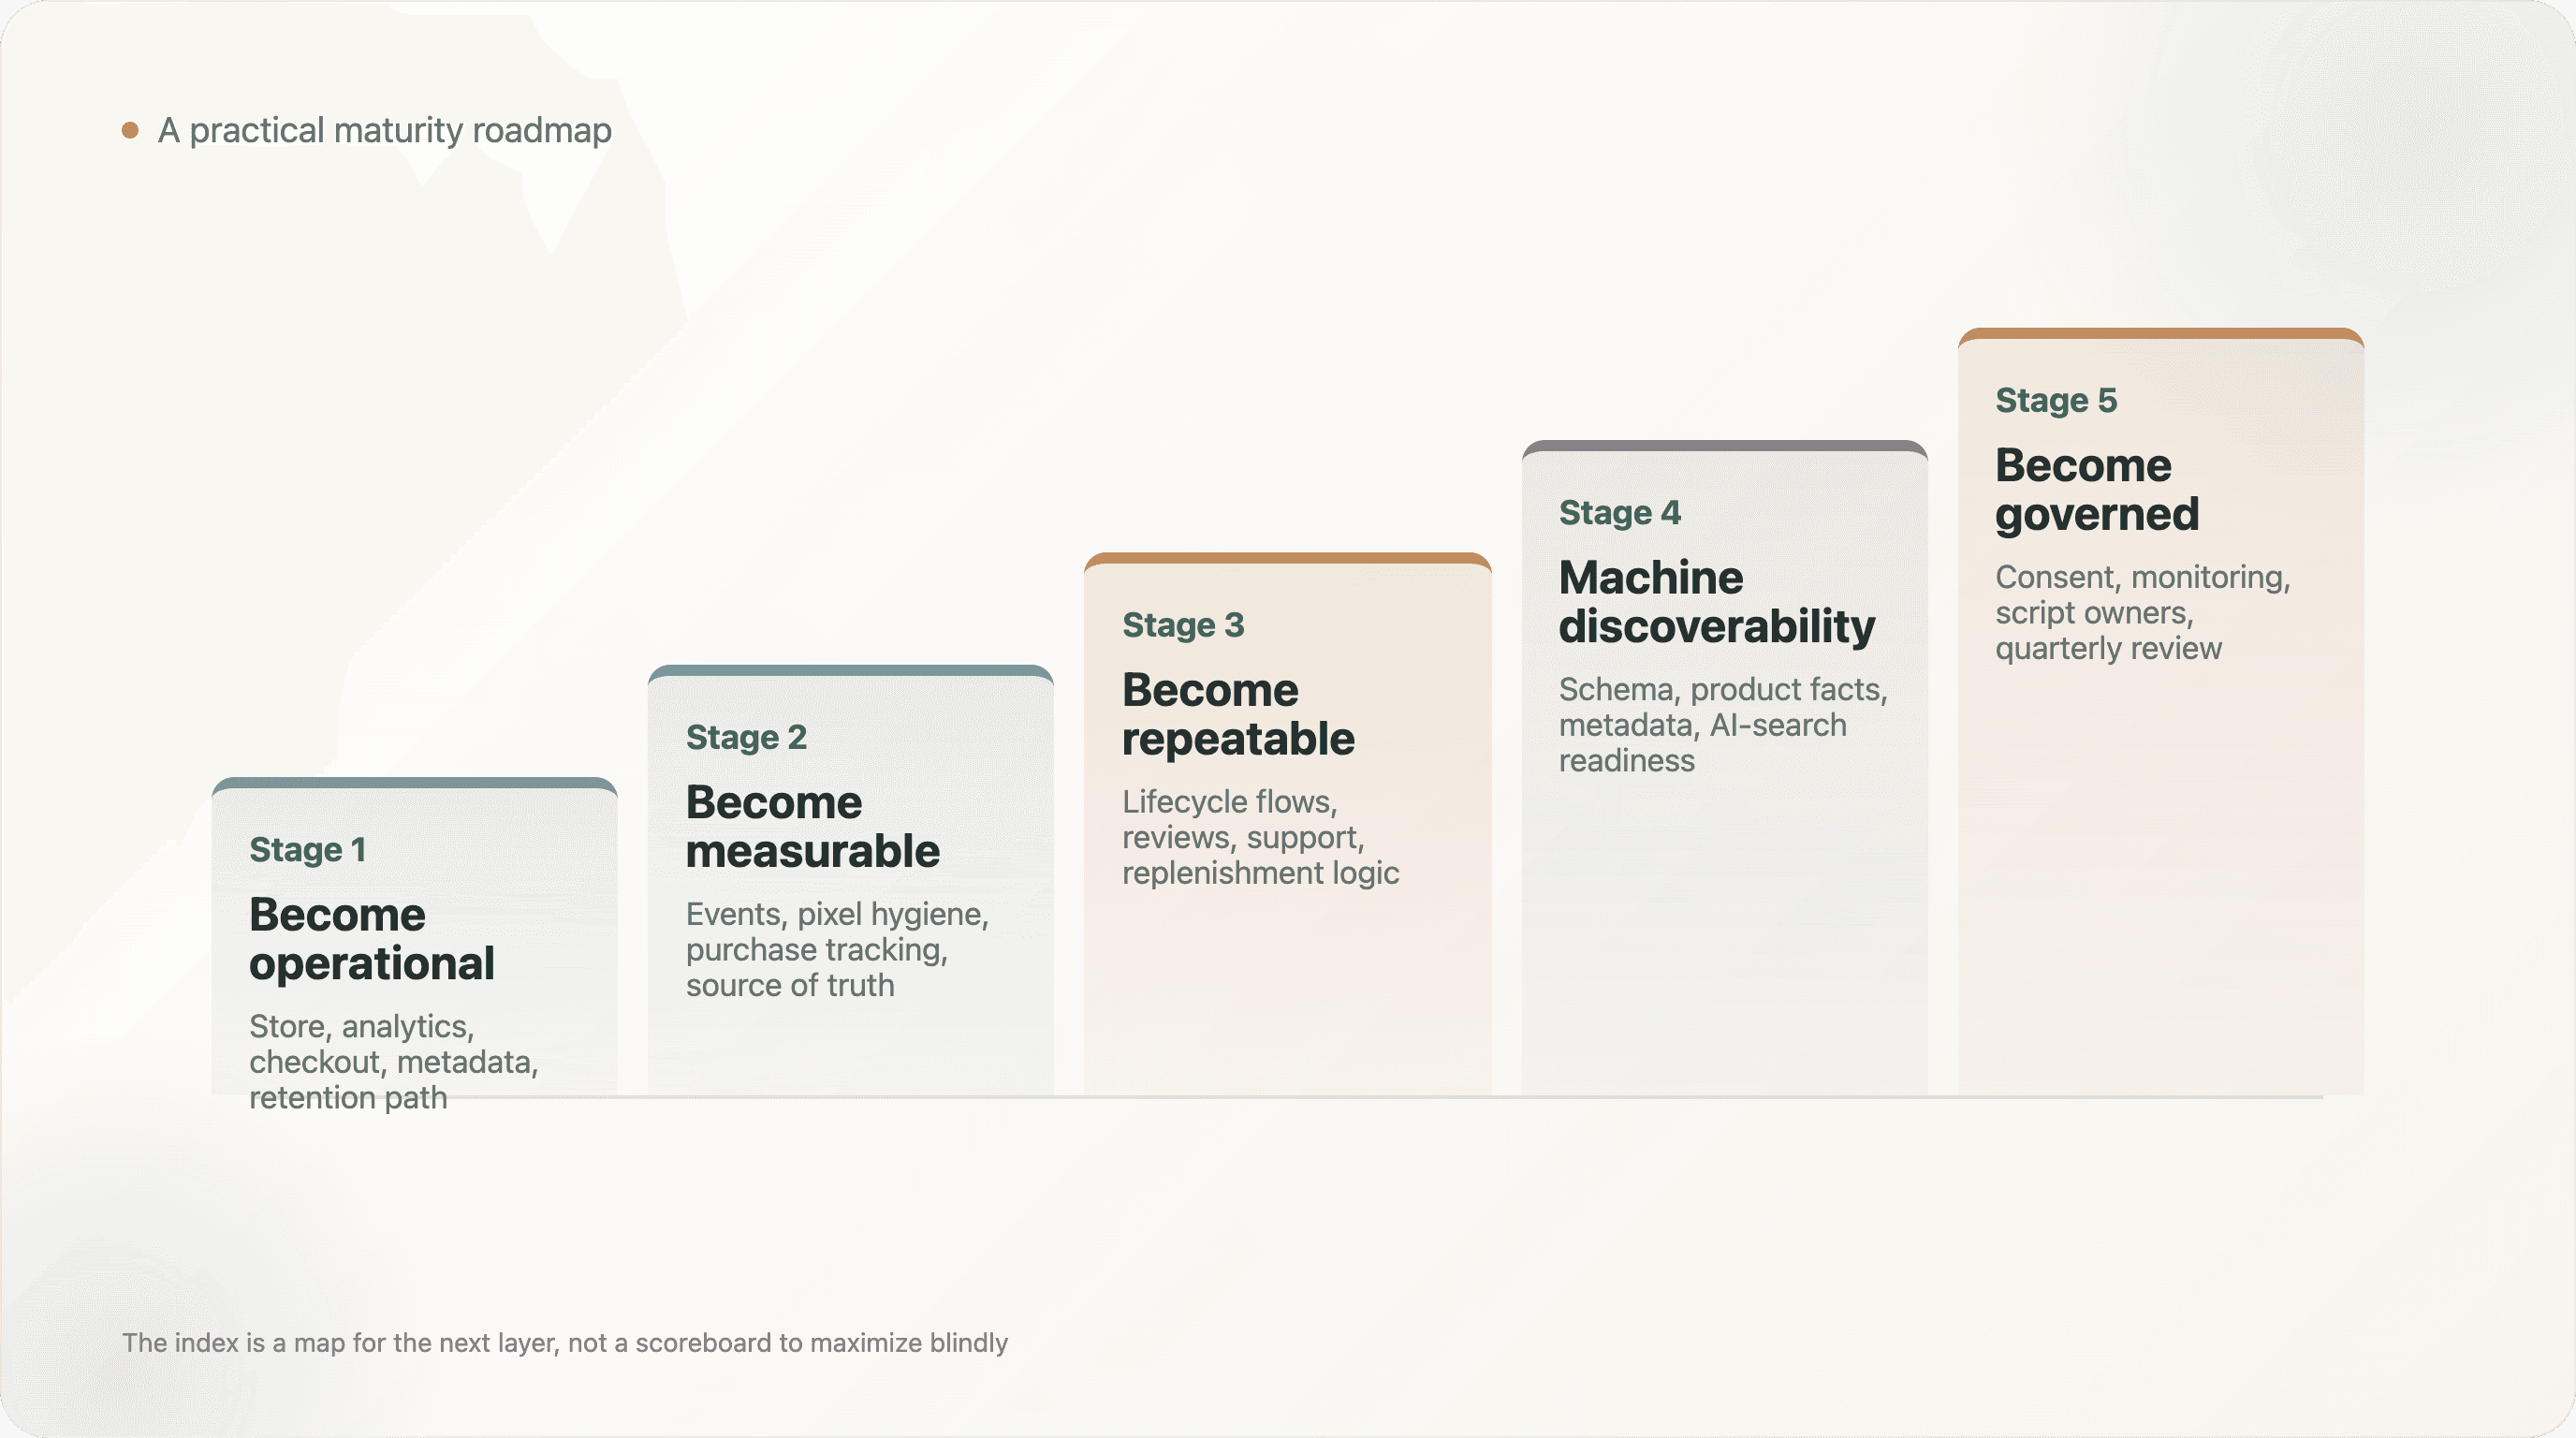
Stage 1: Become operational. Make sure the store works, analytics are installed, checkout is familiar, metadata exists, and the brand has at least one clear retention path. This is the table-stakes layer.
Stage 2: Become measurable. Clean up acquisition events, deduplicate pixels, validate purchase tracking, and decide which dashboard is the source of truth. A brand cannot scale confidently if every channel reports a different answer.
Stage 3: Become repeatable. Build lifecycle flows, post-purchase journeys, customer support workflows, reviews, and replenishment logic. This is where the brand starts to rely less on paid acquisition alone.
Stage 4: Become discoverable to machines. Add structured product data, improve metadata, validate schema, and make product and policy facts clear. This is increasingly important as AI search and shopping agents become part of product discovery.
Stage 5: Become governed. Add consent and observability, review scripts, assign owners to tools, and create a quarterly stack review. Mature brands do not simply add more infrastructure; they govern it.
This roadmap is intentionally practical. A small brand does not need to chase every advanced signal. The right next layer depends on stage, category, AOV, team size, traffic mix, and international ambitions. The index is a map, not a scoreboard.
Methodology
The index was built from the DTC dual-report dataset collected on May 11, 2026. It scored 1,238 domains using inputs from master.csv, detection.csv, seo_signals.csv, categories.csv, and perf_metrics.csv.
The model assigns up to 100 points across eight dimensions: acquisition analytics, retention lifecycle, commerce and payment, customer experience, technical discoverability, AI search, social distribution, and compliance / observability. The score is designed to reflect public operating signals, not business outcomes.
The index is intentionally different from a tool count. It rewards multiple operating layers and balanced maturity. It also allows brands to score well through different paths depending on category and operating model.
Caveats
-
This is not a revenue or brand-quality ranking. A high score means more observable operating layers, not necessarily better business performance.
-
The sample is not a full DTC census. It is biased toward brands visible in ecommerce tool ecosystems and public DTC lists.
-
Public detection is a lower bound. Some tools and signals load dynamically, behind consent, or through client-side rendering.
-
Category labels are directional. They are useful for pattern analysis but not exact taxonomy.
-
The scoring weights are editorial and practical. They are meant to create a useful operating benchmark, not a universal scientific truth.
-
Maturity creates complexity. Higher scores often correlate with more scripts and more dependencies, so the score should be interpreted with governance in mind.
Reproducibility Notes
The delivery folder includes:
analyze_maturity_index.py— analysis script used to score domains across the eight maturity dimensions and assign maturity tiers.dtc_maturity_index_scores.csv— domain-level maturity scores, dimension scores, and tier assignments.dimension_benchmarks.csv— average, median, p75, and maximum score by maturity dimension.maturity_by_tier.csv— tier-level benchmarks and distribution summaries.maturity_by_category.csv— category-level maturity benchmarks.head_vs_tail_maturity.csv— maturity comparison by source-visibility segment.top_maturity_brands.csv— highest-scoring domains for editorial review and example selection.summary.json— headline aggregate metrics quoted in this report, including sample size, average score, median score, tier distribution, advanced-or-elite share, and strongest / weakest dimension averages.
Methodology corrections, dataset issues, and follow-up analyses welcome at support@thunderbit.com. This report is published independent of any commercial position Thunderbit holds; we build an AI-powered web scraper, and we have a structural interest in public ecommerce websites remaining inspectable enough for operators, researchers, search engines, and AI agents to understand how brands operate online. The index is based on 1,238 scored DTC domains from public website signals collected on May 11, 2026. The data in this report stands on its own. — The Thunderbit research team, May 2026.