
Reader Positioning
This report is written for the people who live with the consequences of a modern DTC stack: growth leads, ecommerce managers, performance marketers, lifecycle teams, marketing operations, technical SEO teams, frontend engineers, analytics owners, and founders who keep asking why the site feels slow even though every tool seems necessary.
The original DTC website benchmark showed which tools brands use. This research asks a different question: what is the operational cost of stacking those tools on the storefront?
The answer is not "tools are bad." DTC brands use analytics, retention, attribution, reviews, chat, support, payment, upsell, and experimentation tools because those tools solve real revenue problems. The point is that every additional layer has a front-end cost, a QA cost, a consent cost, a data-quality cost, and a maintenance cost. Growth stacks create growth capacity, but they also create infrastructure drag.
For SEO and ecommerce content writers, this report provides a more useful angle than "DTC brands use lots of tools." The stronger story is: the default DTC growth playbook has become a performance and governance problem.
Executive Summary
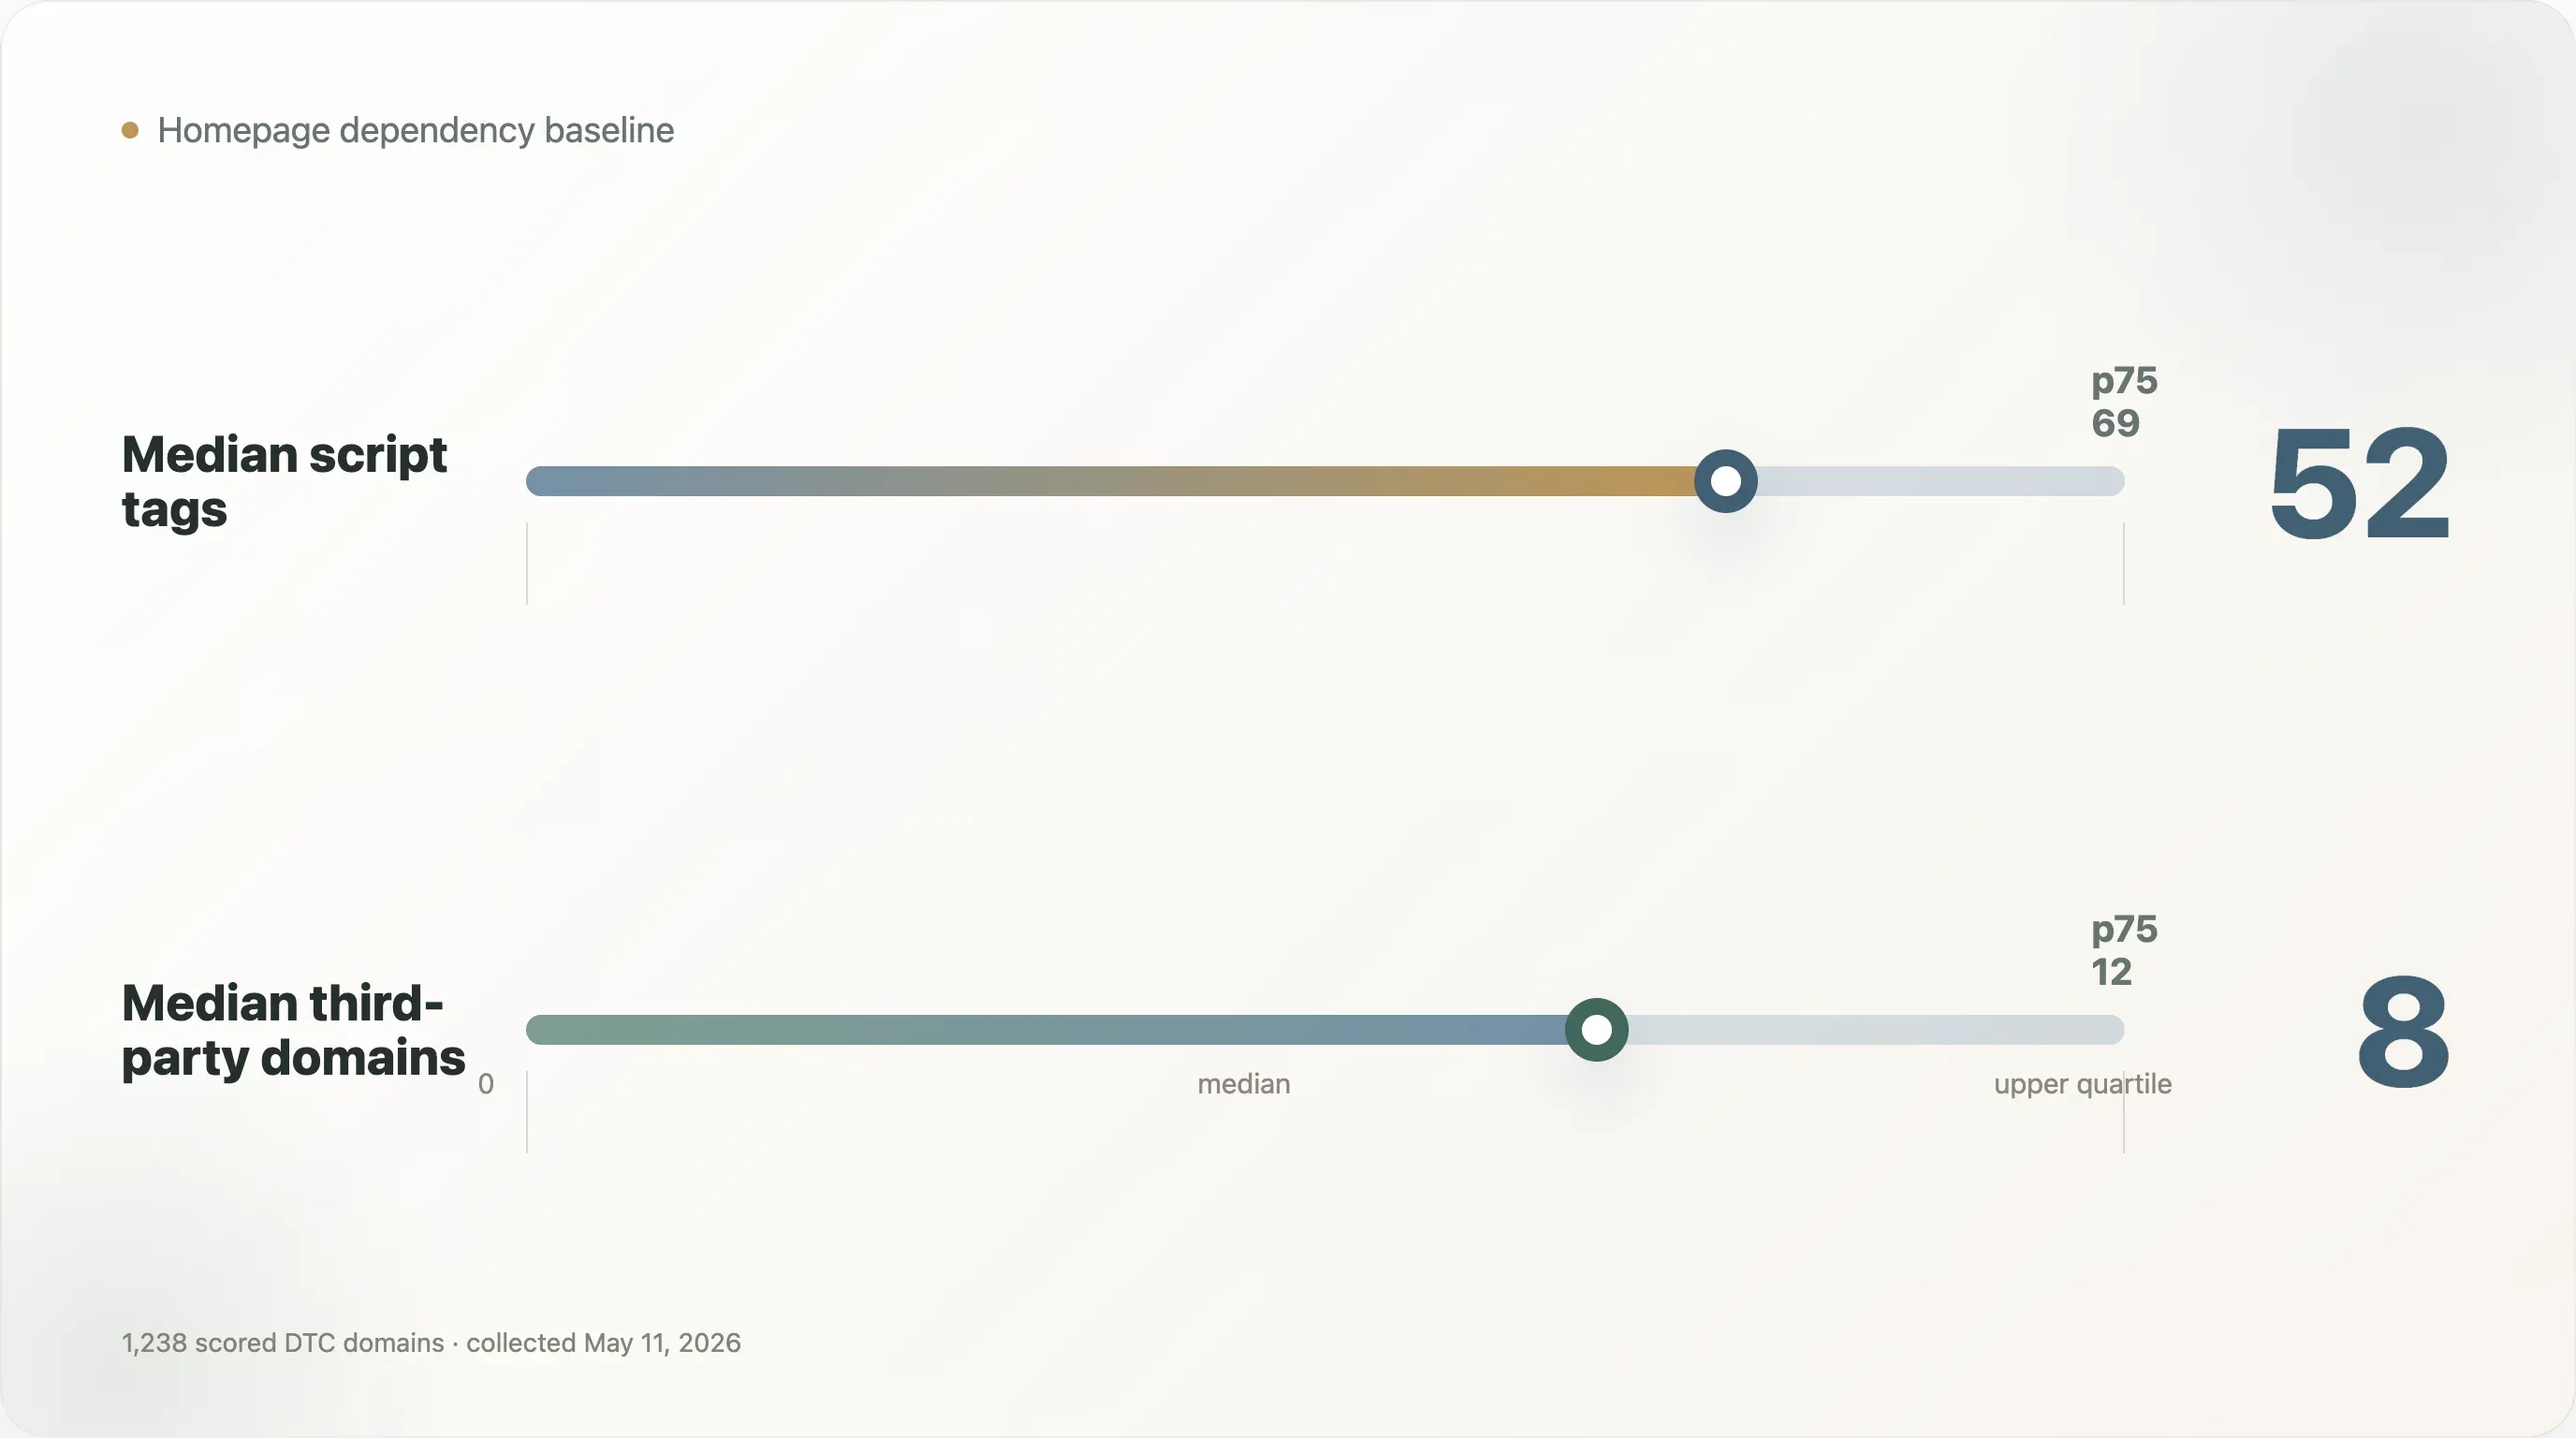
Across 1,238 scored DTC domains, the median homepage in this sample contains 52 script tags and references 8 third-party domains. These are not abstract technical details. Scripts and third-party domains are the browser-side evidence of a brand's growth stack: analytics, pixels, retention tools, chat, reviews, personalization, payment, upsell, experimentation, consent, and support.
The cost becomes obvious when brands are grouped by analytics and marketing depth:
| Analytics depth bucket | Sample | Median scripts | Median third-party domains | Avg stack depth | Consent manager coverage |
|---|---|---|---|---|---|
| 0 analytics tools | 157 | 1 | 0 | 0.0 | 0.0% |
| 1-2 analytics tools | 336 | 30 | 6 | 2.2 | 3.6% |
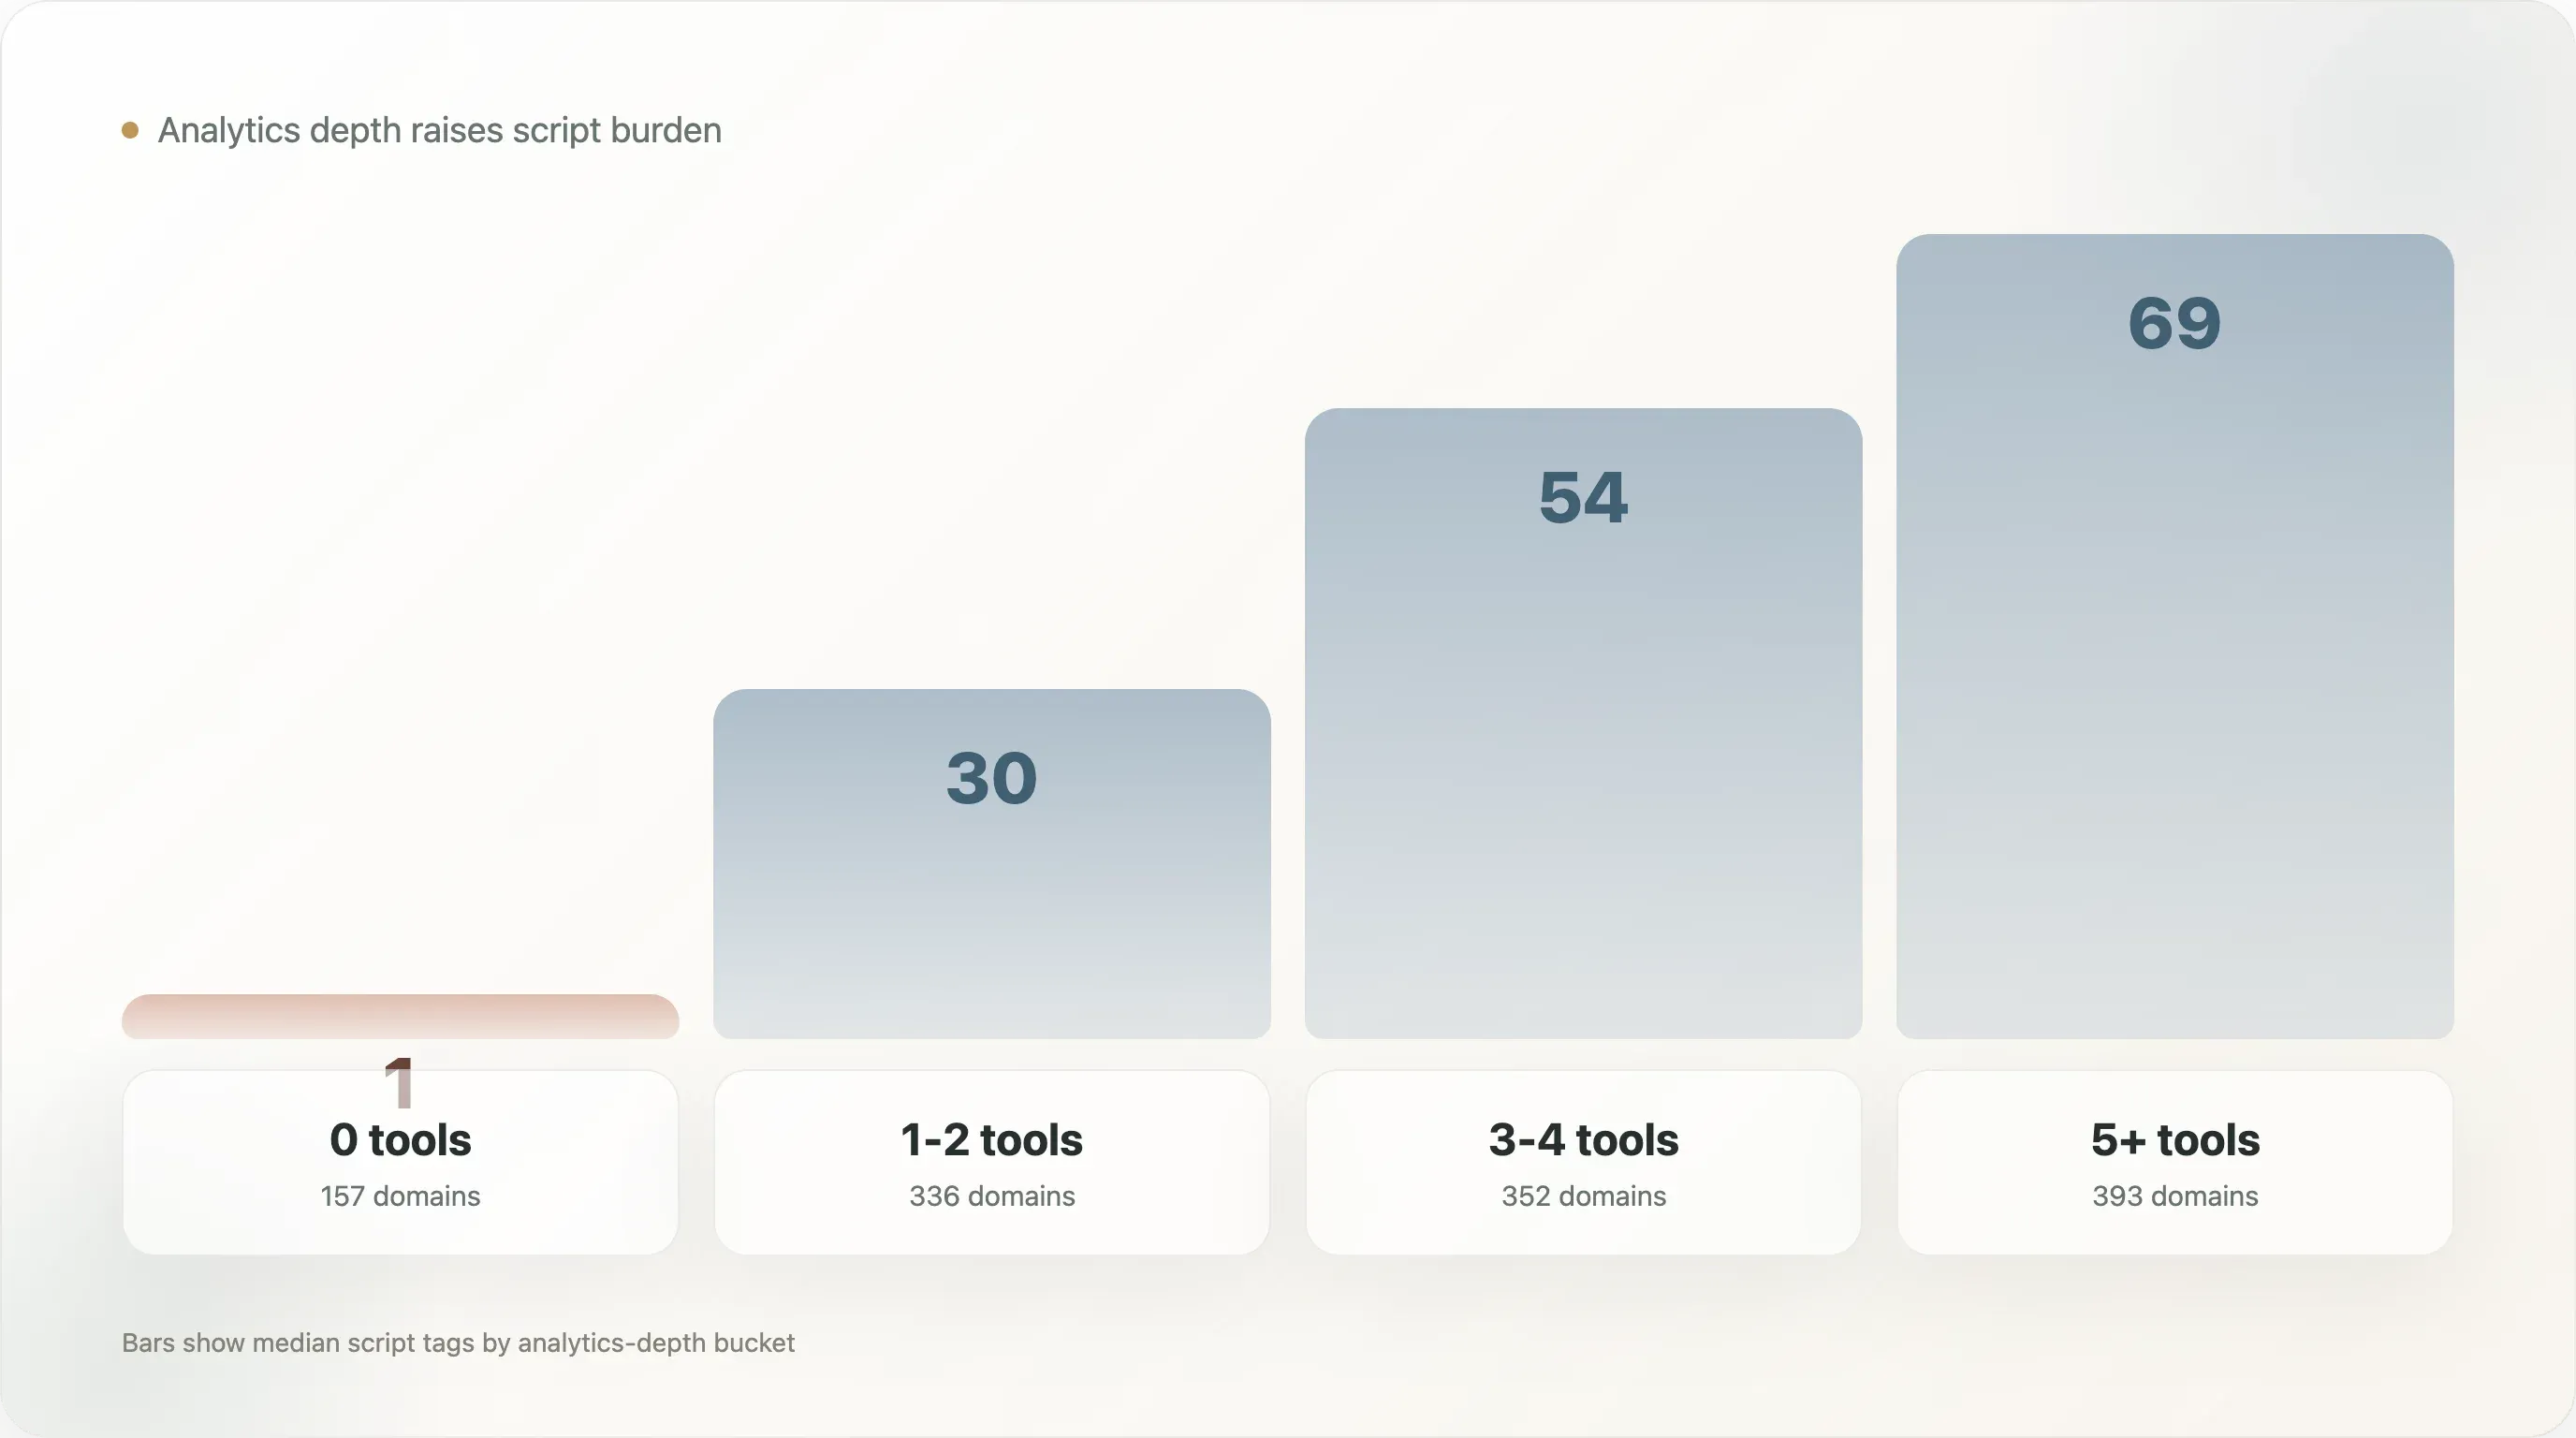
| 3-4 analytics tools | 352 | 54 | 8 | 4.9 | 14.8% |
| 5+ analytics tools | 393 | 69 | 11 | 8.2 | 14.0% |
The difference is stark. Brands with 0-2 analytics tools have a median of 16 scripts and 4 third-party domains when the first two buckets are combined. Brands with 5+ analytics tools have a median of 69 scripts and 11 third-party domains. In other words, the heavier growth stack carries more than four times the script burden of the low-analytics group.
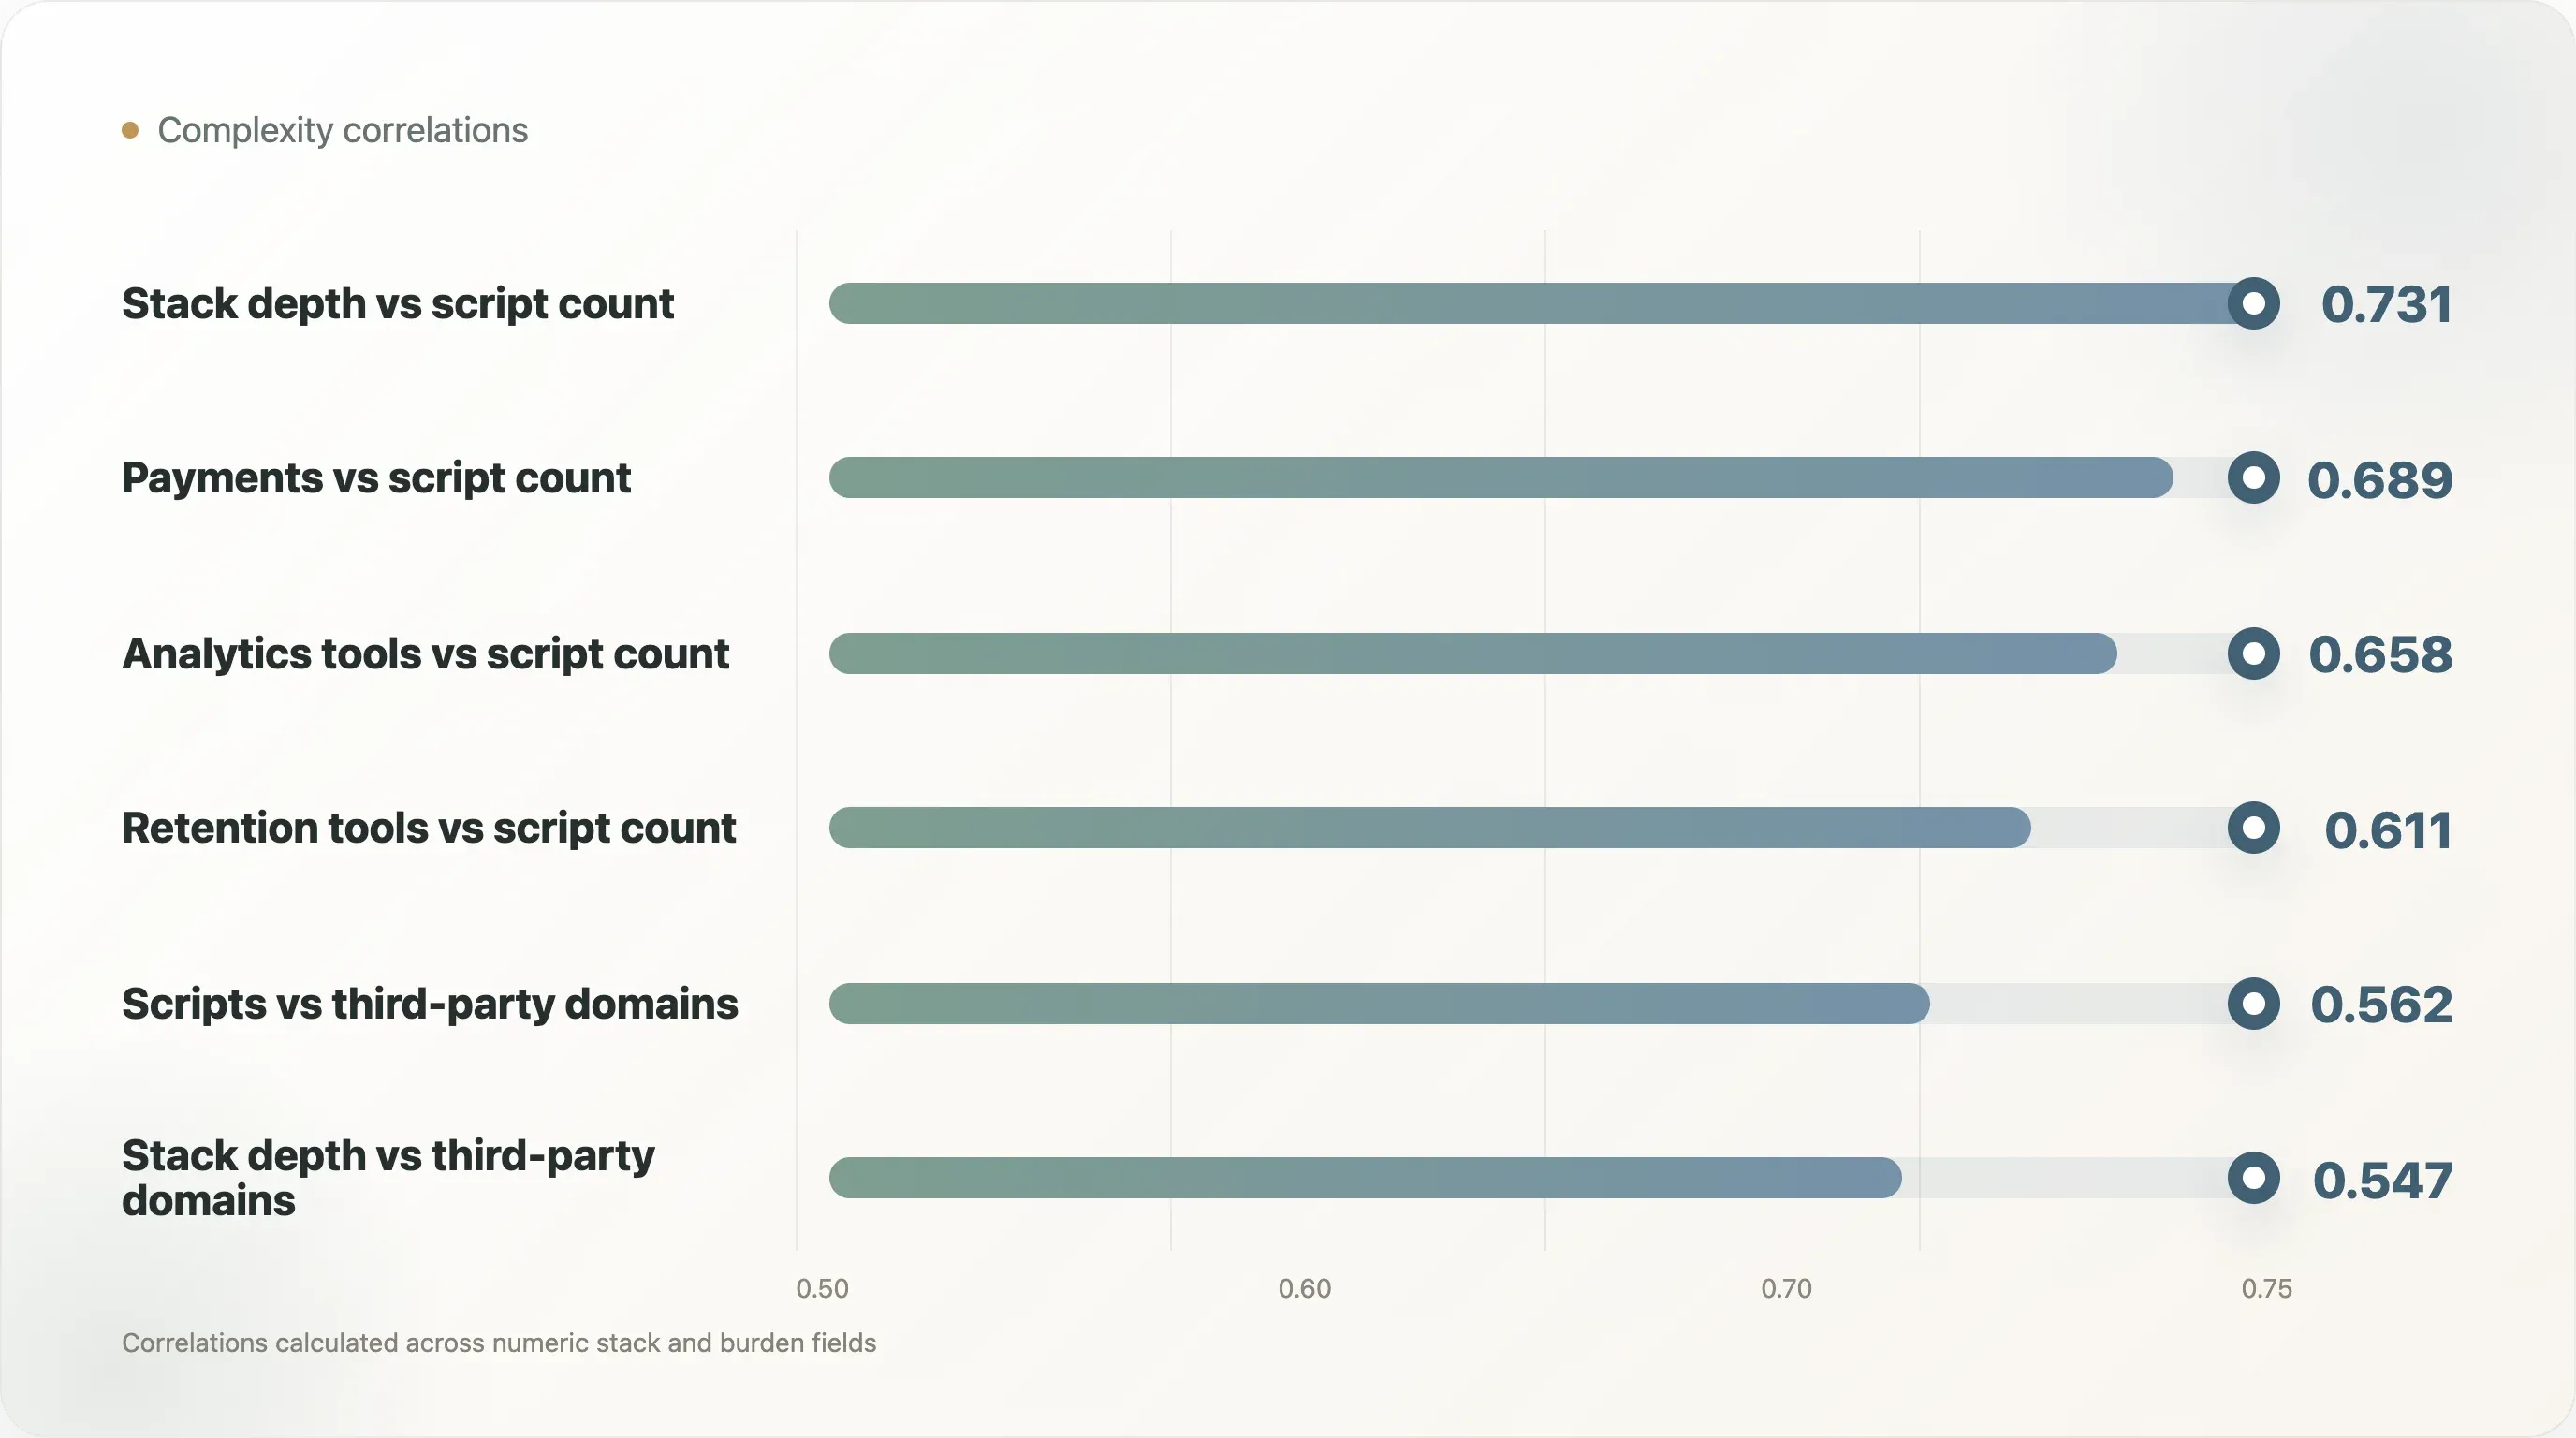
The correlation data supports the same story. Stack depth has a 0.731 correlation with script count and 0.547 correlation with third-party domains. Number of analytics tools has a 0.658 correlation with script count and 0.557 with third-party domains. Retention tool count also correlates meaningfully with script count at 0.611. This is not just a few outliers. It is a structural pattern: as the public growth stack expands, browser-side complexity rises.
The report also surfaces a privacy and governance gap. Consent management, measured here through Cookiebot / OneTrust-style visible signals, appears on only 9.6% of scored domains. Among brands with 5+ analytics tools, consent-manager coverage is 14.0%. This does not prove the other brands are non-compliant, because consent tools can be implemented in ways this detection misses. But it does show that many tracking-heavy sites do not expose an obvious consent-management signal in captured HTML.
Finally, 16.2% of domains fall into the extreme script-burden tier, defined here as more than 75 script tags. That is a useful benchmark for technical SEO, growth operations, and frontend teams. If a DTC homepage has more than 75 scripts, it is no longer just a marketing page. It is an infrastructure surface that needs ownership.
The central conclusion: DTC growth maturity and storefront complexity rise together. The next advantage is not adding more tools. It is governing the stack you already have.
The Most Shareable Findings
-
The median DTC homepage in this sample has 52 script tags and 8 third-party domains.
-
Brands with 5+ analytics tools have a median of 69 scripts and 11 third-party domains.
-
Brands with 0-2 analytics tools have a median of 16 scripts and 4 third-party domains.
-
16.2% of scored domains fall into the extreme script-burden tier.
-
Consent-management visibility is only 9.6% overall and 14.0% even among brands with 5+ analytics tools.
-
Stack depth correlates strongly with script count at 0.731.
-
The DTC growth stack is no longer just a marketing stack. It is front-end infrastructure.
1. Why Growth Stack Cost Matters
DTC teams usually evaluate tools through expected upside: better attribution, more email revenue, higher AOV, better support, cleaner reviews, stronger personalization, improved retention, better paid-media optimization, or more conversion lift. That is reasonable. Growth teams are paid to grow.
But every tool also creates cost. Some costs are visible: subscription fees, implementation work, and contract management. Other costs are harder to see: slower pages, more JavaScript, more third-party calls, more QA states, more consent logic, more tag conflicts, more attribution discrepancies, more privacy review, and more vendor ownership questions.
This report focuses on the hidden cost. It uses script count, third-party domain count, stack depth, tool categories, platform groups, and category groups as proxies for complexity. It does not claim that a high script count is always bad. A high-performing brand may rationally carry more scripts because each one supports a revenue function. But high complexity without governance is dangerous.
The right question is not "how do we remove every tool?" The right question is: which tools are still earning their place on the page?
2. The Baseline: 52 Scripts and 8 Third-Party Domains
The median homepage in the sample has:
- 52 script tags
- 8 third-party domains
The p75 values from the underlying performance research are higher: 69 scripts and 12 third-party domains. The maximum script count is much higher, but the report focuses on distribution rather than using outliers as negative examples.
For operators, the median is already enough to make the point. A DTC homepage is rarely just HTML, CSS, product imagery, and a checkout path. It is a coordination layer for many systems: analytics, pixels, tag management, session recording, reviews, support, quizzes, popups, subscriptions, personalization, payments, consent, and experiments.
The hidden cost appears in several places:
Performance cost. More scripts can delay rendering, compete for main-thread time, increase network requests, and affect Core Web Vitals.
QA cost. Every vendor script adds states to test: desktop, mobile, consent accepted, consent rejected, logged-in, logged-out, cart state, checkout path, regional domain, and browser differences.
Attribution cost. More tags do not always create better data. They can create conflicting numbers, duplicate events, or channel-credit disagreements.
Privacy cost. More tracking surfaces create more consent and compliance questions.
Ownership cost. Tools often outlive the person who installed them. A script can remain on the site long after the team stops using the dashboard.
That is why the growth stack should be managed like infrastructure, not like a pile of marketing add-ons.
3. Analytics Depth Is the Clearest Cost Driver
The strongest table in the research is the analytics-depth breakdown:
| Analytics depth bucket | Sample | Median scripts | Avg scripts | Median third-party domains | Avg third-party domains | Avg stack depth |
|---|---|---|---|---|---|---|
| 0 analytics tools | 157 | 1 | 3.1 | 0 | 1.3 | 0.0 |
| 1-2 analytics tools | 336 | 30 | 35.0 | 6 | 6.5 | 2.2 |
| 3-4 analytics tools | 352 | 54 | 51.1 | 8 | 9.1 | 4.9 |
| 5+ analytics tools | 393 | 69 | 69.1 | 11 | 11.3 | 8.2 |
This table turns a vague concern into a concrete benchmark. Moving from 1-2 analytics tools to 3-4 tools nearly doubles the median script count, from 30 to 54. Moving to 5+ tools raises the median again to 69.
The 0-tool group should not be interpreted as better. Many of those sites may be incomplete, parked, very simple, heavily client-rendered, or under-detected. The useful comparison is between the mainstream operating groups: 1-2, 3-4, and 5+ analytics tools.
The 5+ analytics group is especially important. These are the brands most committed to measurement and growth operations. They are likely to care about paid acquisition, retention, attribution, session behavior, support, reviews, or conversion optimization. But they also carry the heaviest dependency burden.
That is the growth-stack paradox: the brands most serious about measurement are also the brands most exposed to measurement overhead.
4. Correlations: This Is Structural, Not Anecdotal
The correlation matrix shows that stack complexity is not random.
| Pair | Correlation |
|---|---|
| Stack depth vs script count | 0.731 |
| Analytics tools vs script count | 0.658 |
| Payments vs script count | 0.689 |
| Retention tools vs script count | 0.611 |
| Stack depth vs third-party domains | 0.547 |
| Analytics tools vs third-party domains | 0.557 |
| Script count vs third-party domains | 0.562 |
Stack depth has the strongest relationship with script count. That is expected, but it matters because stack depth is often treated as progress. More tools mean more capabilities. But they also mean more front-end weight.
Payments show a surprisingly strong correlation with script count at 0.689. That does not mean payment methods are bad. It means checkout optionality and payment integrations are part of the complexity picture. A brand that supports multiple payment paths may improve conversion, especially for high-AOV categories, but those integrations still belong in the technical governance map.
Retention tool count correlates with script count at 0.611. That makes intuitive sense. Lifecycle tools often add onsite forms, popups, identification scripts, SMS capture, personalization, and event collection. Retention does not live only in email. It lives on the storefront.
The governance implication is clear: performance cannot be solved by engineering alone. Marketing, lifecycle, retention, paid media, analytics, and ecommerce all place code on the page. They all need to participate in performance governance.
5. Platform Patterns: Shopify Sites Carry a Heavier Visible Stack
Platform-level comparisons should be interpreted carefully because the sample is biased toward ecommerce tool ecosystems, and Shopify is overrepresented. Still, the platform table is useful as a public-signal benchmark.
| Platform | Sample | Median scripts | Median third-party domains | Avg stack depth | Consent manager coverage |
|---|---|---|---|---|---|
| Shopify | 783 | 64 | 9 | 6.3 | 11.1% |
| Unknown | 324 | 6 | 2 | 1.2 | 7.1% |
| WordPress | 23 | 24 | 6 | 2.3 | 13.0% |
| Salesforce Commerce Cloud | 10 | 47 | 10 | 3.9 | 30.0% |
| Magento / Adobe Commerce | 6 | 55.5 | 7.5 | 3.8 | 0.0% |
| BigCommerce | 3 | 55 | 9 | 3.7 | 0.0% |
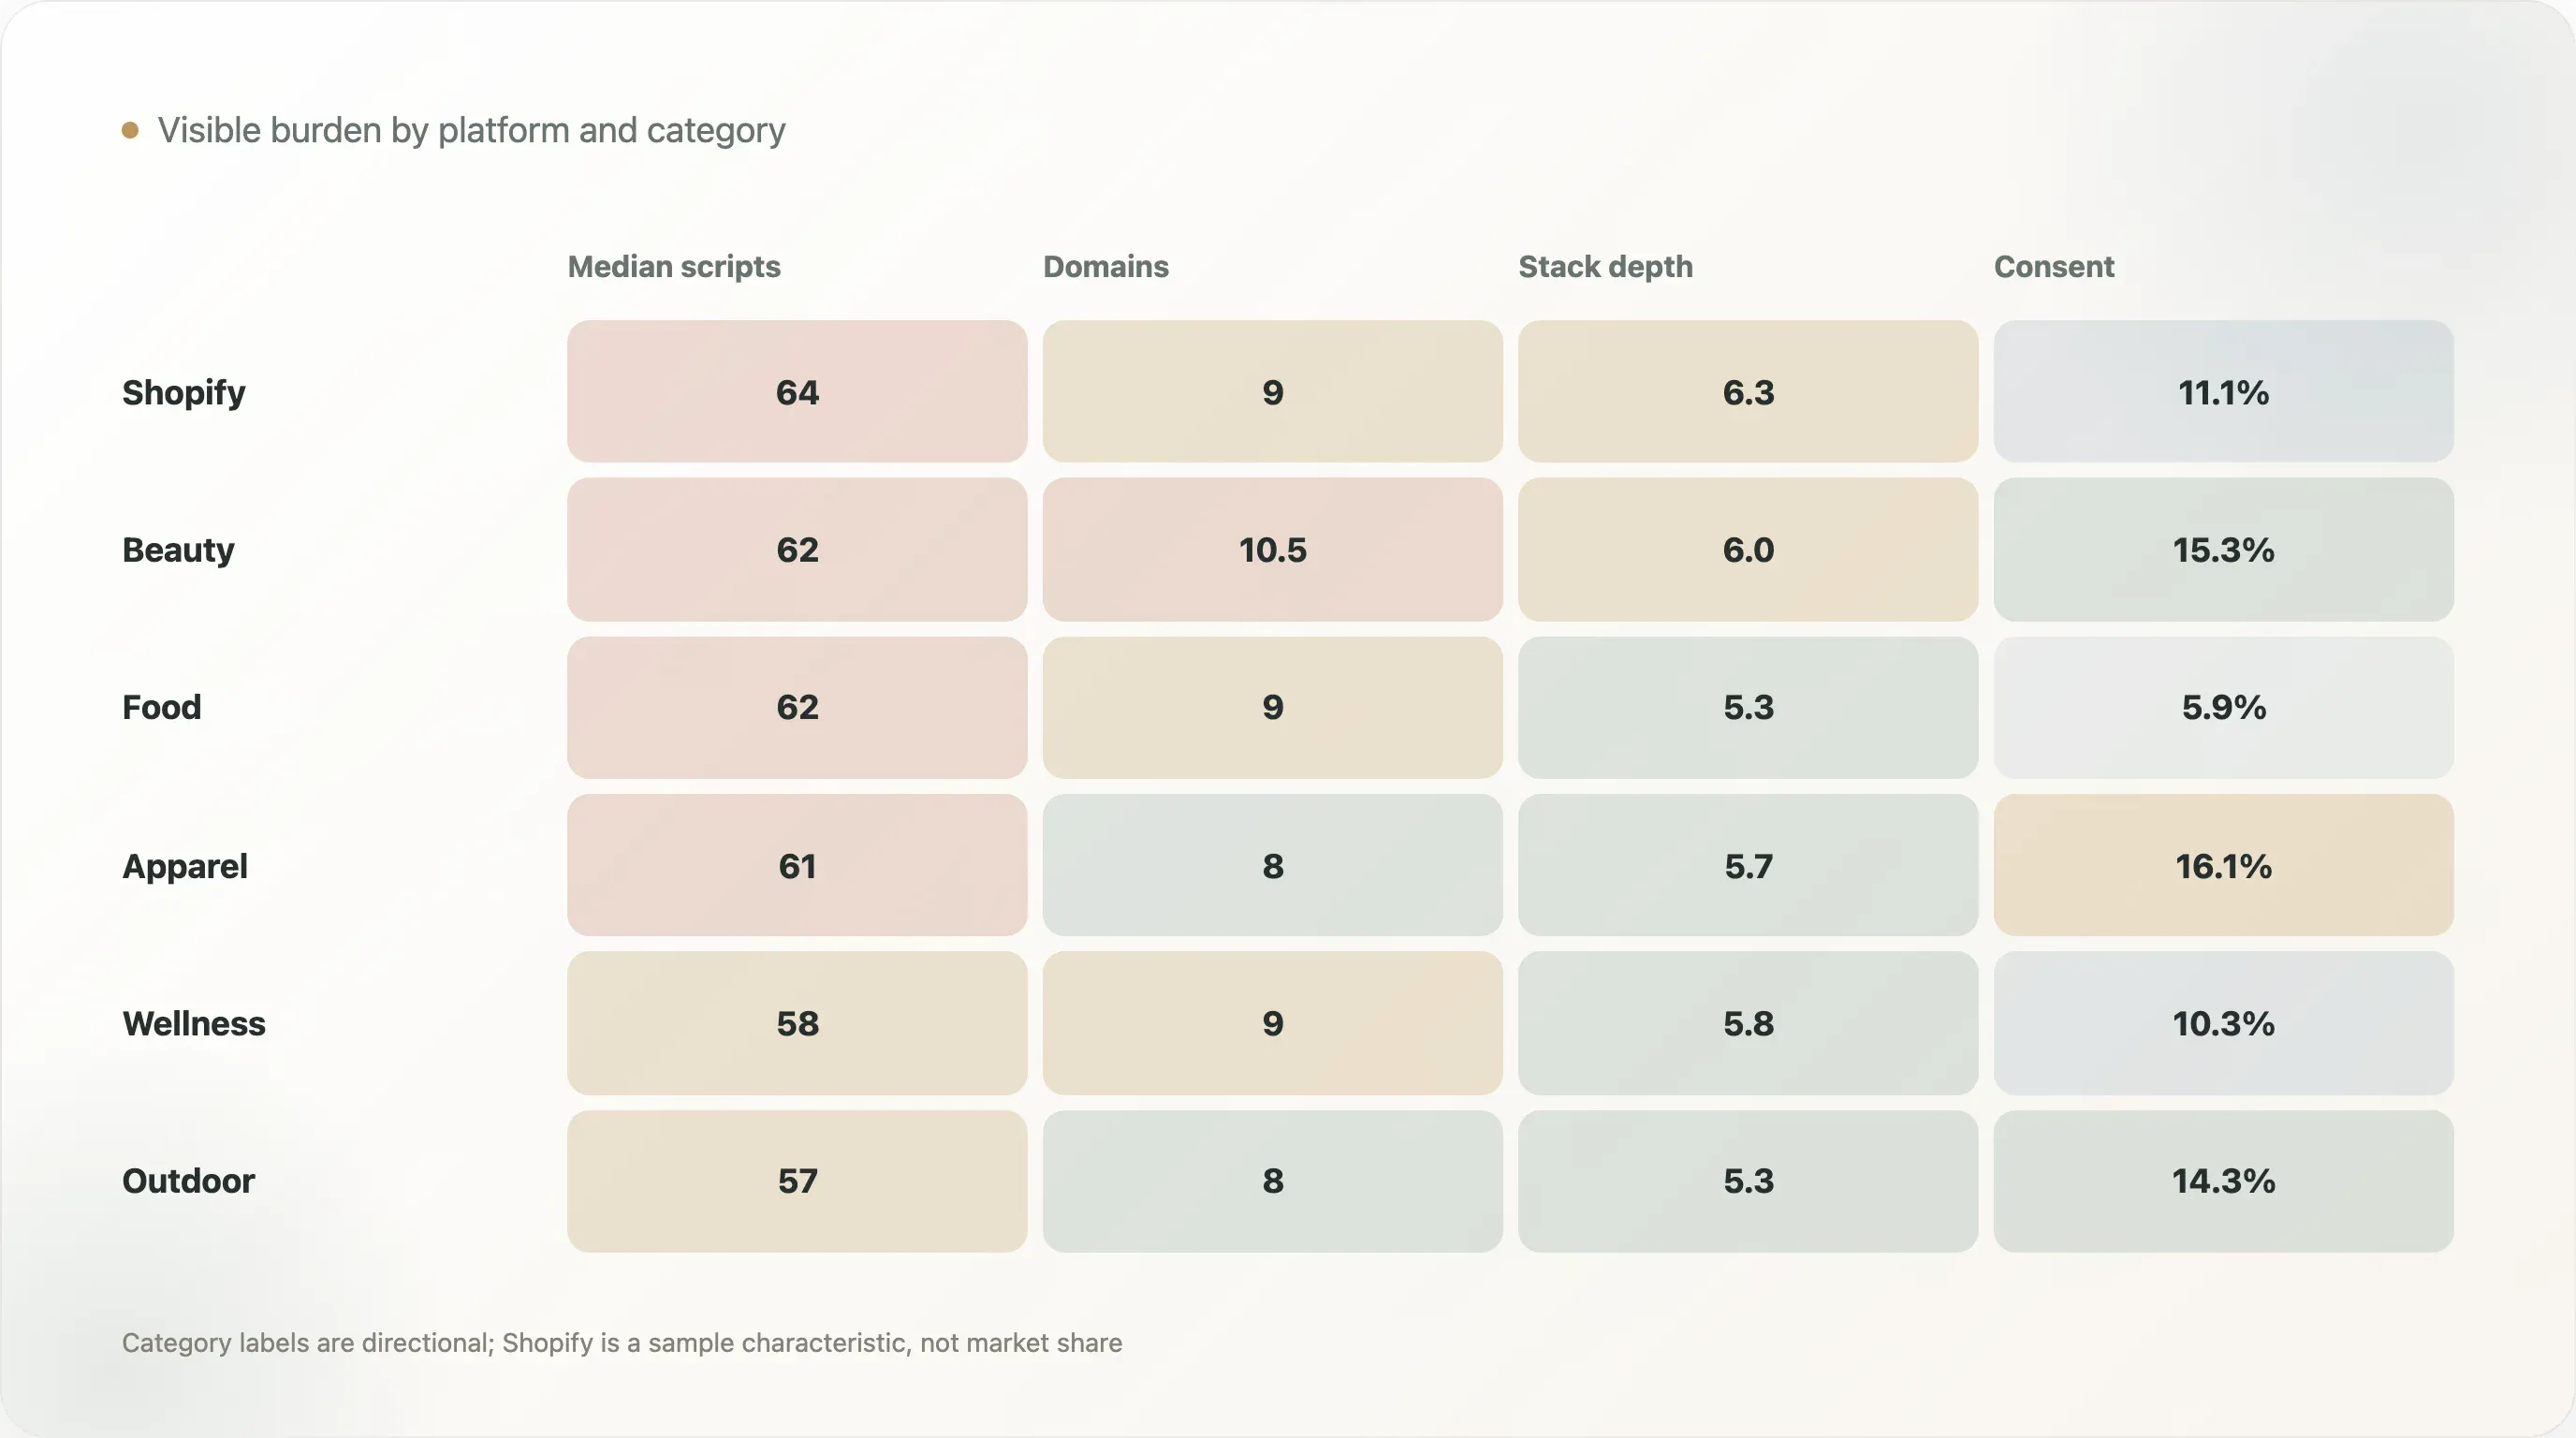
Shopify sites in the sample have a median of 64 scripts and 9 third-party domains, with an average stack depth of 6.3. This should not be read as "Shopify causes scripts." A more plausible interpretation is that Shopify brands in this sample are highly exposed to app ecosystems, checkout integrations, lifecycle tools, review tools, support tools, and growth vendors.
The Unknown group has a median of 6 scripts and 2 third-party domains, but that does not necessarily mean those sites are leaner in a strategic sense. Many unknown-platform sites may hide platform fingerprints, be headless, be under-detected, or expose less server-rendered markup. The correct reading is public visibility, not full internal stack.
The platform table is most useful for internal benchmarking. If a Shopify DTC site has 90 scripts, that is above the Shopify median in this sample. If it has 40, it is below. The point is not to shame high-script sites. The point is to create a benchmark for review.
6. Category Patterns: Beauty, Food, Apparel, and Wellness Carry Heavy Stacks
The category table shows that high-growth DTC categories tend to have high script burdens.
| Category | Sample | Median scripts | Median third-party domains | Avg stack depth | Consent manager coverage |
|---|---|---|---|---|---|
| Beauty & Skincare | 98 | 62 | 10.5 | 6.0 | 15.3% |
| Food & Beverage | 118 | 62 | 9 | 5.3 | 5.9% |
| Apparel & Footwear | 149 | 61 | 8 | 5.7 | 16.1% |
| Health & Wellness | 58 | 58 | 9 | 5.8 | 10.3% |
| Home & Furniture | 48 | 58.5 | 9 | 5.4 | 8.3% |
| Outdoor & Sports | 49 | 57 | 8 | 5.3 | 14.3% |
| Baby & Kids | 27 | 57 | 9 | 4.7 | 7.4% |
Beauty & Skincare, Food & Beverage, Apparel & Footwear, and Health & Wellness all have median script counts near or above the overall median. These categories are competitive, content-heavy, and often lifecycle-driven. They rely on education, reviews, paid acquisition, creator discovery, subscriptions, loyalty, quizzes, and personalization. That creates a natural pull toward more tools.
Food & Beverage is interesting because it has a high median script count but relatively low consent-manager visibility at 5.9%. This does not prove a compliance gap, but it does create a governance question for brands with tracking-heavy food or beverage sites, especially if they operate internationally.
Apparel & Footwear has the highest consent-manager coverage among the major categories shown, at 16.1%. Beauty & Skincare is close at 15.3%. These categories may have more international exposure, more sophisticated paid-media operations, or more mature ecommerce stacks in the sample.
The category lesson is not that one category is "bad." The lesson is that performance governance should be category-aware. A beauty brand with reviews, quizzes, subscriptions, SMS capture, and attribution will naturally look different from a low-complexity catalog site. The benchmark should guide prioritization, not create one universal target.
7. Consent Management: The Gap Between Tracking and Governance
Consent management appears on 9.6% of scored domains overall. Among brands with 5+ analytics tools, it appears on 14.0%.
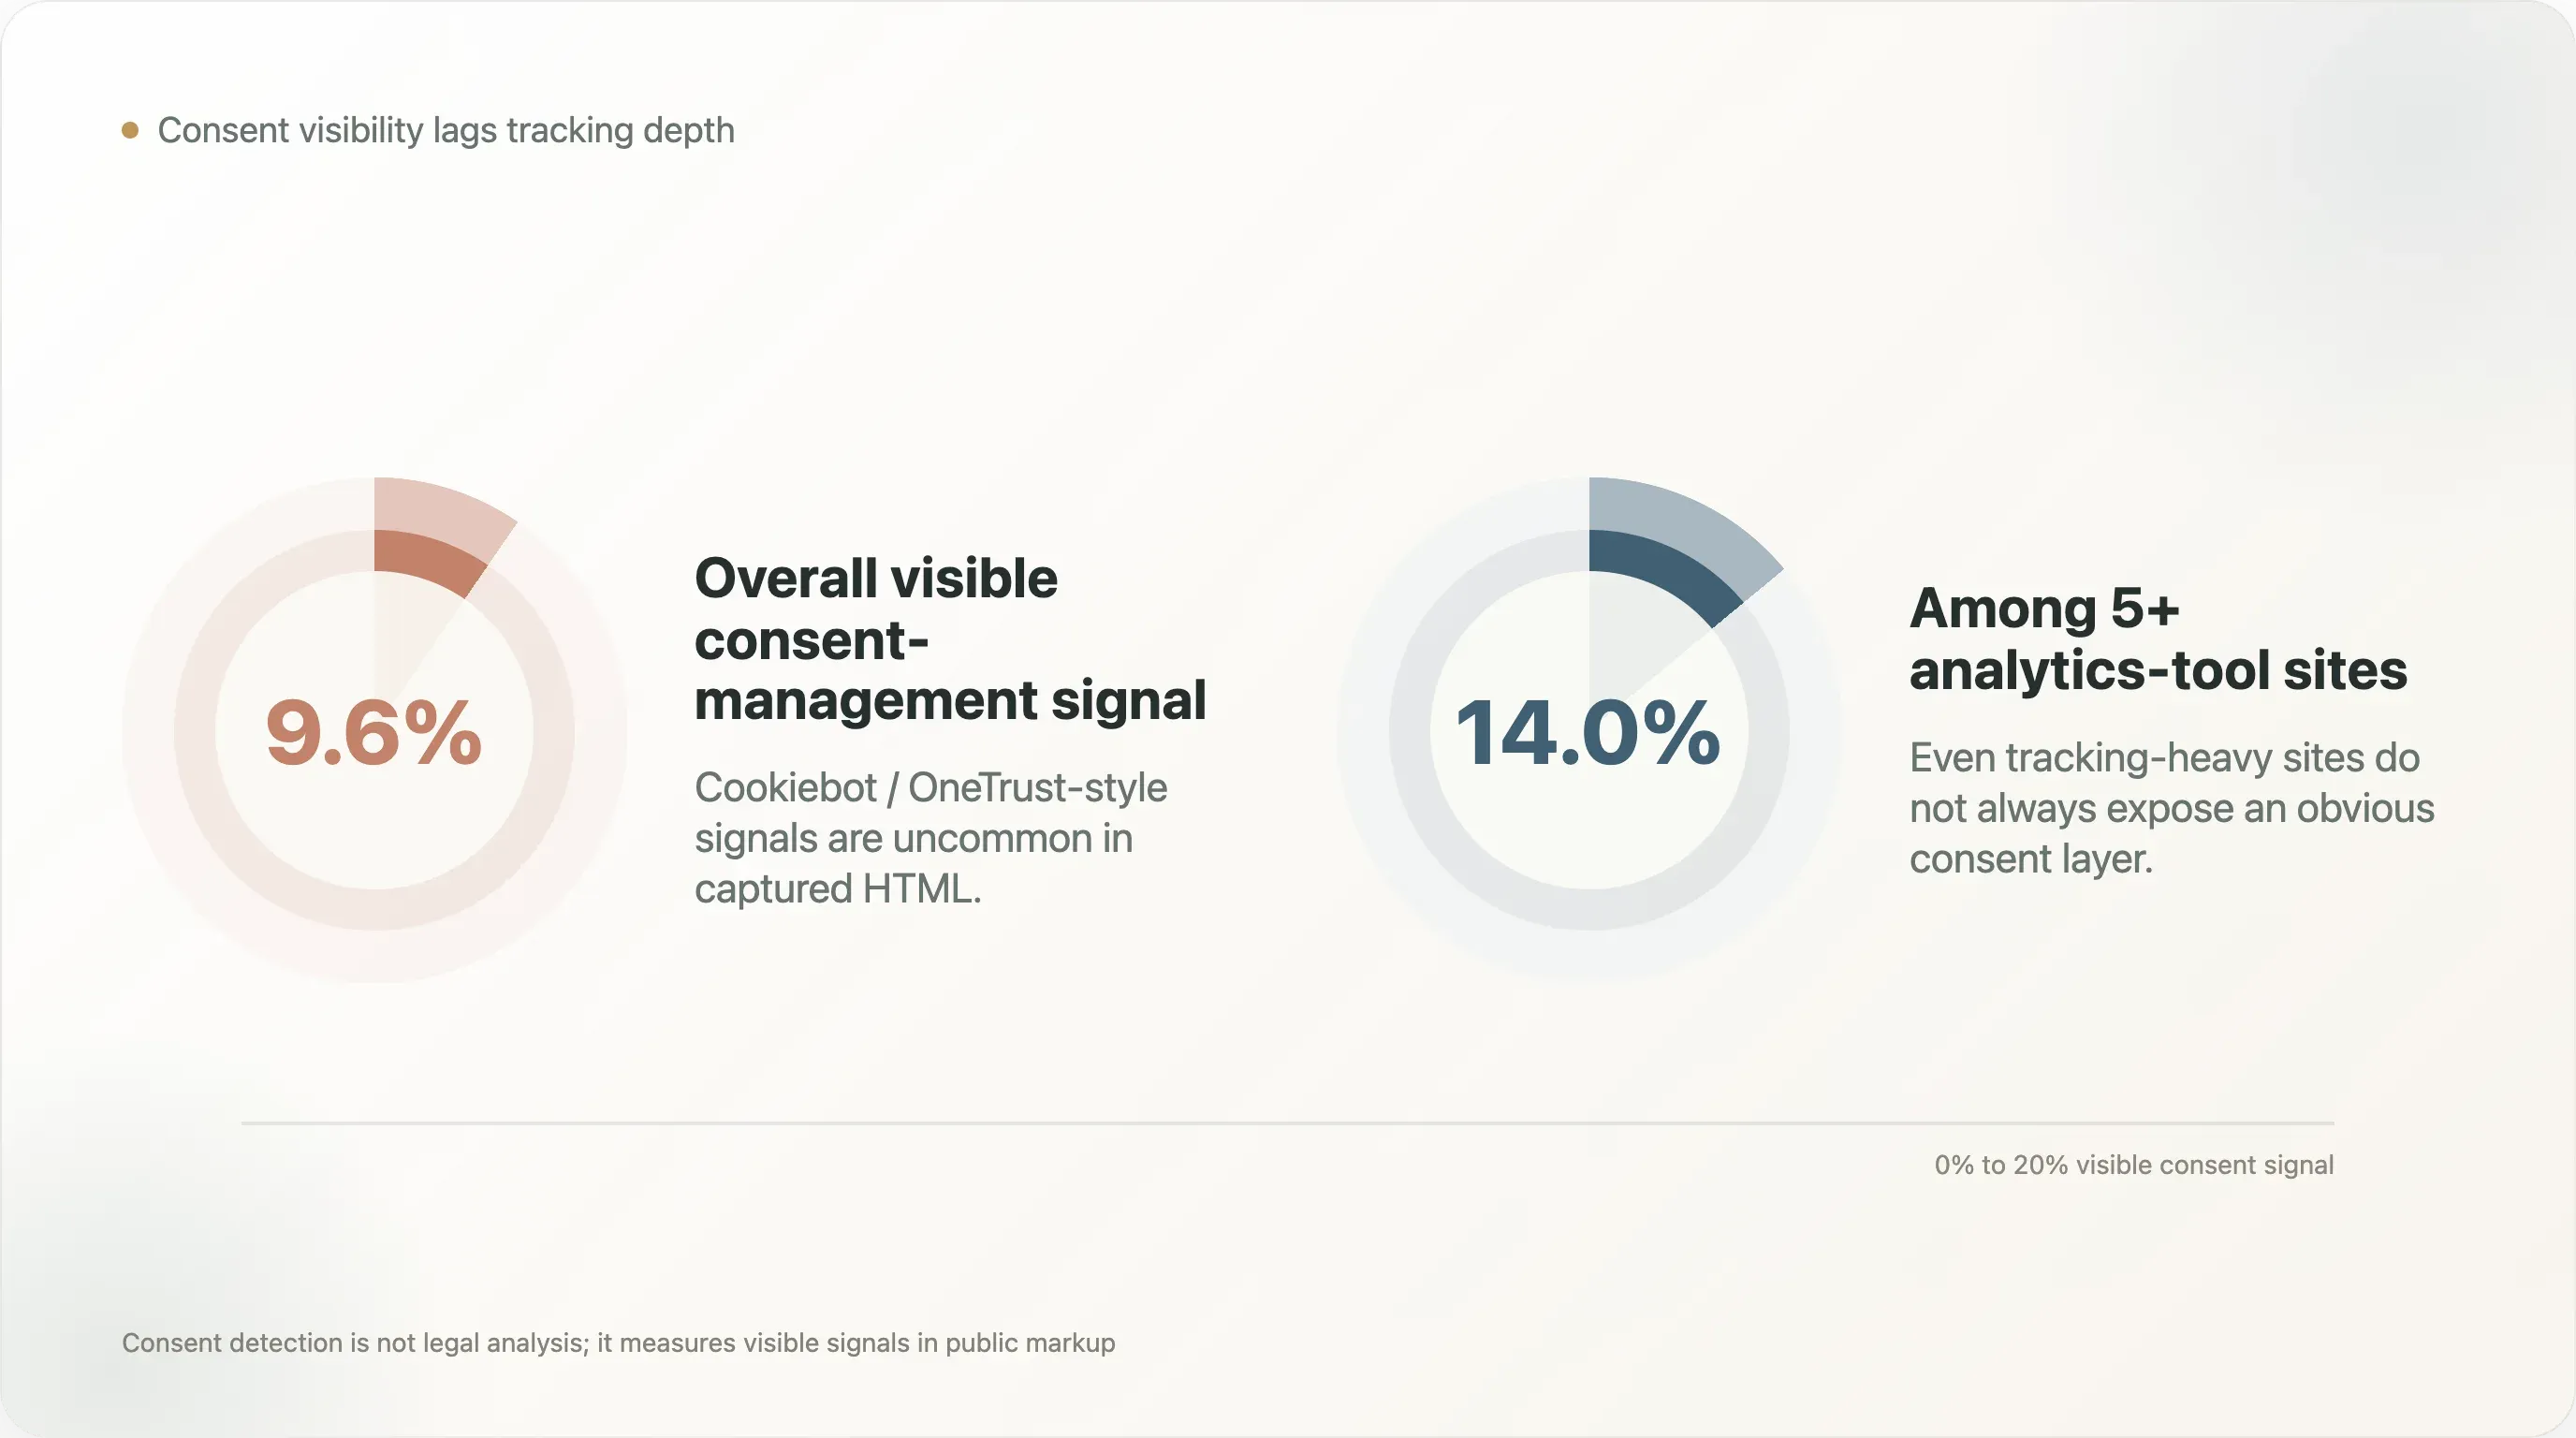
This is one of the most important findings because it connects growth instrumentation to privacy governance. The heavier the stack, the more important consent logic becomes. Yet visible Cookiebot / OneTrust-style signals remain relatively uncommon.
This metric has caveats. A brand may use a consent manager not covered by detection. It may implement consent through a custom solution. It may load consent scripts dynamically. It may operate primarily in markets with different compliance expectations. So the number should not be cited as "only 9.6% comply with privacy law." That would be too strong and likely wrong.
The correct citation is narrower: only 9.6% of scored domains expose a Cookiebot / OneTrust-style consent-management signal in captured HTML. That is still useful. It suggests that many tracking-heavy stores do not make consent governance obvious in the public crawl.
For operators, the action is simple: do not wait for a legal audit to inventory tracking. Build a tag map that includes purpose, owner, vendor, data collected, consent category, and loading condition. Growth teams should know which tags fire before consent, after consent, and on which pages.
8. The Extreme Script Tier: When a Marketing Page Becomes Infrastructure
This research defines the extreme script-burden tier as more than 75 script tags. Under that definition, 16.2% of scored domains fall into the extreme tier.
Extreme does not automatically mean wrong. Some brands have complex needs: multi-region routing, heavy review infrastructure, rich product education, personalization, multiple ad networks, analytics, support, experimentation, and checkout integrations. A complex brand may reasonably require a complex page.
But extreme should trigger governance. Above 75 scripts, a homepage is no longer a simple marketing asset. It is infrastructure. It needs:
- A script owner list
- A tag loading policy
- Consent category mapping
- Performance monitoring
- Regular vendor cleanup
- QA paths for cart and checkout
- Event deduplication rules
- A rollback plan for broken vendors
The most dangerous script is not the heaviest one. It is the orphaned one: a vendor snippet no current team member owns, feeding a dashboard no one opens, slowing a page no one audits.
9. The Operator Playbook: How to Govern the Growth Stack
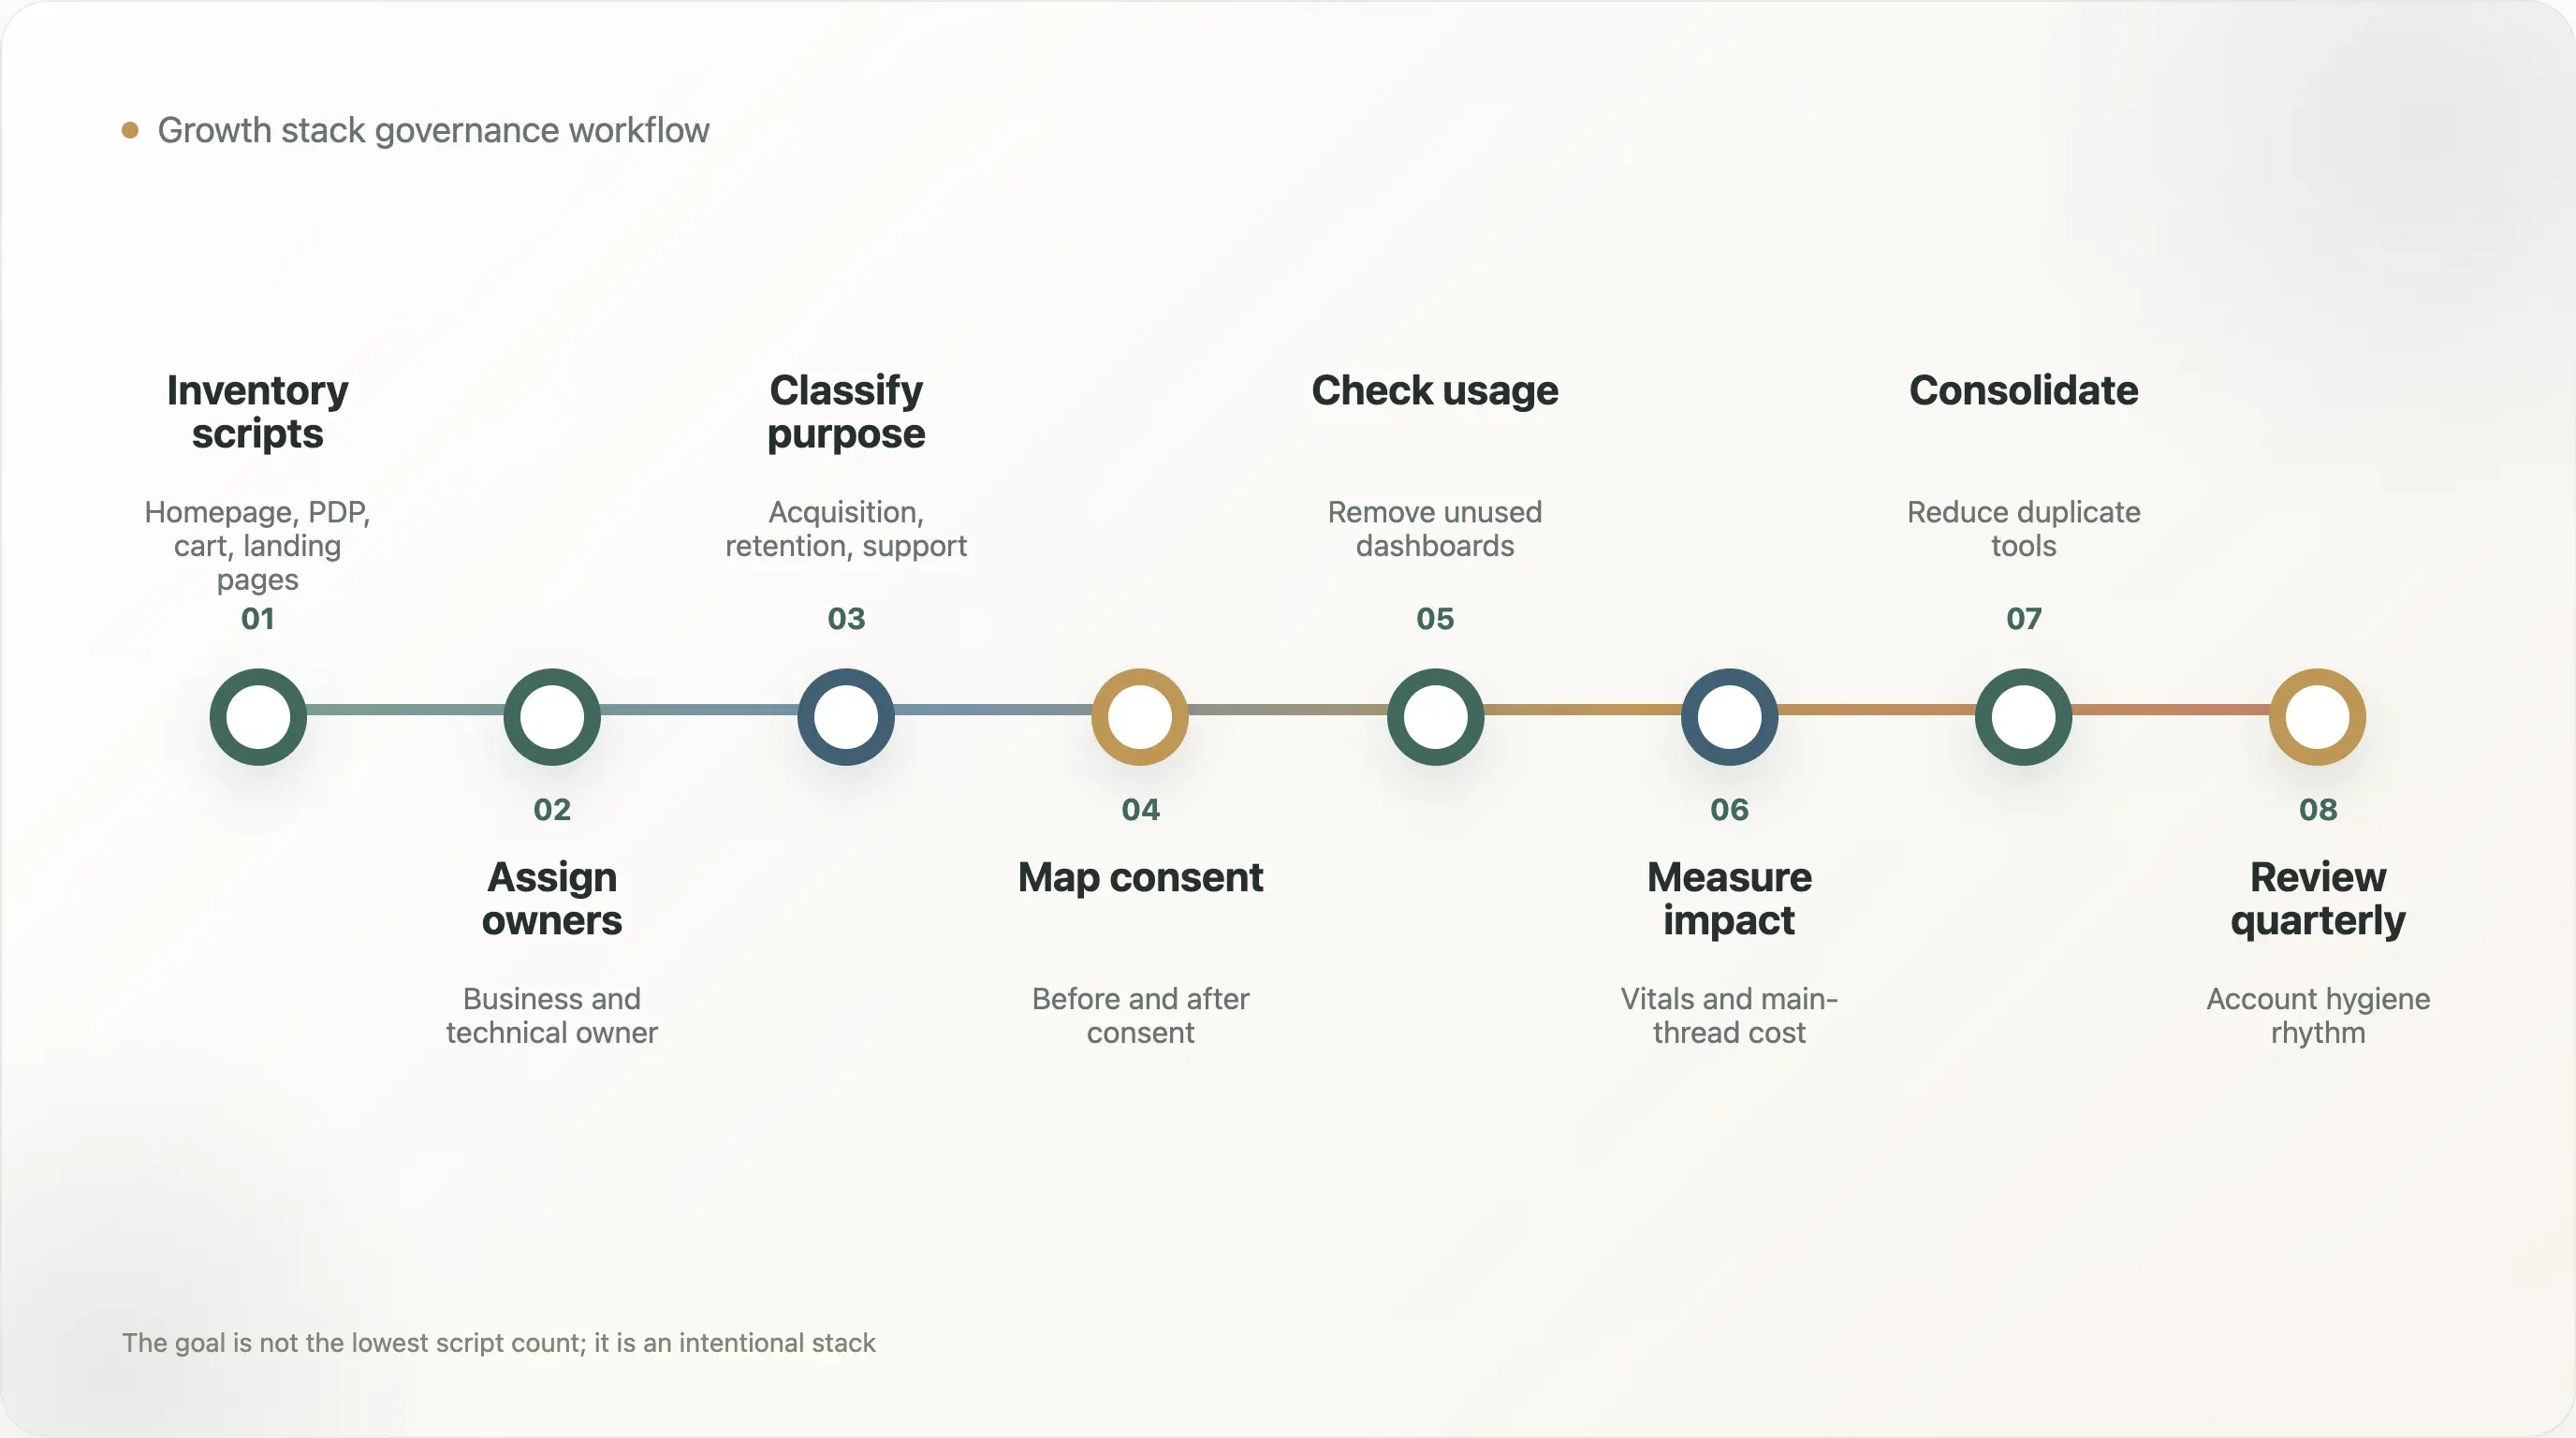
The practical response to this report is not a tool purge. It is a governance workflow.
Step 1: Inventory every script. Export all script sources from the homepage, product page, collection page, cart, and checkout-adjacent pages. Include inline scripts where possible.
Step 2: Assign ownership. Every script needs a business owner and a technical owner. If no one can name the owner, the script is a removal candidate.
Step 3: Classify purpose. Acquisition, retention, attribution, reviews, customer support, payments, personalization, experimentation, consent, analytics, monitoring, or legacy.
Step 4: Map consent behavior. Decide whether each script is essential, analytics, marketing, personalization, or support. Confirm when it fires.
Step 5: Check actual usage. Is the dashboard active? Is the vendor still contracted? Are reports reviewed? Does the tool feed decisions?
Step 6: Measure impact. Test page performance with and without heavy vendors where possible. Track Core Web Vitals, interaction delay, and main-thread blocking.
Step 7: Consolidate. If two tools serve the same function, choose one. Duplicate attribution and analytics tools often create more argument than clarity.
Step 8: Review quarterly. The growth stack should have a cleanup cycle, just like ad accounts and email flows.
This workflow turns performance from an engineering complaint into an operating discipline.
10. What SEO and Content Teams Can Cite
This research creates several strong content angles:
"The median DTC homepage has 52 scripts." This is the broadest performance hook.
"The heavier the analytics stack, the heavier the page." Brands with 5+ analytics tools have 69 median scripts, versus 16 for brands with 0-2 analytics tools.
"Growth maturity creates performance debt." The brands most committed to measurement and lifecycle infrastructure carry more front-end dependencies.
"Consent visibility lags tracking depth." Even among 5+ analytics-tool sites, visible consent-manager coverage is only 14.0%.
"DTC performance is no longer just a developer issue." Marketing, lifecycle, paid media, support, and analytics all place code on the page.
The caveat matters: do not present script count as proof of poor performance. Use it as a proxy for dependency burden and governance need.
11. How Different Teams Should Read This Report
The hidden cost of the growth stack is cross-functional. That is why it is hard to solve. Each team sees a different part of the problem.
Growth teams see the revenue upside. They want better attribution, more precise audiences, stronger retargeting, clearer campaign feedback, better landing-page testing, and more lifecycle capture. From their view, a new script is often a small price to pay for more measurable revenue.
Frontend teams see the dependency cost. They deal with slower pages, layout shifts, browser errors, third-party outages, blocked main threads, hydration problems, and QA failures caused by scripts they may not own. From their view, marketing tags often behave like unmanaged production dependencies.
SEO teams see the ranking and crawl cost. They care about Core Web Vitals, renderability, structured data, crawl efficiency, and user experience. If a site becomes slower or more fragile, SEO performance can suffer even when the new vendor was added for paid growth or retention.
Data teams see the measurement cost. More tools can mean more event duplication, more disagreement between dashboards, more broken UTMs, more channel-credit arguments, and more uncertainty about which numbers should guide decisions.
Legal and privacy teams see the consent cost. More tracking means more vendor review, data-processing questions, consent categories, regional behavior, and risk management.
Executives see the budget and accountability cost. Each tool has a subscription fee, but the larger cost may be the time spent reconciling data, maintaining integrations, and fixing site issues.
The report's most important management lesson is that no single team owns the whole problem by default. The growth stack needs a shared operating model. A practical version is a quarterly "stack council" with growth, lifecycle, ecommerce, SEO, engineering, analytics, and privacy represented. The agenda should be simple: what was added, what was removed, what is still used, what is slowing the site, what is legally sensitive, and what is creating measurable value?
This sounds bureaucratic, but the alternative is worse: years of vendor snippets installed by different teams, with no shared map and no cleanup cycle.
12. The Stack Review Template
A DTC team can turn this research into a quarterly review using a simple table. Each row is one tool or script.
Vendor or script name. What is it?
Business owner. Who asked for it and who still uses it?
Technical owner. Who can safely remove or modify it?
Purpose. Acquisition, retention, attribution, support, reviews, personalization, payments, experimentation, consent, monitoring, or legacy.
Pages loaded. Homepage, product pages, collection pages, cart, checkout, blog, landing pages, or global.
Consent category. Essential, analytics, marketing, personalization, support, or unknown.
Last reviewed. When did the team last confirm that the tool is still useful?
Decision evidence. What metric or workflow depends on it?
Performance impact. Does it materially affect scripts, third-party requests, main-thread work, or Core Web Vitals?
Keep, delay, consolidate, or remove. What is the decision?
This template does not require a sophisticated engineering platform. It can start as a spreadsheet. The important part is not the format; it is the accountability. Once a tool has an owner and a purpose, the team can make rational tradeoffs. Without that map, every performance discussion becomes political.
The best outcome is not the lowest script count. The best outcome is an intentional stack: fewer abandoned vendors, cleaner consent behavior, fewer duplicate tags, more reliable analytics, and better performance for the tools that truly matter.
13. The Minimum Viable Governance Standard
For teams that cannot run a full quarterly stack council immediately, there is a lighter version. Start with three rules.
First, no new vendor script should be added without an owner, a purpose, and a removal condition. The removal condition matters because many scripts are installed for a campaign, test, migration, or temporary launch and then quietly become permanent.
Second, every analytics or marketing tag should have a consent category before it goes live. This does not require legal perfection from the marketing team, but it does require a documented routing path for privacy review.
Third, the team should maintain one source of truth for active storefront vendors. If the only way to know what runs on the site is to inspect the page source during an incident, the stack is already unmanaged.
These three rules will not solve every performance problem. They will, however, prevent the most common failure mode: a growth stack that keeps expanding without memory.
Methodology
This research uses the DTC dual-report dataset collected on May 11, 2026. It scored 1,238 domains using master.csv, perf_metrics.csv, and categories.csv.
The analysis groups domains by analytics depth, platform, category, script burden, third-party domain burden, and stack composition. Script count and third-party domain count are used as public proxies for front-end dependency burden.
Tool categories include tracking, observability, retention, customer experience, payment, and consent-management signals. Correlations are calculated across numeric stack and burden fields.
Caveats
-
Script count is a proxy, not a full performance score. It does not measure actual Core Web Vitals, main-thread blocking, network timing, or user experience directly.
-
High script count is not automatically bad. A complex brand may need complex infrastructure. The issue is unmanaged complexity.
-
Tool detection is a lower bound. Some scripts load dynamically, after consent, through tag managers, or through client-side rendering.
-
Consent-manager detection is not legal analysis. The 9.6% figure reflects visible Cookiebot / OneTrust-style signals in captured HTML, not total compliance.
-
The sample is not a full DTC census. It is biased toward brands visible in ecommerce tool ecosystems and public DTC lists.
-
Category labels are directional. They are useful for pattern analysis but not exact taxonomy.
Reproducibility Notes
The delivery folder includes:
analyze_growth_stack_cost.py— analysis script used to score storefront stack burden, analytics depth, script count, third-party-domain count, consent-manager visibility, and related governance signals.growth_stack_cost_scores.csv— domain-level growth-stack cost scores and burden metrics.by_analytics_depth.csv— script and third-party-domain burden grouped by analytics-tool depth.by_platform_stack_cost.csv— platform-level stack burden comparison.by_category_stack_cost.csv— category-level stack burden comparison.stack_cost_correlations.csv— numeric correlation matrix across stack and burden fields.highest_script_burden_domains.csv— highest script-burden domains for editorial review and manual validation.summary.json— headline aggregate metrics quoted in this report, including median script count, median third-party-domain count, analytics-depth comparisons, consent-manager visibility, and extreme script-burden share.
Methodology corrections, dataset issues, and follow-up analyses welcome at support@thunderbit.com. This report is published independent of any commercial position Thunderbit holds; we build an AI-powered web scraper, and we have a structural interest in public ecommerce websites remaining inspectable enough for operators, researchers, search engines, and AI agents to understand what runs on them. The benchmark is based on 1,238 scored DTC domains from public website signals collected on May 11, 2026. The data in this report stands on its own. — The Thunderbit research team, May 2026.