It’s 2026, and the world of ecommerce is moving so fast it’s starting to feel like the Olympics—except the relay baton is a smartphone, and the finish line is wherever your next customer happens to be. I’ve spent years in SaaS and automation, and I still get a thrill watching the numbers climb: more shoppers, more countries, more cross-border deals than ever before. If you’re in sales, ops, or strategy, keeping up with global ecommerce statistics isn’t just a nice-to-have—it’s your secret weapon.
So, what’s driving this cross-border boom? Why are international ecommerce trends suddenly everyone’s business? And how can you use global online shopping data to make smarter moves? Let’s dive into the latest numbers, unpack what they mean, and see how tools like Thunderbit are helping teams turn all this data into real-world wins.
Try Thunderbit for Ecommerce Research
Top Global Ecommerce Statistics at a Glance (2026)
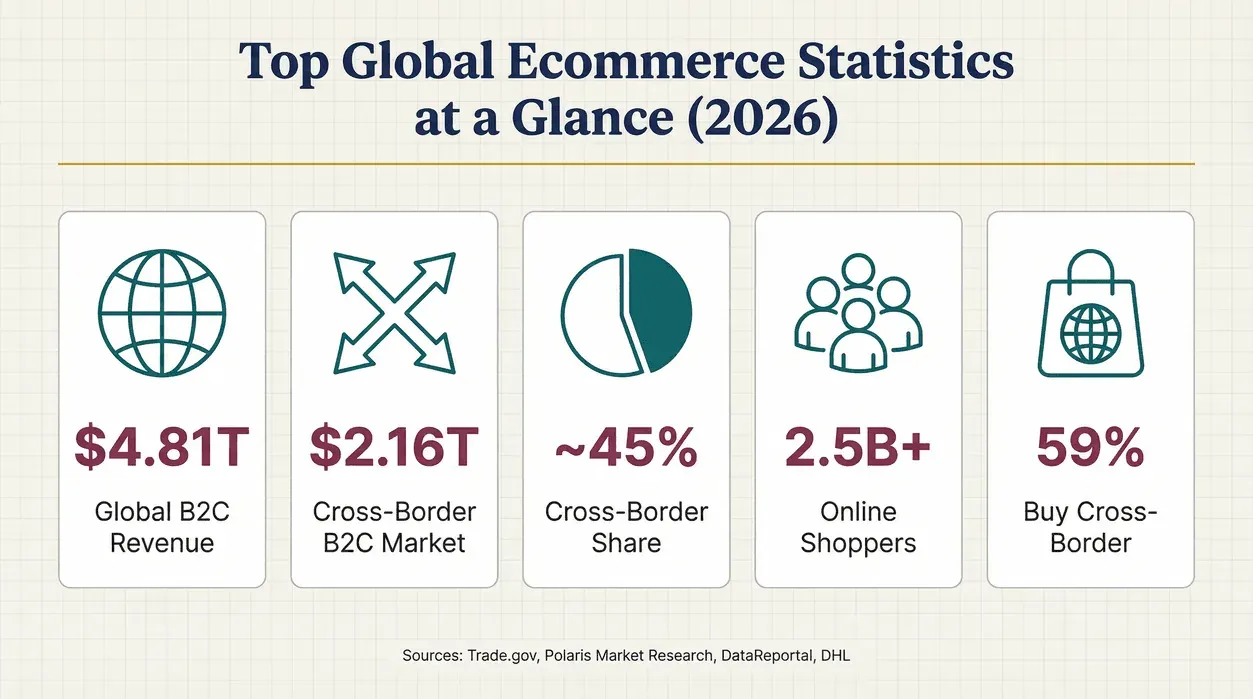
Before we get into the nitty-gritty, here’s your “cheat sheet” for the most important global and cross-border ecommerce statistics for 2026. These are the numbers everyone in the industry is talking about—and citing in boardrooms and strategy decks.
| Statistic | 2026 Value | Source |
|---|---|---|
| Global cross-border B2C ecommerce market | US$1.72 trillion (2025 actual) → ~US$2.16 trillion (2026, extrapolated at 25.5% CAGR) | Polaris Market Research |
| Global B2C ecommerce revenue (forecast) | US$5.5 trillion by 2027 (14.4% CAGR) | Trade.gov |
| Cross-border share of B2C ecommerce (implied) | ~45% (cross-border ≈ US$2.16T vs total B2C ≈ US$4.81T) | derived from Polaris and Trade.gov figures |
| Global B2B ecommerce market (forecast) | US$36 trillion | Trade.gov |
| People buying consumer goods online | >2.5 billion | DataReportal |
| Cross-border buying incidence | 59% buy cross-border; 35% do so monthly | DHL |
| Global internet users (Oct 2025) | 6.04 billion (73.2% penetration) | DataReportal |
| Europe cross-border ecommerce market | €358.7B (2024/2025); 70% via marketplaces | CBCommerce |
| EU low-value parcel imports (2024) | 4.6B parcels; 91% from China | Reuters |
| Mobile commerce share of retail ecommerce | High, with mobile-first regions (APAC, LATAM) crossing 65–70%; mature markets sit lower | eMarketer |
| Average delivery time (15+ days) | Down to 7% (from 29% in 2020) | IPC |
These headline stats tell a clear story: cross-border ecommerce is no longer a side show—it’s the main event.
Global Ecommerce Market Growth: 2026 Overview
The global ecommerce market in 2026 is, in a word, massive. And it’s still growing at a pace that would make even the most optimistic forecasters do a double take.
- Global B2C ecommerce revenue is projected to hit US$4.81 trillion in 2026, up from US$4.12T in 2024—a compound annual growth rate (CAGR) of about 14.4% (Trade.gov).
- B2B ecommerce is even bigger, with forecasts showing a market size of US$36 trillion by 2026 and a CAGR of 14.5% (Trade.gov). That’s a lot of digital handshakes.
- The number of people buying consumer goods online has surpassed 2.5 billion globally, growing by about 200 million in just the last year (DataReportal).
Regional Growth Patterns
- APAC (Asia-Pacific) continues to lead the pack, driven by China’s enormous ecommerce engine and rapid digital adoption in Southeast Asia and India.
- Europe is seeing strong cross-border growth, especially through marketplaces, while LATAM (Latin America) is the fastest-growing region in terms of new online shoppers.
- North America remains a powerhouse, but its growth rate is slower compared to emerging markets.
B2B vs. B2C: Who’s Growing Faster?
- B2B ecommerce is quietly outpacing B2C in sheer dollar volume, thanks to digitization of procurement and supply chains.
- B2C ecommerce is where most of the cross-border action is, especially in categories like electronics, fashion, and beauty.
Key takeaway: Whether you’re selling to businesses or consumers, the global ecommerce pie is getting bigger—and cross-border slices are growing the fastest.
Cross-Border Ecommerce Statistics: The Global Surge
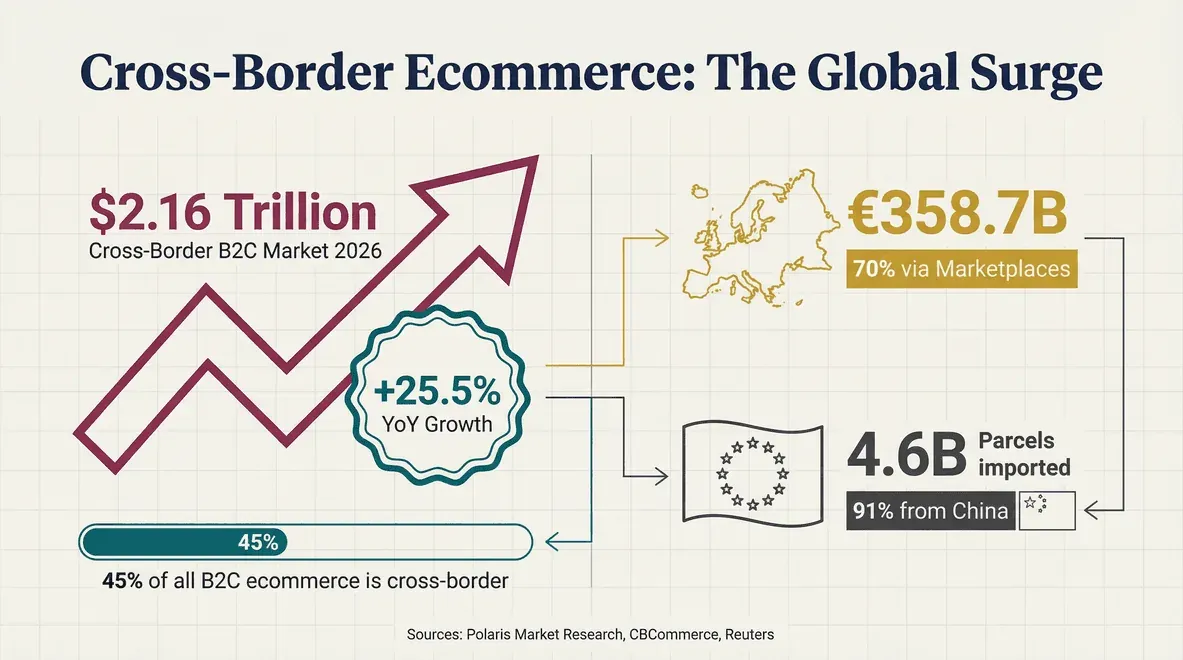
Let’s zoom in on cross-border ecommerce, where the action is really heating up.
- The global cross-border B2C ecommerce market is projected to reach an implied US$2.16 trillion in 2026, up from US$1.719T in 2025—a year-over-year growth rate of 25.5% (Polaris Market Research).
- Cross-border transactions now account for ~45% of global B2C ecommerce (Polaris Market Research; Trade.gov).
- In a recent global survey, 59% of online shoppers reported buying from retailers outside their home country, and 35% do so at least monthly (DHL).
Top Cross-Border Corridors & Markets
- Europe: Cross-border ecommerce market size is €358.7B (2024/2025), with 70% of that volume flowing through marketplaces (CBCommerce).
- China: Cross-border ecommerce exports reached 2.15 trillion RMB in 2024 (+16.9% YoY), with total cross-border trade volume at 2.71 trillion RMB (STD Daily).
- EU: In 2024, the EU imported 4.6B low-value parcels, with a staggering 91% coming from China (Reuters).
Company-Level Cross-Border Revenue
- Amazon: US$716.9B in consolidated net sales for FY2025 (+12% YoY), of which the International segment contributed US$161.9B — roughly 23% of the total (Amazon FY2025 10-K, filed February 2026). Third-party aggregators that include marketplace GMV alongside first-party sales report a larger "ecommerce ecosystem" figure (ECDB).
- Alibaba: US$1.1T total ecommerce revenue (2024), with 12% from outside China.
Bottom line: Cross-border ecommerce is no longer a niche—it’s a mainstream, high-growth engine for brands, platforms, and logistics providers worldwide.
Regional Leaders in International Ecommerce Trends
Let’s break down the global online shopping data by region and see who’s leading the charge in 2026.
Asia-Pacific (APAC)
- China remains the world’s largest ecommerce market, both domestically and cross-border.
- Southeast Asia and India are seeing explosive growth in mobile-first shopping and digital payments.
- Cross-border exports from China are surging, supported by government policy and logistics innovation (STD Daily).
Europe
- Europe’s cross-border ecommerce market is valued at €358.7B, with marketplaces like Amazon, Zalando, and AliExpress dominating (CBCommerce).
- 44% of European B2C ecommerce turnover is cross-border (EuroCommerce).
- The EU is tightening customs and tax rules to manage the flood of low-value imports (Reuters).
North America
- US and Canada remain ecommerce powerhouses, but their cross-border share is lower than Europe or APAC.
- US merchants face the highest fraud costs globally—$4.61 per $1 of fraud (LexisNexis).
Latin America (LATAM)
- LATAM is the fastest-growing region for new online shoppers, thanks to mobile adoption and improved digital payments.
- Cross-border shopping is rising, especially in Brazil and Mexico.
Middle East & Africa
- Digital adoption is expanding rapidly, with mobile commerce leading the way.
- Cross-border ecommerce is growing, but infrastructure and payment localization remain challenges.
Visualization tip: If you’re a data nerd like me, mapping these regions’ growth rates and market shares makes for a killer chart in any strategy presentation.
Changing Consumer Shopping Behaviors in 2026
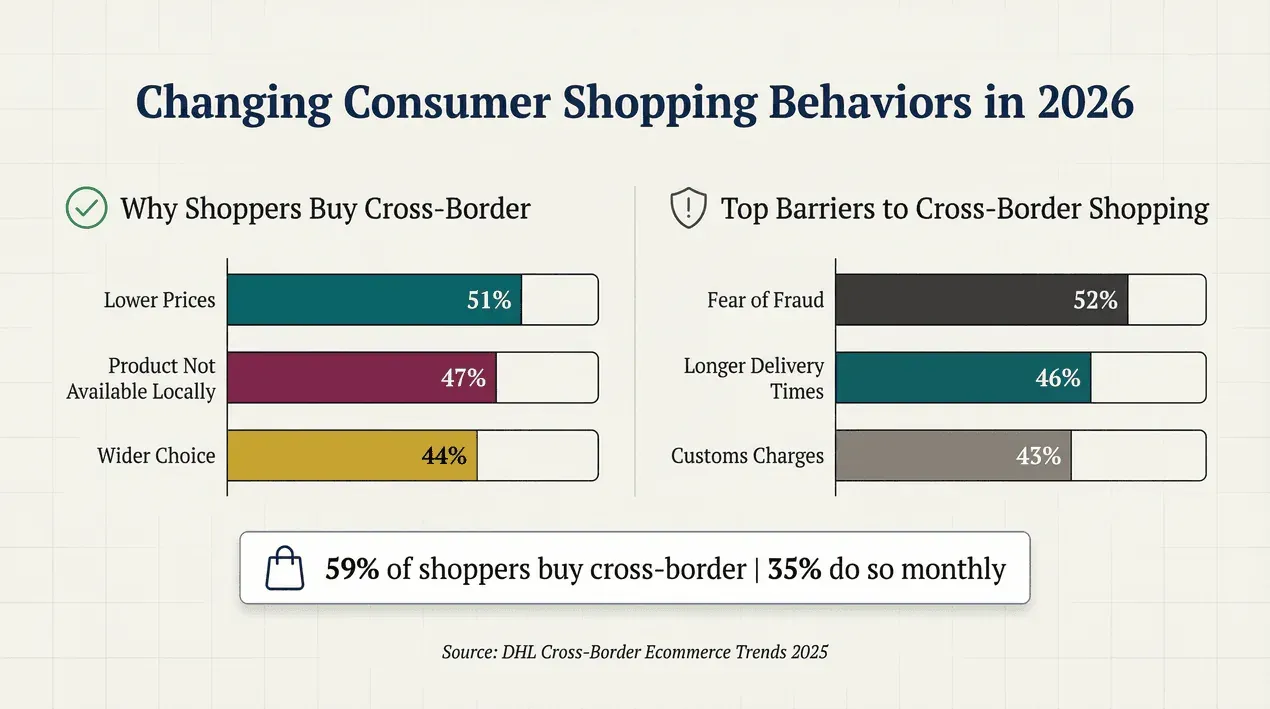
The way people shop online is changing fast—and cross-border ecommerce is right at the heart of it.
Why Do Shoppers Buy Cross-Border?
According to a global survey, the top reasons consumers buy from overseas retailers are:
- Lower prices: 51%
- Product/brand not available domestically: 47%
- Wider choice: 44%
(DHL)
But it’s not all smooth sailing. The top barriers to cross-border shopping are:
- Fear of fraud: 52%
- Longer delivery times: 46%
- Customs charges: 43%
- Return cost/process: 33–32%
Discovery Is Social and Marketplace-Led
- Marketplaces are now the starting point for about 30% of global online product searches (Trade.gov).
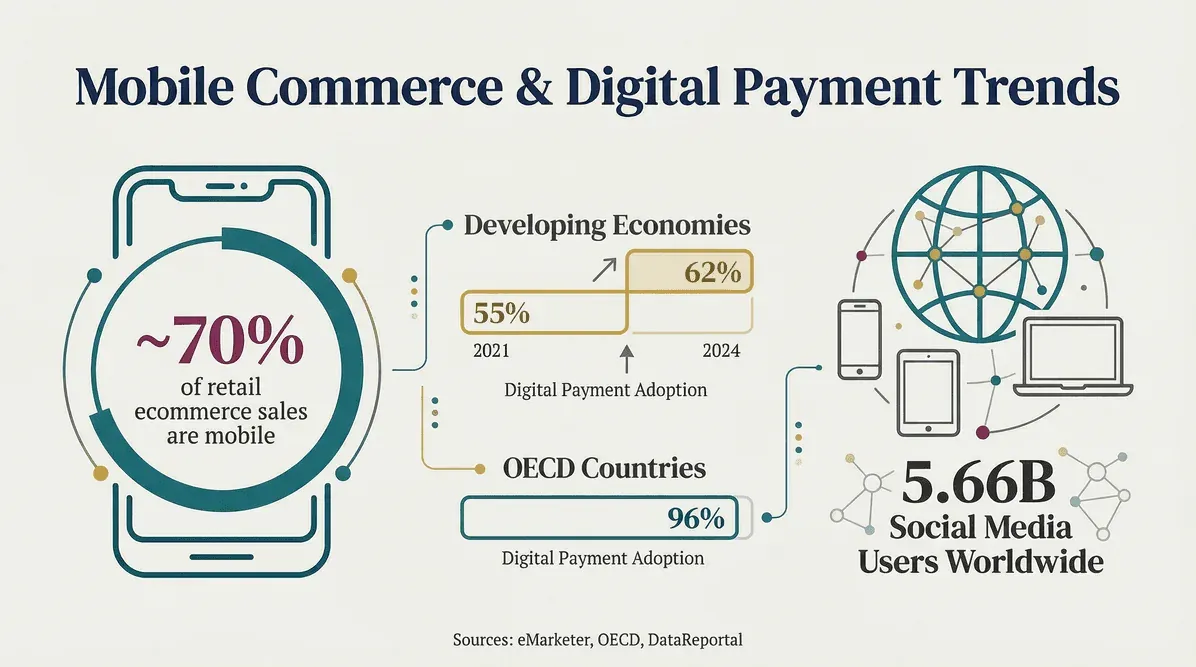
- Social media is a major driver of product discovery, especially in mobile-first markets. There are now 5.66B social media users worldwide (DataReportal).
Generational Differences
- Millennials and Gen Z are leading the charge in cross-border and mobile shopping, with higher comfort levels for digital payments and social commerce.
- Boomers are catching up, especially in developed markets, but tend to prefer established brands and marketplaces.
Cross-Border Purchase Frequency
- 59% of global online shoppers have made a cross-border purchase.
- 35% do so at least monthly (DHL).
Takeaway: Price, selection, and mobile convenience are driving cross-border growth—but trust, logistics, and transparency are the keys to conversion.
Mobile Commerce & Device Trends
If you’re not thinking mobile-first in 2026, you’re missing the boat (and probably a lot of customers).
- Mobile commerce (mcommerce) is approaching the majority share of global retail ecommerce sales, with mobile-first regions like APAC and LATAM already past two-thirds (eMarketer).
- In developing economies, the share of people making or receiving digital payments jumped from 55% to 62% between 2021 and 2024 (OECD).
- In OECD countries, digital payment usage is at 96%.
- Buy Now, Pay Later (BNPL) is especially popular among cross-border shoppers—55% use it for all or most online purchases (DHL).
- Klarna alone reports 118 million global active users and 3.4 million transactions per day (Klarna Investors).
Regional differences: Mobile commerce is especially dominant in APAC and LATAM, while desktop still holds some ground in parts of Europe and North America.
Pro tip: If your checkout isn’t mobile-optimized and doesn’t support local payment methods, you’re leaving money on the table—especially with international shoppers.
Cross-Border Ecommerce Logistics: Challenges & Opportunities
Let’s talk about the not-so-glamorous side of cross-border ecommerce: logistics. It’s where the rubber meets the road (or, more accurately, where the package meets the customs officer).
The Challenges
- Shipping costs and delivery speed are the top operational headaches for cross-border sellers.
- Customs and returns add complexity and cost, especially as regulations tighten.
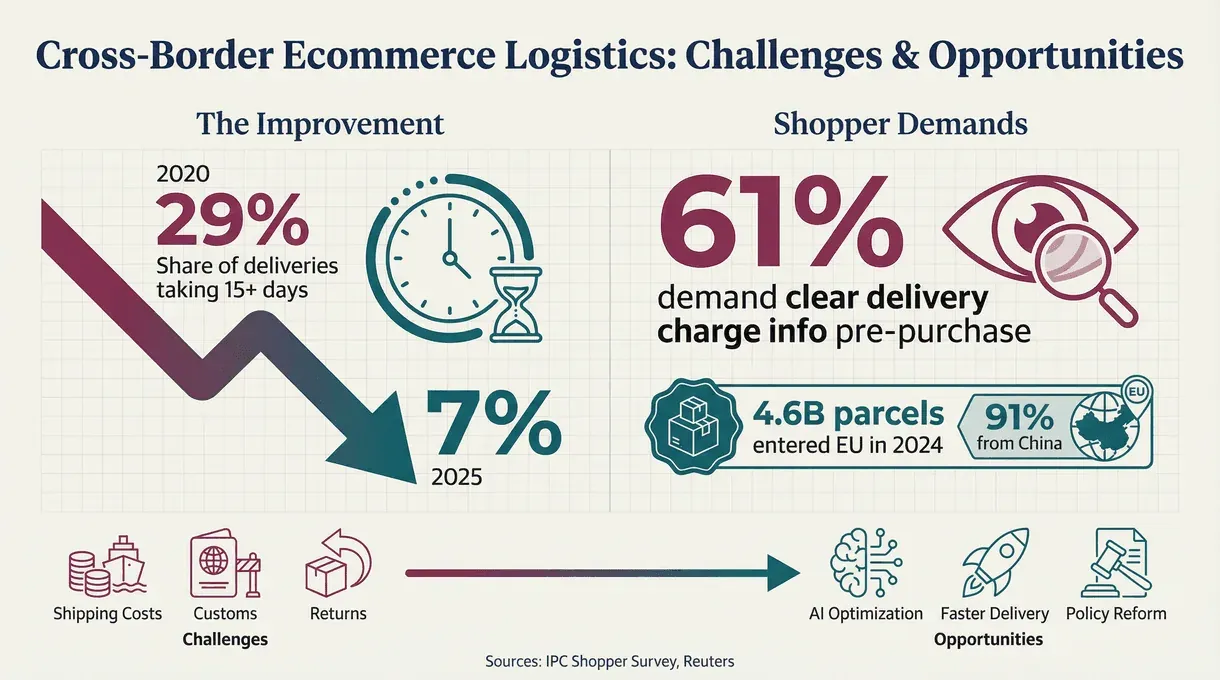
- Transparency is now table stakes: 61% of shoppers say clear pre-purchase info on delivery charges is essential (IPC).
But it’s not all doom and gloom.
The Opportunities
- Delivery times are improving: In IPC's 2025 Cross-Border E-Commerce Shopper Survey (30,970 respondents across 37 countries, conducted September 2025), the share of cross-border deliveries taking 15+ days dropped from 29% in 2020 to just 7% in 2025 (IPC).
- Technology is making a difference: AI and automation are helping brands optimize shipping routes, predict demand spikes, and manage returns more efficiently.
Real-World Example
- In Europe, 4.6B low-value parcels entered the EU in 2024 — roughly twice the 2.3B in 2023 and triple the 1.4B in 2022 — with 91% from China. That growth curve is what prompted the EU to scrap the €150 de minimis exemption starting in 2026 (Reuters).
- In China, new policies allow returned cross-border goods to be processed at any customs port, making returns less of a nightmare for sellers (English.gov.cn).
Bottom line: Logistics is both the biggest challenge and the biggest opportunity in cross-border ecommerce. The brands that get it right are the ones winning market share.
Technology Innovations in Cross-Border Logistics
This is where my inner tech geek gets excited. AI, predictive analytics, and automation are transforming cross-border logistics from a headache into a competitive advantage.
How AI Is Changing the Game
- AI-powered route optimization: Predicts the fastest, cheapest shipping paths based on real-time data.
- Automated customs documentation: Reduces errors and speeds up border crossings.
- Returns management: AI analyzes return patterns to help brands minimize costs and improve customer experience.
Thunderbit’s Role in Logistics Data Analysis
Scrape logistics and shipping data with AI Get Started Free
At Thunderbit, we’re helping ecommerce teams extract and analyze logistics data from anywhere on the web—think competitor shipping policies, average delivery times, or even customs requirements.
- AI Suggest Fields: Instantly identifies and extracts logistics-related data from any website.
- Subpage Scraping: Gathers detailed info from product, shipping, or policy pages.
- Export to Excel, Google Sheets, Notion, or Airtable: Makes it easy to benchmark against competitors or track your own KPIs.
Real-world use case: An ecommerce ops team used Thunderbit to scrape delivery time and shipping cost data from 50 competitor sites, then used that data to renegotiate rates with their logistics partners—saving tens of thousands of dollars per quarter.
Thunderbit in Action: Data-Driven Cross-Border Retail Market Analysis
I’ll admit, I’m biased—but I genuinely believe Thunderbit is changing how ecommerce teams approach market analysis and decision-making.
How Thunderbit Helps Ecommerce Teams
- Market Research: Scrape product listings, prices, and reviews from global marketplaces to spot trends and gaps.
- Competitor Analysis: Track how competitors are pricing, promoting, and shipping their products across borders.
- Pricing Intelligence: Monitor real-time pricing changes in different regions to optimize your own strategy.
- Regulatory Monitoring: Extract the latest policy updates, customs rules, and tax changes from official sources.
Thunderbit Features for Cross-Border Ecommerce
- AI-powered web scraping: No code needed—just describe what you want, and Thunderbit does the rest.
- Subpage and pagination scraping: Perfect for extracting data from multi-page product catalogs or nested policy pages.
- Instant templates: For popular sites, use pre-built templates to get data in one click.
- Free data export: Send your data straight to Excel, Google Sheets, Notion, or Airtable.
User testimonial:
“We used Thunderbit to track cross-border shipping policies for 20 competitors in Europe and Asia. What used to take our team a week now takes less than an hour—and the data is more accurate.” — Ecommerce Operations Manager, US-based DTC brand
Want to see it in action? Download the Thunderbit Chrome Extension and try scraping a competitor’s shipping page or marketplace listing. It’s almost as satisfying as finding free Wi-Fi at the airport.
Global Ecommerce Policy & Regulatory Trends in 2026
If you think policy is boring, try ignoring it in cross-border ecommerce—your margins will disappear faster than a flash sale.
Key Policy Changes Affecting Cross-Border Ecommerce
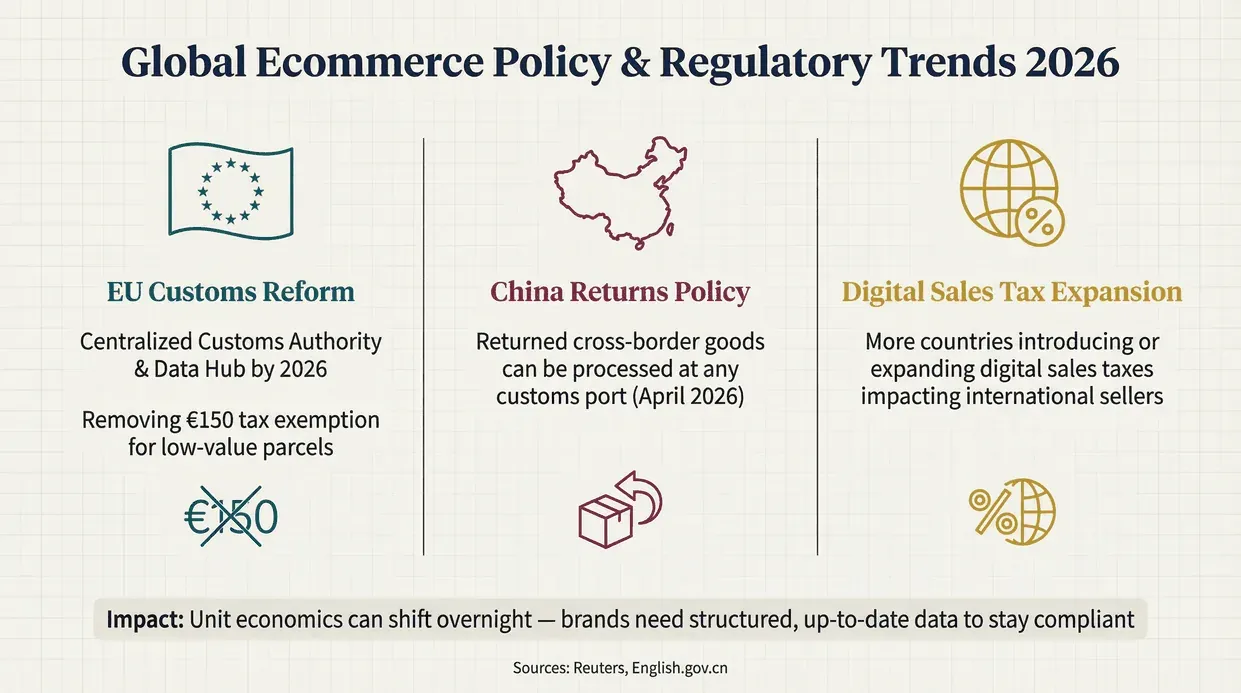
- EU Customs Reform: The EU is creating a centralized Customs Authority and Data Hub by 2026, removing the €150 tax exemption for low-value parcels (Reuters).
- China's cross-customs returns policy went national on April 1, 2026: returned cross-border ecommerce export goods can now re-enter through any customs port rather than only the original export office — the result of a 2024 pilot at 20 customs offices including Shanghai, Beijing and Chengdu (English.gov.cn, China Daily).
- Digital Sales Tax: More countries are introducing or expanding digital sales taxes, impacting pricing and compliance for international sellers.
Why This Matters
- Unit economics can shift overnight with new fees or documentation requirements.
- Data requirements are rising—brands need structured, up-to-date product and shipment data to stay compliant.
How Thunderbit Helps
Automate ongoing monitoring with Thunderbit Get Started Free
Thunderbit can extract regulatory and policy data from government and trade websites, helping brands:
- Monitor policy changes in real time.
- Adjust pricing and shipping strategies quickly.
- Automate compliance checks by scraping required documentation fields directly into your workflow.
Pro tip: Set up a scheduled Thunderbit scrape to monitor official customs or trade sites for updates—so you’re never caught off guard by a new regulation.
Key Takeaways: What the 2026 Data Means for Global Ecommerce
Let’s wrap up with the most important insights from this year’s global ecommerce statistics and trends:
- Cross-border ecommerce is mainstream: With an implied market size of US$2.16T and nearly 45% of global B2C ecommerce sales, international shopping is the new normal (Polaris Market Research).
- Mobile and social are driving growth: Nearly 70% of ecommerce is happening on mobile, and social platforms are the new storefronts (eMarketer; DataReportal).
- Logistics and trust are make-or-break factors: Delivery times are improving, but shoppers demand transparency and security (IPC; DHL).
- Policy changes are accelerating: Customs, tax, and returns rules are shifting fast—brands need to stay agile (Reuters; English.gov.cn).
- Data-driven decision-making is a must: Teams using tools like Thunderbit to gather, analyze, and act on global online shopping data are outpacing the competition.
Actionable recommendations:
- Invest in mobile-first, localized shopping experiences—especially for cross-border buyers.
- Benchmark logistics and shipping policies against top competitors using real-time data.
- Monitor regulatory changes proactively to avoid compliance surprises.
- Leverage AI-powered tools like Thunderbit for ongoing market, competitor, and policy analysis.
- Prioritize trust and transparency in payments, delivery, and returns to boost conversion.
Sources & Further Reading
For those who want to dig deeper, here are the key sources and databases used in this report:
- Polaris Market Research: Cross-Border B2C Ecommerce Market
- Trade.gov: Ecommerce Sales Size & Forecast
- DataReportal: Digital 2026 Global Overview Report
- DHL: 2025 Cross-Border Ecommerce Trends
- CBCommerce: Top 100 Cross-Border Marketplaces Europe Report
- EuroCommerce: European Ecommerce Growth
- Reuters: EU Customs and Parcel Imports
- STD Daily: China Cross-Border Ecommerce
- English.gov.cn: China Customs Policy
- OECD: Digital Payments Adoption
- eMarketer: Mobile Commerce Trends
- Klarna Investors: 2025 Results
- IPC: Cross-Border Ecommerce Shopper Survey
- LexisNexis: Ecommerce Fraud Costs
- ECDB: Cross-Border Revenue by Company
For more tips, guides, and data-driven insights, check out the Thunderbit Blog, plus:
- What Is Data Scraping and How to Do It in 2025
- How to Scrape Any Website Using AI
- How to Scrape Website Data into Excel using AI
FAQs
1. What percentage of global ecommerce is cross-border in 2026?
About 45% of global B2C ecommerce sales are cross-border in 2026, based on the latest market size estimates (Polaris Market Research; Trade.gov).
2. Which regions are leading in cross-border ecommerce growth?
Asia-Pacific (APAC) and Europe are leading, with China dominating exports and Europe seeing high cross-border sales via marketplaces. LATAM is the fastest-growing region for new online shoppers.
3. What are the main challenges in cross-border ecommerce logistics?
The biggest challenges are shipping costs, delivery speed, customs complexity, and returns management. However, technology and policy changes are helping brands overcome these hurdles.
4. How can Thunderbit help ecommerce businesses with cross-border market analysis?
Thunderbit enables teams to scrape and analyze global market, competitor, logistics, and regulatory data—helping with faster decision-making, pricing intelligence, and compliance monitoring.
5. What policy changes should cross-border sellers watch in 2026?
Key changes include EU customs reform (centralized authority, tax exemption removal), China’s new returns policy, and the expansion of digital sales taxes. Monitoring these shifts is critical for compliance and profitability.
Curious how Thunderbit can help you turn all this data into action? Download the Chrome Extension and see for yourself. And if you’re hungry for more stats, strategies, and how-tos, swing by the Thunderbit Blog. Here’s to smarter, faster, and more global ecommerce in 2026!
Turn Ecommerce Data into Action with Thunderbit
Try Thunderbit AI Web Scraper for Ecommerce Get Started Free