
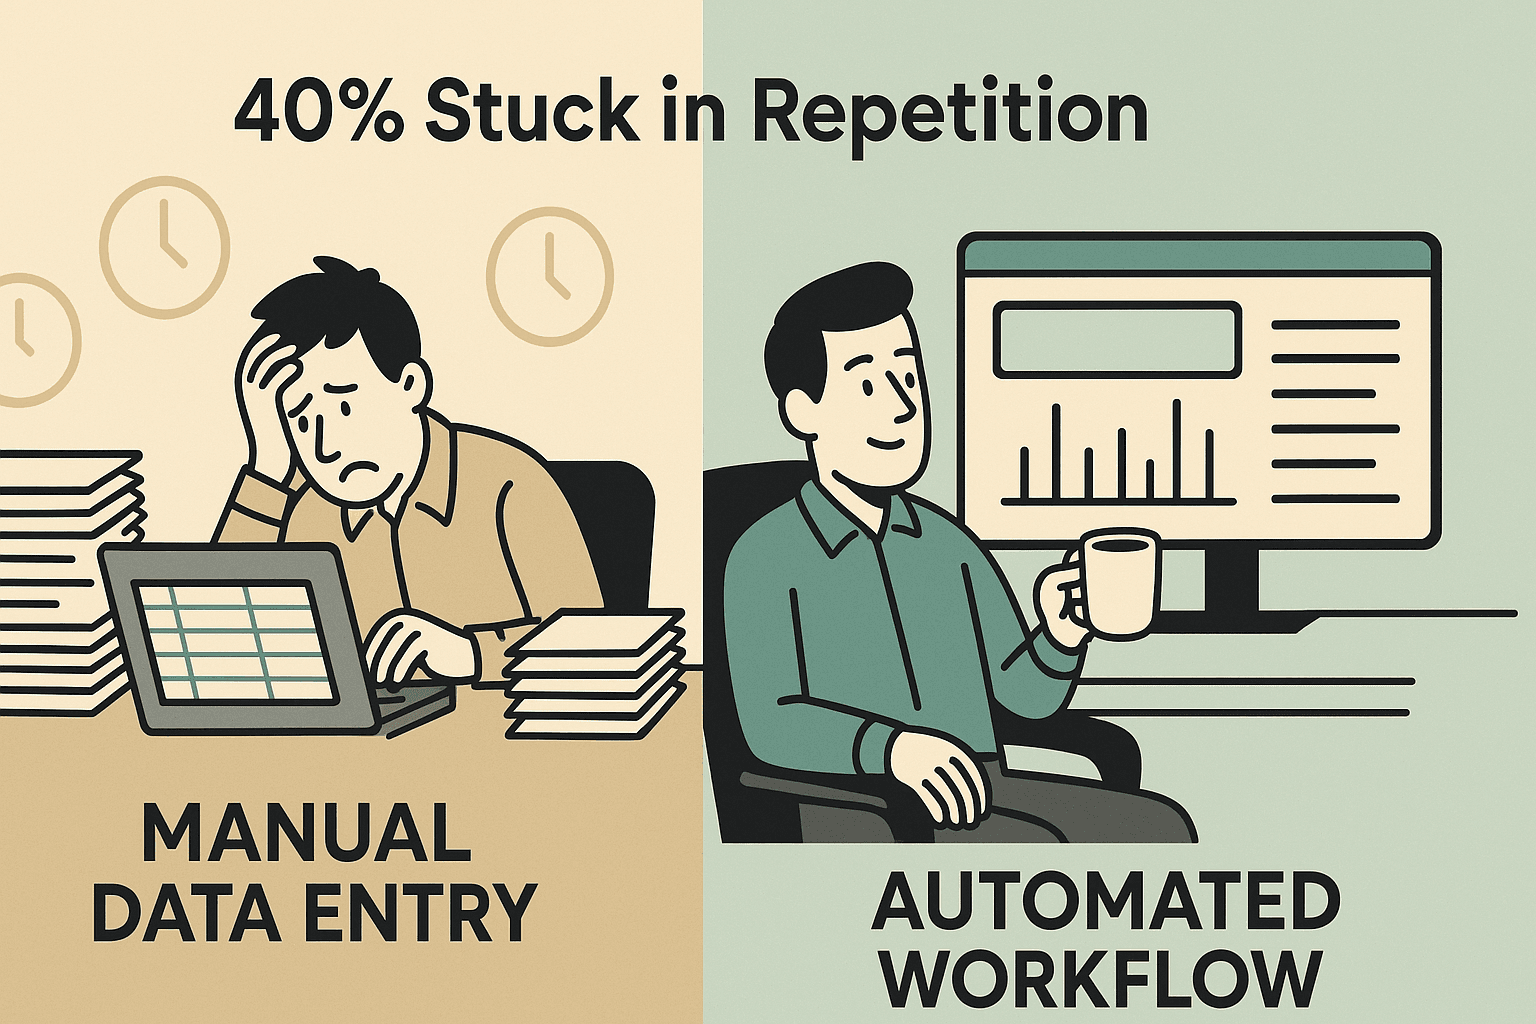
Ever found yourself staring at a photo of a table—maybe a scanned invoice, a screenshot from a dashboard, or a picture of a printed report—wishing you could just copy and paste that data into Excel? You’re not alone. In fact, say they spend at least a quarter of their week on repetitive tasks like manual data entry. As someone who’s spent years building automation tools, I can tell you: there’s a much better way. The rise of AI-powered OCR (Optical Character Recognition) means you can now convert an image of a table to Excel in seconds—no more squinting, no more typos, and no more wasted afternoons.
In this guide, I’ll walk you through why this conversion matters, the pitfalls of doing it by hand, and how to use —our AI web scraper and OCR tool—to turn any table image into an editable Excel file (plus Google Sheets, CSV, Airtable, and more). Whether you’re in sales, ops, finance, or just tired of copy-pasting, let’s dive in and make your data work for you.
Why Convert Image of Table to Excel? Unlocking Data for Better Workflows
Let’s face it: table data is everywhere, but it’s not always in a friendly format. Here are some everyday scenarios I see all the time:
- Finance teams get invoices or receipts as images. They need to sum totals, run expense reports, or import data into accounting software—but the numbers are locked in a JPEG or PDF.
- Operations and marketing folks screenshot dashboards or web reports. To analyze trends or merge with other datasets, they need that data in Excel, not stuck in a PNG.
- HR and compliance deal with scanned forms or contracts, often with attendance sheets or audit checklists in table form. Searching or aggregating this info is a nightmare unless it’s in a spreadsheet.
- Sales teams collect business cards or event attendee lists as photos. Importing those leads into a CRM requires structured data, not a camera roll full of images.
- Analysts and researchers might have old documents or survey results as images. Without conversion, that info is basically lost to the ages.
The bottom line? Until you convert an image of a table to Excel, that data is trapped. Once it’s in a spreadsheet, you can analyze, report, automate, and actually use it. No more manual typing, no more errors, and no more “Sorry, I can’t run that report because the data’s in a screenshot.”
And the ROI is real: are actively digitizing documents and images to streamline workflows and improve access.
Manual vs. Automated: The Real Cost of Converting Table Images
I’ve been there—staring at a table in an image, typing each value into Excel, and hoping I don’t make a mistake. But manual data entry is more than just boring; it’s expensive and risky.
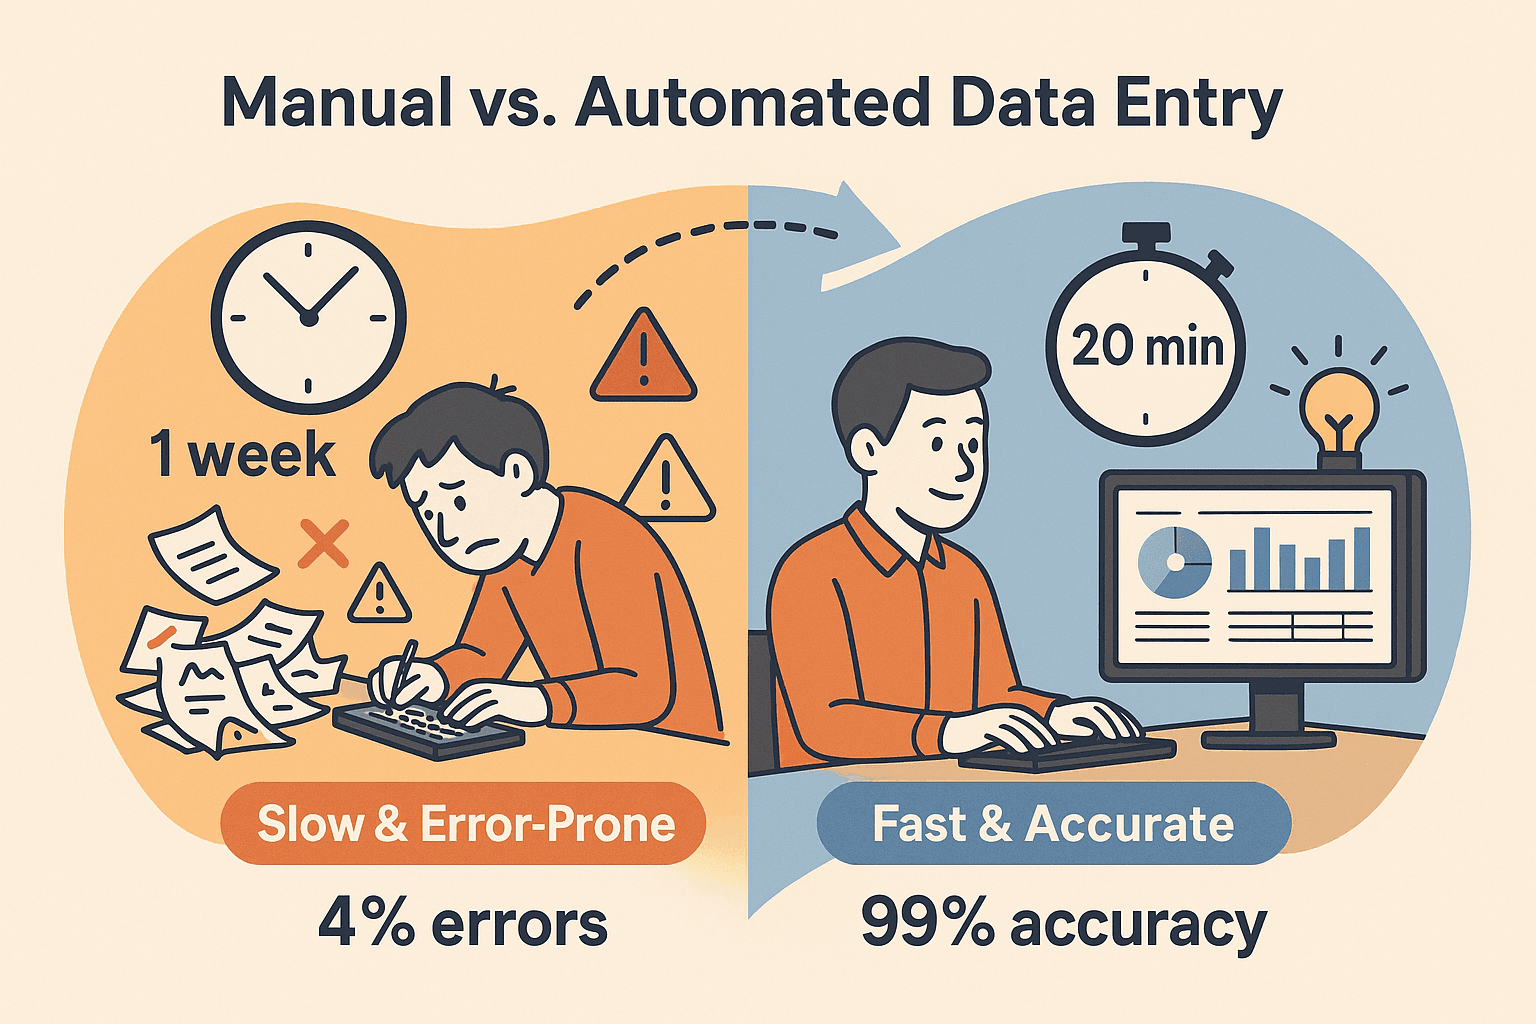
- Time drain: Manually entering data from images is slow. One company I worked with spent a full week processing 10,000 records by hand. With automation, the same job took 20 minutes ().
- Error-prone: Human error rates in manual entry can hit 4% or more (). That’s a lot of mistakes—especially when payroll errors alone cost U.S. businesses .
- Opportunity cost: Every hour spent retyping is an hour not spent on analysis, strategy, or sales.
No wonder see automation as a way to reclaim their time.
Enter OCR: Optical Character Recognition uses AI to “read” text from images. Modern AI-powered OCR doesn’t just see letters—it understands table structure, headers, and even data types. That means you get a real spreadsheet, not a jumbled mess of text.
Meet Thunderbit: The Fastest Way to Convert Image of Table to Excel
This is where Thunderbit comes in. We built as an AI web scraper and OCR tool that makes converting images of tables to Excel as easy as drag, drop, and done.
What makes Thunderbit different?
- AI-powered OCR: Thunderbit doesn’t just read text—it understands tables, headers, and data types. It even uses a Markdown-like internal blueprint to preserve structure ().
- No technical skills needed: Just upload your image (JPG, PNG, PDF, etc.), click “AI Suggest Fields,” and let Thunderbit do the rest.
- Flexible export: Send your data to Excel, Google Sheets, CSV, Airtable, Notion, or even Word—all in one click.
- Works in your browser: Thunderbit is a , so there’s nothing to install beyond a quick add-on.
- Free to try: You get up to 6 pages free (or 10 with a trial boost), and all features are unlocked for small jobs.
I’ve seen users go from “I’ll have to type this up tonight” to “Here’s your Excel file” in under a minute. It’s like having a super-speedy intern—minus the coffee breaks.
Step-by-Step: How to Convert Image of Table to Excel with Thunderbit
Ready to see how easy this can be? Here’s how I convert images of tables to Excel using Thunderbit:
Step 1: Install and Open Thunderbit
- Head to the and click “Add to Chrome.”
- Once installed, you’ll see the Thunderbit icon in your browser toolbar.
- Click the icon to launch Thunderbit. (You may need to sign up for a free account—don’t worry, it’s quick.)
Thunderbit works on any Chromium browser (Chrome, Edge, Brave) and any OS—if you can run Chrome, you can run Thunderbit.
Step 2: Upload Your Table Image
- Drag and drop your image file (JPG, PNG, GIF, BMP, PDF, etc.) into the Thunderbit panel.
- Or, if you spot a table image on a website, right-click it and choose “Extract with Thunderbit.”
- Thunderbit supports images up to 10 MB—plenty for even high-res scans.
You’ll see a preview of your image in the Thunderbit interface, ready for AI analysis.
Step 3: Let AI Extract the Table
- Click the “AI Suggest Fields” button.
- Thunderbit’s AI will:
- Analyze the image layout and detect tables, columns, and headers.
- Use OCR to read the text, but with awareness of structure (so “Price” and “Product” stay in the right columns).
- Suggest intelligent column names and data types (dates, numbers, currency, etc.).
- The process is fast—usually just a few seconds.
Thunderbit even handles multi-language tables, mixed content, and complex layouts ().
Step 4: Review and Edit Extracted Data
- Check the preview table in Thunderbit’s spreadsheet-like view.
- Edit column names if you want (e.g., change “ProductName” to “Item Name”).
- Adjust data types (text, date, number) as needed.
- For advanced users, add custom AI instructions to transform or categorize data on the fly (optional).
- If there’s extra text outside the table (like notes or captions), you can keep or ignore it.
Most of the time, you won’t need to tweak much—Thunderbit’s AI is pretty sharp. But it’s always good to give the output a quick once-over.
Step 5: Export Table Data to Excel
- Click “Export” and choose your format:
- Excel (.xlsx): For analysis, charts, pivot tables, or integration with other tools.
- CSV: For lightweight sharing or importing into databases.
- Google Sheets: For real-time collaboration—Thunderbit can send data directly to a new Sheet.
- Airtable or Notion: For project management, CRM, or knowledge base workflows.
- Word (.docx): If you need the table in a document.
- Plain text: For raw data or further processing.
- You can export to multiple formats at once—no need to repeat the process.
And yes, exports are free—no hidden paywalls just to get your data out ().
Thunderbit vs. Other Solutions: Which Image-to-Excel Converter Is Right for You?
Thunderbit isn’t the only way to convert image of table to Excel, but it’s one of the most flexible and user-friendly. Here’s how it stacks up against other popular options:
| Feature/Criteria | Thunderbit | Excel Built-in (“Data from Picture”) | Online Converters (e.g., Convertio) | Desktop OCR (ABBYY, Acrobat) |
|---|---|---|---|---|
| Ease of Use | Very easy (browser, drag & drop, AI guides) | Easy (in Excel app, a few clicks) | Easy (web upload, one file at a time) | Moderate (install, learn settings) |
| Accuracy | High (AI preserves structure, smart headers) | Good for simple tables, less so for complex layouts | Varies (good for simple, struggles with complex) | Very high (best for complex docs) |
| Supported Formats | Images (JPG, PNG, PDF), multi-format export | Images (and PDFs via image), Excel only | Images/PDF, Excel/CSV | Images, PDFs, Excel, CSV, Word |
| Batch Processing | Moderate (multi-page, some automation) | None (one image at a time) | Limited (batch in paid plans) | Excellent (batch folders, automation) |
| Export Options | Excel, CSV, Google Sheets, Airtable, Notion, Word, TXT | Excel only | Excel, CSV (one at a time) | Excel, CSV, Word, PDF, DB |
| Cost | Free tier (6–10 pages), paid plans from $15/mo | Included with Microsoft 365 | Free for small jobs, paid for more | Expensive (hundreds per license) |
Bottom line:
- For quick, simple jobs and if you already have Excel, the built-in feature is handy.
- For more complex tables, multiple formats, or batch needs, Thunderbit is a sweet spot—powerful, affordable, and easy.
- For massive, ongoing projects or highly sensitive data, desktop OCR software is worth considering (if you don’t mind the price tag).
Tips for Accurate Image to Excel Conversion
No matter which tool you use, the quality of your input image makes a big difference. Here’s what I’ve learned after seeing thousands of conversions:
- Use high-resolution images: The clearer the text, the better the OCR. Aim for at least 300 DPI if scanning.
- Good lighting and contrast: Avoid shadows, glare, or low-contrast backgrounds.
- Align the document: Try to scan or photograph the table straight-on, not at an angle.
- Crop to the table: Remove unnecessary background or content to focus the OCR.
- Printed text beats handwriting: Most OCR tools (Thunderbit included) work best on printed tables. Handwriting is much tougher.
- Check for gridlines or clear separation: Visible cell borders or alternating row colors help the AI keep columns straight.
- Review the output: Even the best AI can confuse an “S” for a “5.” Double-check before you rely on the data.
For more on best practices, check out .
Beyond Excel: Exporting Table Data to Multiple Formats with Thunderbit
One of my favorite Thunderbit features is the ability to export your extracted table to multiple destinations—Excel, CSV, Google Sheets, Airtable, Notion, Word, and plain text. Why does this matter?
- Excel: For analysis, reporting, and integration with other business tools.
- Google Sheets: For sharing and collaboration, especially with remote teams.
- Airtable: For CRM, project tracking, or content management.
- Notion: For documentation, knowledge bases, or internal reports.
- Word: For inserting tables into documents or reports.
- Plain text: For further processing or indexing.
This flexibility means your data can flow wherever your team needs it—no more redoing the extraction for each format. I’ve seen teams export to Excel for finance, Google Sheets for marketing, and Airtable for sales—all from the same image.
When to Use Batch Processing for Table Image Conversion
If you’re dealing with a stack of table images—say, a week’s worth of invoices or a cabinet full of scanned forms—batch processing is a lifesaver.
- Thunderbit: Handles multi-page documents and can process multiple images with some automation (especially if you use its scheduling or cloud scraping features). For very large batches, you might want to script the process or break it into chunks.
- Desktop OCR software: Tools like ABBYY FineReader are built for batch—drop in a folder of images, and they’ll churn out Excel files for each.
- Online converters: Some (like Convertio) offer batch processing in paid plans, but free versions are usually limited.
Pro tip: Keep your output files organized (e.g., Inventory001.xlsx, Inventory002.xlsx), and review a sample of the results to catch any systematic errors.
Conclusion: Make Table Data Work for You
Converting an image of a table to Excel used to be a dreaded chore. Now, with AI-powered tools like Thunderbit, it’s a breeze. You save hours, reduce errors, and unlock data for analysis, automation, and smarter decisions. Whether you’re handling a single receipt or a hundred scanned reports, Thunderbit makes the process fast, accurate, and flexible.
Ready to give it a try? , upload your first table image, and see how much time you can save. Your spreadsheets—and your sanity—will thank you.
Thunderbit vs. Other Image-to-Excel Solutions: Feature Comparison
| Feature | Thunderbit | Excel Built-in | Online Converters | Desktop OCR (ABBYY, Acrobat) |
|---|---|---|---|---|
| Ease of Use | ⭐⭐⭐⭐⭐ | ⭐⭐⭐⭐ | ⭐⭐⭐⭐ | ⭐⭐⭐ |
| Accuracy (Complex Tables) | ⭐⭐⭐⭐⭐ | ⭐⭐⭐ | ⭐⭐⭐ | ⭐⭐⭐⭐⭐ |
| Multi-Format Export | ⭐⭐⭐⭐⭐ | ⭐ | ⭐⭐ | ⭐⭐⭐⭐ |
| Batch Processing | ⭐⭐⭐ | ⭐ | ⭐⭐ | ⭐⭐⭐⭐⭐ |
| Cost (Entry) | Free tier | Included | Free/small jobs | Expensive |
| Cloud Integration | Yes | No | No | No |
FAQs
1. What types of images can Thunderbit convert to Excel?
Thunderbit supports all common image formats (JPG, PNG, GIF, BMP) and PDFs. If your computer can open it, Thunderbit can read it.
2. Does Thunderbit work with handwritten tables?
Thunderbit (and most OCR tools) work best with printed text. Handwriting, especially cursive or messy writing, is much harder to recognize accurately.
3. Can I export my table data to Google Sheets or Airtable?
Absolutely! Thunderbit lets you export directly to Google Sheets, Airtable, Notion, Excel, CSV, Word, and more—all in one click.
4. Is Thunderbit free to use?
Thunderbit offers a free tier (up to 6 pages, or 10 with a trial boost). Paid plans start at $15/month for heavier use, but all features are unlocked on the free tier for small jobs.
5. How can I improve the accuracy of image-to-Excel conversion?
Use high-resolution images, good lighting, and clear, printed tables. Crop to the table region, align the document straight, and review the output for any minor corrections.
Ready to unlock your data? and let AI handle the tedious work—so you can focus on what matters. For more tips and guides, check out the .