
Analyzing competitors’ website traffic used to feel like reading tea leaves—lots of guesswork, not much clarity. But in today’s digital world, where every click leaves a trail and every trend can be measured, understanding your rivals’ online visitors is more like having a backstage pass to the market. I’ve seen firsthand how a little competitive intelligence can turn a struggling campaign into a winner, or help a sales team spot an opportunity before anyone else. The best part? You don’t need to be a data scientist (or even a spreadsheet wizard) to get started.
In this guide, I’ll walk you through how to analyze competitors’ website traffic for actionable insights—using tools like SimilarWeb for the big-picture numbers, and (our own AI web scraper) to dig into the details. Whether you’re in sales, marketing, or operations, you’ll learn how to turn traffic data into smarter strategies, spot industry shifts early, and automate the grunt work so you can focus on what matters. Let’s dive in.
Why Analyzing Competitors’ Website Traffic and Online Visitors Matters
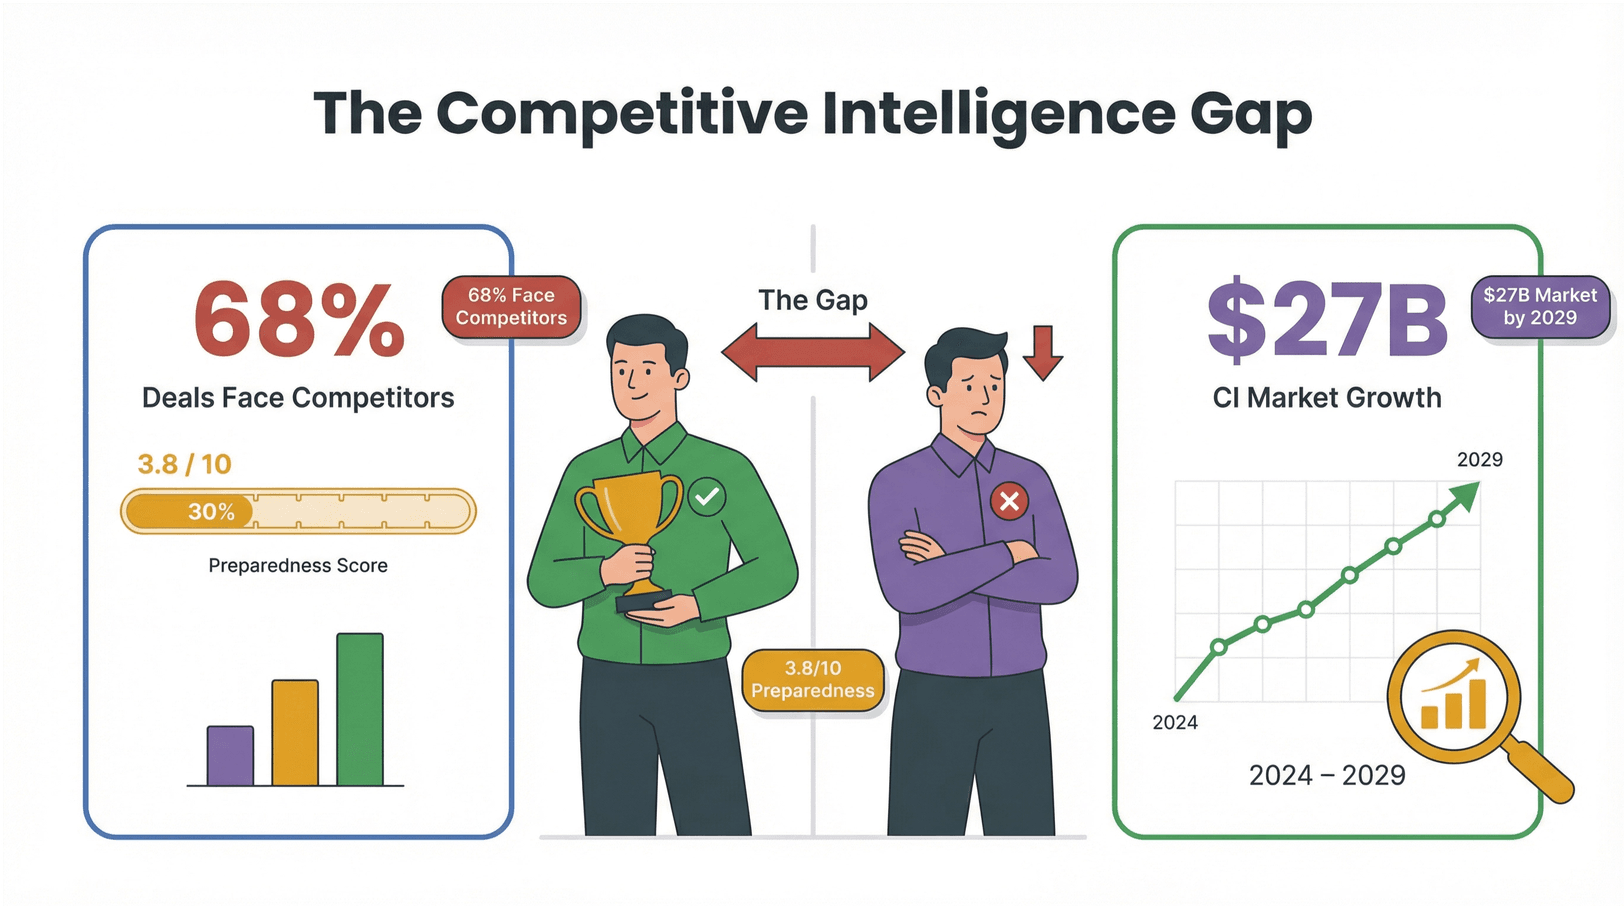
Competitive intelligence isn’t just a buzzword—it’s a proven growth lever. According to a recent , sellers face direct competitors in 68% of deals, yet most teams rate their competitive preparedness at just 3.8 out of 10. That gap can mean $2M–$10M a year in lost deals. And with the competitive intelligence tools market projected to grow by , it’s clear that more businesses are waking up to the value of traffic analysis.
But what does this look like in practice? Here’s how analyzing competitor website traffic and online visitors can directly impact your business:
| Use Case | What You Learn | How It Helps |
|---|---|---|
| Spotting Market Trends | Which competitors are gaining/losing visitors | Adjust your strategy before the market shifts |
| Benchmarking Performance | How your traffic stacks up against rivals | Set realistic goals and measure progress |
| Identifying New Customer Segments | Where competitors’ visitors come from (geo, device, channel) | Find untapped audiences for your campaigns |
| Optimizing Content & Offers | Which pages or campaigns drive engagement | Refine your messaging and landing pages |
| Tracking Industry Shifts | Sudden spikes/drops in competitor traffic | React quickly to new launches or promotions |
Real-world examples? used competitive traffic insights to optimize marketing and saw a 2.5× growth in six months. boosted online sales by 41% after benchmarking against competitors. These aren’t just vanity metrics—they’re bottom-line results.
Key Metrics to Track When You Analyze Competitor Traffic
Let’s break down the most important metrics you’ll see in tools like SimilarWeb, Semrush, or Google Analytics. Each one tells a different part of the story:
- Total Visits / Sessions: The total number of times users visited a website in a given period. This is your “headline” number—great for tracking momentum.
- Unique Visitors / Users: How many individual people visited the site. Useful for understanding reach and audience growth.
- Bounce Rate: The percentage of visitors who leave after viewing just one page. High bounce rates can signal poor content fit or irrelevant traffic.
- Average Visit Duration: How long users spend on the site per visit. Longer durations often mean more engaged visitors.
- Pages per Visit: The average number of pages viewed in a session. More pages can indicate effective site structure or compelling content.
- Traffic Sources / Channel Mix: Where visitors come from—direct, organic search, paid search, social, referral, email, display. This reveals which channels are driving growth.
Here’s a quick cheat sheet for interpreting these numbers:
| Metric | What It Reveals | Why It Matters |
|---|---|---|
| Total Visits | Overall popularity/trend | Are they gaining or losing attention? |
| Unique Visitors | Audience size | Is their reach expanding? |
| Bounce Rate | Content/offer fit | Is their messaging resonating? |
| Visit Duration | Engagement quality | Are users sticking around? |
| Pages/Visit | Site structure/content depth | Is the site easy to navigate? |
| Channel Mix | Acquisition strategy | Are they buying growth or earning it? |
For a deeper dive into how to use these signals, check out and .
Tools for Competitors Website Traffic Analysis: Spotlight on SimilarWeb
When it comes to analyzing competitor website traffic, is one of the most popular and user-friendly tools out there. It’s trusted by everyone from Fortune 500s to scrappy startups—and for good reason.
How SimilarWeb Works:
- Enter your competitor’s domain into the Website Traffic Checker.
- Instantly see estimated total visits, unique visitors, engagement metrics, and traffic sources.
- Use the dashboard to compare up to four competitors side-by-side.
- Drill down by country, device, or time period.
- Export high-level reports (with more detail available on paid plans).
What You’ll See:
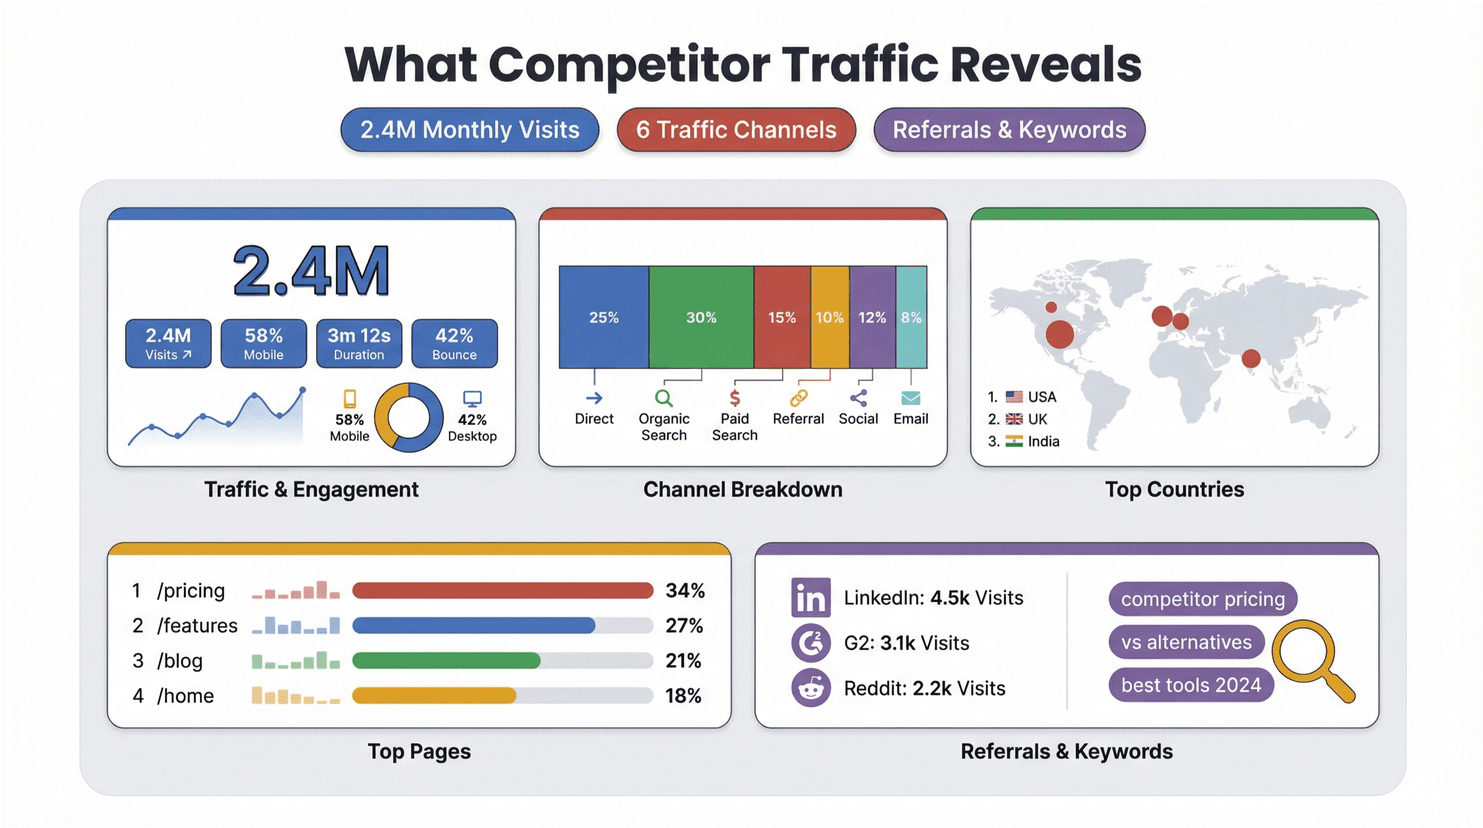
- Traffic & Engagement: Total visits, device split, visit duration, bounce rate, pages per visit.
- Channel Breakdown: Direct, organic search, paid search, referral, social, email, display.
- Geography: Top countries sending traffic.
- Top Pages: Which URLs get the most visits.
- Referrals & Search Terms: Where traffic is coming from and which keywords are driving it.
Free vs. Paid: The free version gives you a solid overview, but if you want to dig into historical trends, export detailed data, or analyze smaller competitors, you’ll need a paid plan. (For a full breakdown, see .)
Pro Tip: Use the for quick, at-a-glance traffic checks as you browse.
Getting More from Competitor Analysis: Using Multiple Traffic Tools
No single tool is perfect—each has its strengths and blind spots. Here’s a quick comparison of the big players:
| Tool | Best For | Watch Out For | Entry Price | User Rating |
|---|---|---|---|---|
| SimilarWeb | Total traffic, channel mix, benchmarking | Less accurate for very small sites | Free sample, paid plans | 4.6/5 (Capterra) |
| Semrush | Marketing suite, traffic trends, top pages | Complex UI, estimates only | $139.95/mo | 4.6/5 (Capterra) |
| Ahrefs | SEO, organic search, backlinks | Focuses on organic, not total traffic | $29/mo+ | 4.7/5 (Capterra) |
| Ubersuggest | Budget SEO, keyword/domain overview | Limited free tier, fewer features | $12/mo+ | 4.4/5 (Software Advice) |
Why use more than one? Because traffic numbers are always estimates—especially for competitors. found that SimilarWeb, Semrush, and Ahrefs all correlate with real analytics, but none are perfect. For the best insights, compare trends and rankings across tools, not just the raw numbers.
Thunderbit: Simplifying Competitor Website Data Extraction
Traffic metrics tell you what is happening—but to understand why, you need to see what’s actually on your competitors’ sites. That’s where comes in.
Thunderbit is an AI-powered Chrome extension that lets you scrape any website in just two clicks. Here’s how it helps with competitor analysis:
- 2-Click Scraping: Click “AI Suggest Fields” and Thunderbit auto-detects the most relevant data on the page—like product descriptions, user reviews, pricing tables, or blog headlines. Click “Scrape,” and you’ve got a structured table, ready to export.
- Subpage Scraping: Need more detail? Thunderbit can visit every product page, review, or article linked from a competitor’s site and pull all that data into one spreadsheet.
- Export Anywhere: Send your data straight to Excel, Google Sheets, Airtable, or Notion. No more copy-paste marathons.
- Scheduled Scraping: Set Thunderbit to automatically scrape key competitor pages on a schedule—daily, weekly, or monthly—so you never miss a change.
This isn’t just about saving time (though, trust me, it does). By pairing traffic numbers with real content—landing page headlines, CTAs, pricing changes, new blog posts—you get the full story behind your competitors’ moves.
Want to see how Thunderbit works? Check out our .
Combining Thunderbit and SimilarWeb for Deeper Competitor Insights
Here’s where things get really powerful: use SimilarWeb for the “what” (traffic, channels, trends), and Thunderbit for the “why” (content, offers, user feedback).
Sample Workflow:
- Pick Your Competitors: Choose 5–10 direct and indirect competitors to track.
- Traffic Baseline: Use SimilarWeb to benchmark visits, engagement, and channel mix. Export the data or take screenshots for your records.
- Find Anomalies: Look for spikes, drops, or shifts in channel mix. Did a competitor’s traffic double overnight? Did they start getting more referral or social traffic?
- Identify Top Pages: In SimilarWeb or Semrush, see which URLs are driving the most visits.
- Extract Evidence: Use Thunderbit to scrape those top pages—grab headlines, offers, CTAs, testimonials, and even subpage data like reviews or product details.
- Synthesize Insights: Map “channel → page → message → offer.” If a competitor’s paid traffic is up and their new landing page has a big discount banner, you know what’s driving the spike.
- Report & Act: Organize your findings in Excel or Google Sheets. Use tabs for traffic, channel breakdown, top pages, and action items.
For a ready-made template, try this structure:
- Competitor Snapshot: Domain, segment, visits, engagement, channel mix, notes.
- Channel Breakdown: Share of traffic by channel, top referrers, ideas to test.
- Top Pages Evidence: URL, page type, CTA, offer, proof, friction, change log.
- Actions: Opportunity, what to do, owner, due date, KPI.
Step-by-Step Guide: Analyzing Competitors Website Traffic from Start to Finish
Let’s put it all together. Here’s my go-to process for analyzing competitor traffic—no technical skills required:
- Identify Your Competitors: Start with your direct rivals, but don’t forget adjacent players or up-and-comers.
- Gather Traffic Data: Use SimilarWeb (and optionally Semrush/Ahrefs) to collect visits, unique users, engagement, and channel mix. Compare over time and across devices/countries.
- Extract Site Content: With Thunderbit, scrape key landing pages, pricing tables, product listings, and user reviews. Use subpage scraping for deeper dives.
- Benchmark Results: Organize your data in a spreadsheet. Highlight trends, anomalies, and opportunities.
- Draw Conclusions: What’s working for your competitors? Where are they investing? Where are they vulnerable?
- Take Action: Adjust your content, campaigns, or sales strategy based on what you’ve learned.
- Repeat Regularly: Set up scheduled scraping and monthly traffic checks to stay ahead of the curve.
Here’s a quick checklist you can copy:
- [ ] List competitors and target segments
- [ ] Collect traffic/engagement data (SimilarWeb)
- [ ] Identify top pages and channels
- [ ] Scrape content and offers (Thunderbit)
- [ ] Organize findings in Excel/Sheets
- [ ] Share insights with your team
- [ ] Schedule regular updates
Automate Competitor Monitoring with Thunderbit’s Scheduled Scraping
Manually checking competitor sites every week? That’s a fast track to burnout (and missed opportunities). Thunderbit’s feature lets you automate the whole process:
- Set it and forget it: Choose which pages to monitor (pricing, promos, reviews, blog index).
- Pick your frequency: Daily, weekly, or monthly—whatever fits your market’s pace.
- Export automatically: Send updates straight to Excel or Google Sheets for easy analysis.
- Never miss a change: Get notified when a competitor updates their offers, launches a new campaign, or shifts their messaging.
This is a lifesaver for sales and marketing teams who need to react fast. I’ve seen teams catch competitor price drops or new product launches within hours—just by letting Thunderbit do the heavy lifting in the background.
Turning Competitor Traffic Insights into Actionable Strategies
So you’ve got the data—now what? Here’s how to turn competitor website traffic and online visitor insights into real business impact:
- Content Strategy: If a competitor’s blog is driving tons of organic traffic, analyze their top posts with Thunderbit and create your own spin on high-performing topics. (You may also like: )
- Sales Enablement: Spot which landing pages or offers are converting best for your rivals. Use those insights to refine your own sales collateral or outreach scripts.
- Channel Optimization: If a competitor is suddenly getting more referral or social traffic, investigate their partnerships or viral campaigns—and consider similar moves.
- Market Expansion: Notice a spike in traffic from a new country or device? That could be your cue to localize content or launch targeted ads.
- Product Development: Scraping user reviews or testimonials can reveal pain points and feature requests—gold for your roadmap. (Related: )
The key is to make competitor analysis a regular habit, not a one-off project. Markets move fast, and the teams that win are the ones who spot shifts early and act decisively.
Conclusion & Key Takeaways
Analyzing competitors’ website traffic isn’t just for big brands with data teams—it’s a must-have skill for anyone who wants to grow in a crowded market. With tools like for the numbers and for the context, you can go from “flying blind” to “market detective” in a matter of hours.
Here’s what I hope you’ll take away:
- Traffic data reveals the “what”—content and offers explain the “why.”
- Use multiple tools for a complete picture, but don’t get hung up on exact numbers—focus on trends and actions.
- Automate what you can (with Thunderbit’s Scheduled Scraping) to save time and stay ahead.
- Turn insights into strategy—adjust your content, campaigns, and sales plays based on what’s working in the market.
Ready to get started? , run a few competitor checks in SimilarWeb, and see what new opportunities you uncover. And if you want more tips, templates, or deep dives, check out the .
FAQs
1. How accurate are competitor website traffic tools like SimilarWeb and Semrush?
They provide estimates, not exact numbers—especially for smaller sites. Studies show SimilarWeb and Semrush correlate well with real analytics for larger sites, but always use them for trends and benchmarking, not precise counts. For best results, compare across multiple tools and focus on direction, not decimals. ()
2. What’s the difference between traffic metrics like “visits” and “unique visitors”?
“Visits” (or sessions) count every time someone lands on a site, even if it’s the same person multiple times. “Unique visitors” count each individual only once in a given period. Both are useful: visits show momentum, unique visitors show reach. ()
3. How can Thunderbit help with competitor analysis?
Thunderbit lets you scrape and export competitor site content—like landing pages, pricing, reviews, and blog posts—in just two clicks. This adds qualitative context to your traffic data, helping you understand not just how much traffic a competitor gets, but why.
4. Is it legal and ethical to scrape competitor websites?
Scraping publicly available data is generally legal, but always respect website terms of service and privacy rules. Avoid scraping personal data or overloading servers. Thunderbit is designed for responsible, business-friendly use.
5. How often should I analyze competitor website traffic?
Monthly is a good baseline for most markets, but if you’re in a fast-moving space (e.g., ecommerce, SaaS, or DTC), weekly checks and automated scraping can help you react quickly to changes in the market.
Want to dig deeper? Explore these resources:
Happy analyzing—and may your insights always be one step ahead of the competition.
Learn More