
Every dropshipping forum I lurk in has the same complaint on repeat: "By the time I find a winning product, 10 other stores are already selling it."
That frustration pushed me to stop treating product research like a one-time treasure hunt and start building a repeatable workflow. The global dropshipping market is projected at , ShopRank counted as of April 2026, and nearly launched in the past 12 months alone. The opportunity is enormous — but so is the noise.
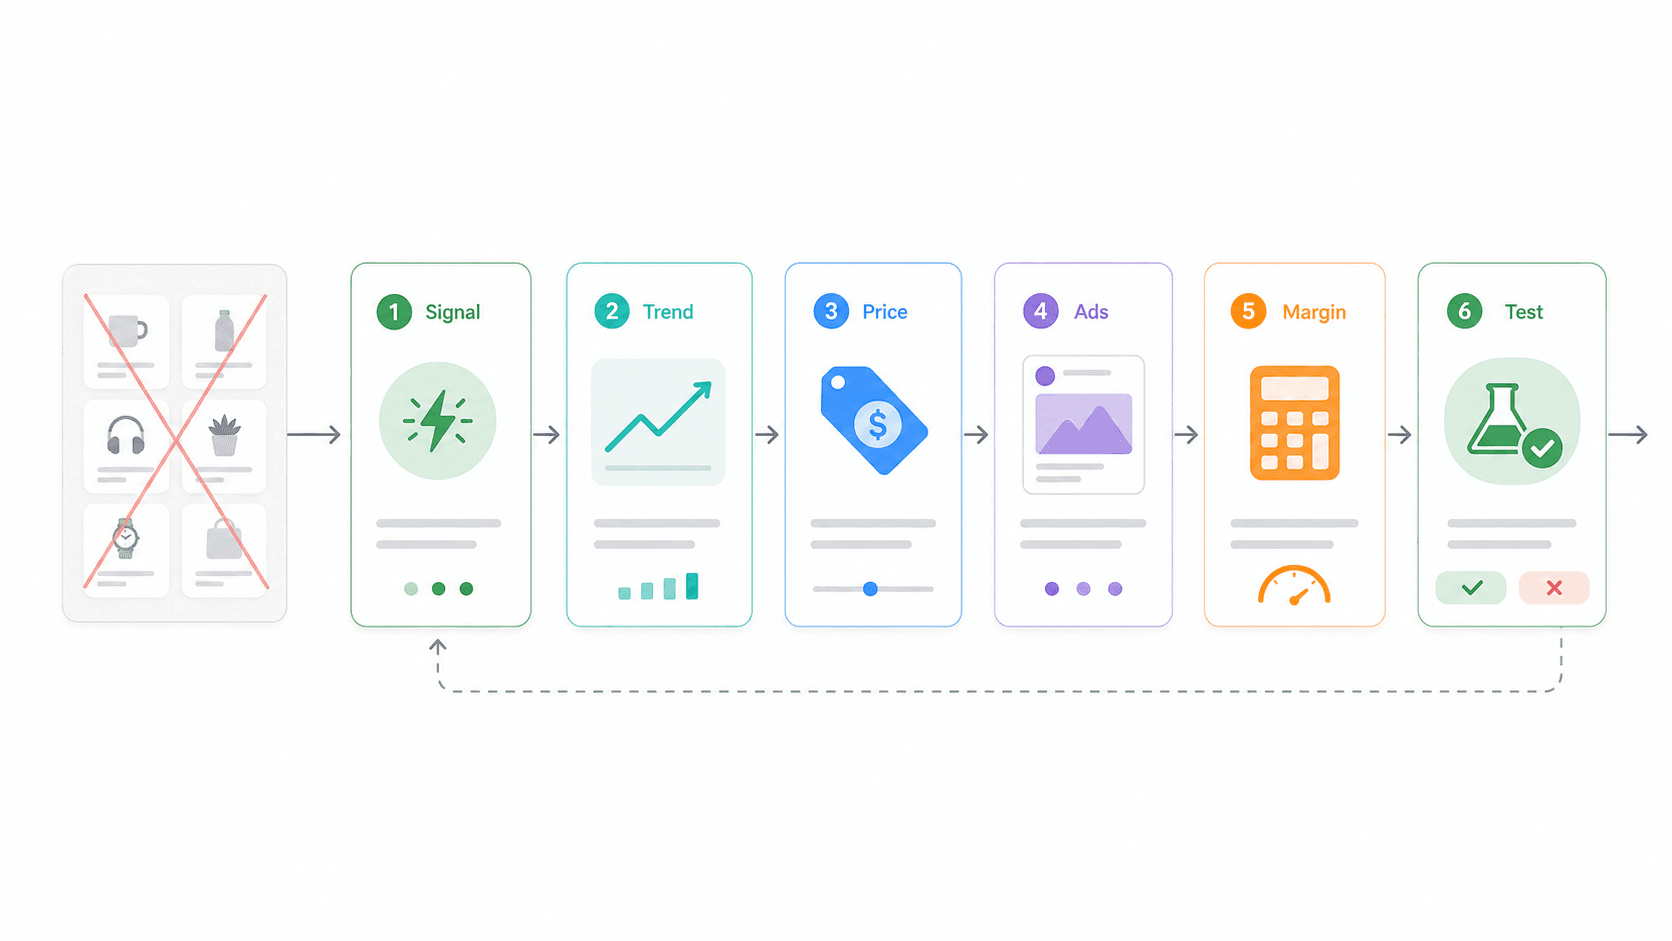
Static "top 50 products" lists are stale the moment they're indexed. What you actually need is a system: catch early signals, validate demand, check competitor pricing, confirm ad proof, and calculate margins before you spend a dollar on ads. That's what this article is — a 6-tool chain I've tested and refined, not a product list you'll throw away next week.
Why Most Shopify Dropshipping Winning Product Lists Go Stale
I ran a tiny experiment last month. I took three "winning product" lists published by popular dropshipping blogs in early 2026, searched each product on TikTok Shop and AliExpress, and counted how many active sellers were already running them. The average? Over 40 sellers per product within two weeks of publication.
Practitioners keep saying the same thing. One that product research in 2026 is "more about timing and angle than the product itself." Another that "TikTokMadeMeBuyIt is already late-stage most of the time." Brandsearch's analysis goes further, arguing that products found through shared spy-tool filters can . ProductLair's 2026 study calls the common "three weeks to three months" product lifespan answer .
The takeaway: the discovery method matters more than the product itself. What you need is a pipeline — early signal → demand validation → competitor pricing → ad proof → margin check — that you can re-run weekly. The six tools below are the steps in that pipeline, not standalone picks.
What Actually Makes a Shopify Dropshipping Product "Winning" (5-Point Checklist)
No competitor article I found provides a concrete validation framework. They'll say "find trending products" but never define what "winning" actually means in measurable terms.
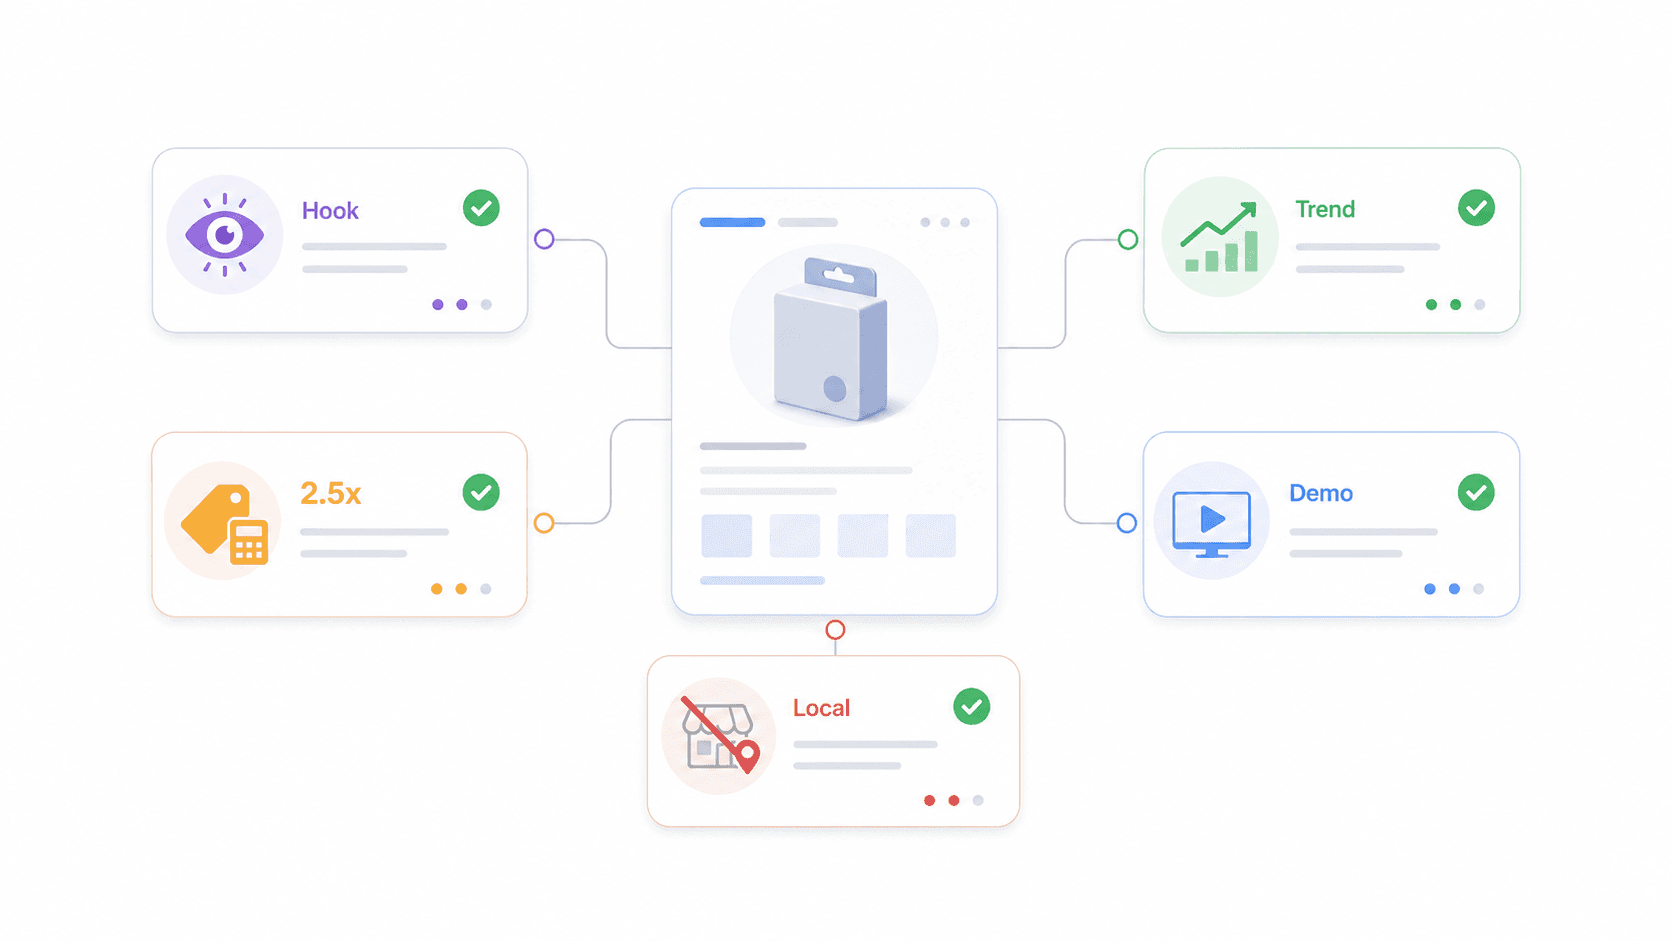
Here's the checklist I use before testing anything with ad spend.
| Criterion | What to Check | Pass Threshold | Tool to Verify |
|---|---|---|---|
| Scroll-stop factor | Does it visually grab attention in a feed? | Someone would share, comment, or save the ad | TikTok Creative Center |
| Demand trajectory | Is search interest growing, not peaking? | Google Trends line trending up over 6+ months | Google Trends |
| Margin headroom | Can you sell at ≥2.5× landed cost? | ≥40% net margin after ads + shipping | Thunderbit (scrape competitor prices + AliExpress costs) |
| Ad-testability | Can you demo the benefit in a 15-second video? | Clear before/after or problem→solution arc | Minea (check if similar products have running ads) |
| Low local availability | Not easily found at Target, Walmart, or Amazon for less? | Shoppers use terms like "where to buy [product] online" | Google Trends + Exploding Topics |
The Scroll-Stop Factor
A winning product should make someone pause mid-scroll.
Pet hair removers, electric spin scrubbers, heatless curlers, compact kitchen gadgets — these all have a visual hook. Generic phone cables and plain mugs do not.
Check this by browsing filtered by your niche. If similar products generate high engagement moments (saves, shares, comments), the scroll-stop potential is real.
Demand Trajectory (Growing, Not Peaking)
A spike is not a trend. Google's own documentation that Trends data is normalized on a 0–100 scale and that a spike doesn't prove a topic is "popular." What you want is a line that's been climbing for six months or more — not a one-week viral blip that's already falling.
Pass example: "electric spin scrubber" showing steady growth across multiple quarters. Fail example: a novelty holiday gadget that spikes in December and flatlines by January.
Margin Headroom (Can You Sell at 2.5× Landed Cost?)
Margin is the criterion most beginners skip. that lower-margin products can work only when customer acquisition cost is low, repeat purchase is strong, or average order value is high. For most beginners, if you can't sell at roughly 2.5× your landed cost, the math breaks once you add real ad spend.
Use Thunderbit to scrape competitor Shopify selling prices and AliExpress supplier costs side by side. Then calculate:
1Gross margin = (Selling price – landed cost) / selling price
2Net margin = (Selling price – landed cost – ad cost – fees – returns buffer) / selling price
Ad-Testability
If you can't explain the product's benefit in a 15-second video, your cost-per-acquisition will be painful. The best dropshipping products have a visible before/after, a quick demo, or an immediate "I need that" reaction. Use Minea to check whether similar products have active ads. Pay attention to ad duration — if a merchant keeps running creative variants for weeks, there's likely commercial viability behind it.
Low Local Availability
One warned that ads can simply make shoppers "solution aware," after which they search and buy locally or from AliExpress/Temu directly. If Target or Walmart sells the same product for less, your margins evaporate. Check Google Shopping and retailer sites before committing.
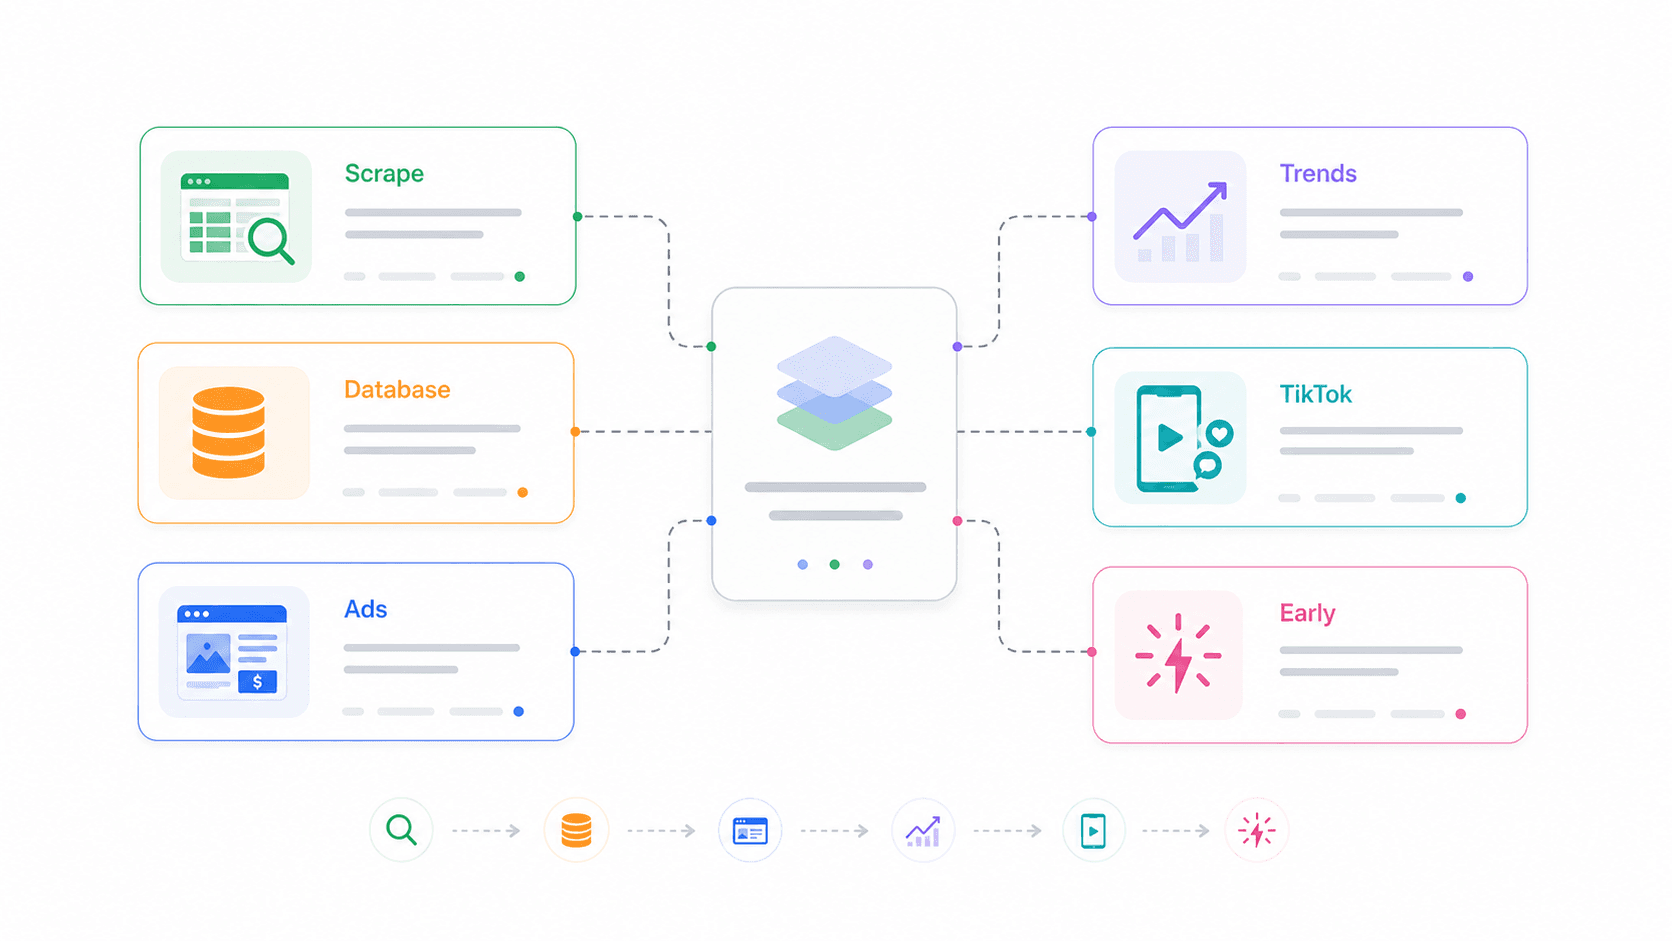
How We Tested These 6 Shopify Dropshipping Product Research Tools
I didn't rank these by feature count. I evaluated each tool by where it fits in a real weekly product research workflow — and whether it adds information you can't get elsewhere.
Evaluation criteria:
- Approach type: AI web scraping, ad spy, trend tracking, product database, or early-trend detection
- Starting price / free tier: Specific numbers, not "affordable"
- Best use case: What question does this tool answer in the pipeline?
- Learning curve: Can a beginner use it in 10 minutes?
- Data export: Can you get data into a spreadsheet or database?
| Tool | Approach | Starting Price | Best For | Free Tier | Export |
|---|---|---|---|---|---|
| Thunderbit | AI web scraping (competitor stores, AliExpress, any site) | Free (6 pages) / from ~$15/mo | Scraping competitor product listings, prices, supplier costs | Yes | Excel, Google Sheets, Airtable, Notion, CSV, JSON |
| Sell The Trend | Product database + NEXUS trend engine | ~$39.97/mo | Browsing curated trending products, store intelligence | Limited trial | Dashboard |
| Minea | Ad spy (Facebook, TikTok, Pinterest) | ~$49/mo | Finding products already running successful ads | Limited (200 credits) | Dashboard, CSV |
| Google Trends | Search interest over time | Free | Validating demand trajectory, seasonal timing | Fully free | CSV |
| TikTok Creative Center | Top-performing ad & hashtag tracking | Free | Spotting viral products gaining TikTok traction | Fully free | Manual only |
| Exploding Topics | Early trend detection (before mainstream) | Free / ~$39/mo Pro | Finding products before they saturate | Limited | Dashboard, CSV (higher tiers) |
Now the individual breakdowns — starting with the tool our team built.
1. Thunderbit: Scrape Competitor Shopify Stores and AliExpress in 2 Clicks
is the competitive intelligence layer in this workflow. Ad spy tools show what people are promoting. Curated databases show what's popular. Thunderbit gives you the actual store and supplier data behind any product — prices, reviews, variants, stock status, descriptions — from any website, structured and exported to a spreadsheet.
I'll be upfront: I work at Thunderbit, so I'm biased. But I'm putting it first because no other tool in this list answers the margin question with real numbers. You can spot a trending product with Exploding Topics and validate demand with Google Trends, but until you know the competitor's selling price and the supplier's landed cost, you're guessing.
What Thunderbit Does for Dropshipping Product Research
Thunderbit is an AI web scraper built as a . For dropshipping research, it extracts structured fields from Shopify stores, AliExpress listings, Amazon pages, and basically any website with product data. The fields that matter most:
| Field | Why It Matters |
|---|---|
| Product name | Group similar products across stores |
| Product URL | Track source and competitor |
| Price / sale price | Compare actual market pricing |
| Variant count | Spot bundle or SKU strategy |
| Image URL | Review visual appeal and creative angle |
| Description | Find positioning and claims |
| Review count / rating | Estimate social proof strength |
| Stock status | Check whether a store is actively selling |
The process is two clicks: open the extension, click AI Suggest Fields (the AI reads the page and recommends columns), then click Scrape. No code, no CSS selectors, no configuration files.
Step-by-Step: Scraping a Competitor's Shopify Best Sellers Collection
Here's an example I run regularly. Say you've spotted a competitor in the pet accessories niche.
- Navigate to their Shopify store's best-sellers collection. Most Shopify stores support the URL pattern
/collections/all?sort_by=best-selling— listbest-sellingas a valid collection sort option. - Open Thunderbit and click AI Suggest Fields. It auto-detects product name, URL, price, image, and other visible fields.
- Add or adjust columns if needed (e.g., add "sale price" or "tags").
- Enable pagination if the collection spans multiple pages.
- Use Subpage Scraping to visit each product page and enrich every row with review count, full description, stock status, and variant details.
- Export to Google Sheets or Excel.
- Repeat on AliExpress supplier pages for the same products — extract cost, shipping estimate, supplier rating, and order count.
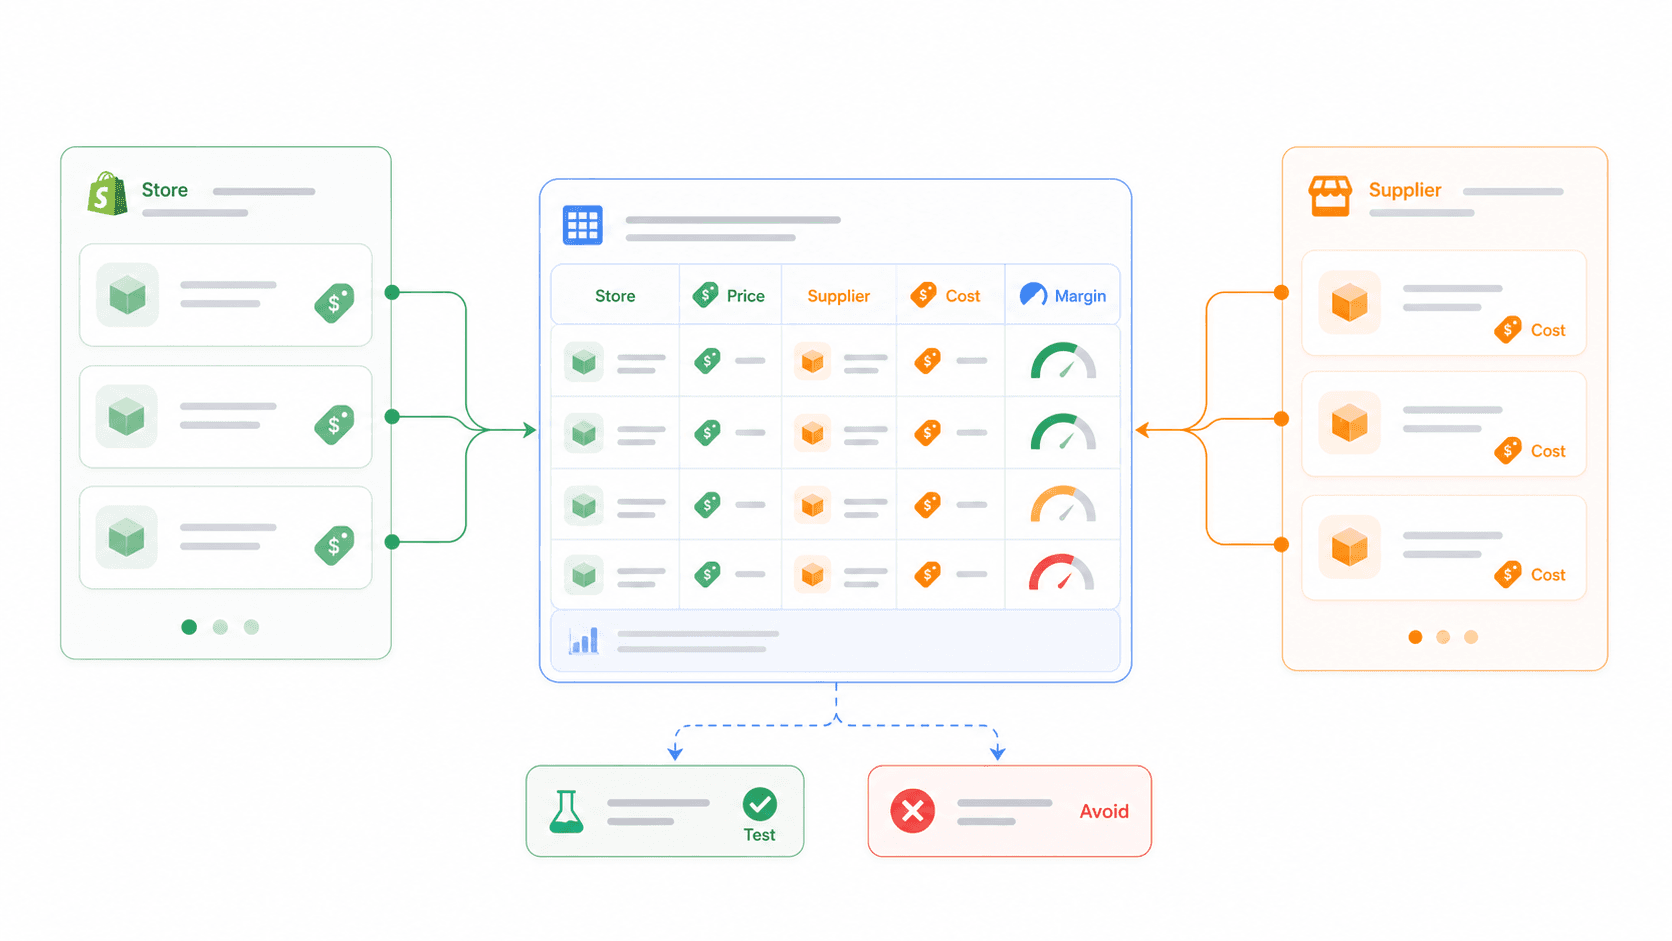
Now you have a margin comparison spreadsheet:
| Product | Competitor Price | AliExpress Cost | Est. Shipping | Landed Cost | 2.5× Landed | Gross Margin at Competitor Price | Decision |
|---|---|---|---|---|---|---|---|
| Pet hair scraper | $24.99 | $4.80 | $1.20 | $6.00 | $15.00 | 76.0% | Test |
| Electric spin scrubber | $39.99 | $11.50 | $4.00 | $15.50 | $38.75 | 61.2% | Test if shipping is acceptable |
| Neck fan | $24.99 | $9.80 | $3.50 | $13.30 | $33.25 | 46.8% | Avoid unless bundle works |
The manual alternative is painful: open 50 product pages one by one, copy prices, search suppliers, paste into a spreadsheet, clean the data. Thunderbit compresses that into about 10 minutes once your fields are set.
Pricing, Free Tier, and Export Options
Thunderbit's free tier gives you (no credit card required), with some trial flows offering 10 pages. Paid plans are credit-based — 1 credit generally equals 1 output row — starting at roughly $15/month or $9/month on an annual plan for 500 monthly credits. All exports (Excel, CSV, Google Sheets, Airtable, Notion, JSON) are free regardless of plan.
Best for: Building your own private product database from competitor stores and supplier pages, instead of relying on shared winning-product dashboards where everyone sees the same items.
For more on how works and why it matters for product research, we've written a deeper guide on the Thunderbit blog.
2. Sell The Trend: Browse Curated Winning Products with the NEXUS Engine
is a product discovery platform built specifically for dropshippers who want curated ideas without building their own scraping workflow.
What Sell The Trend Does for Product Discovery
Sell The Trend's NEXUS engine aggregates product data from AliExpress, Amazon, Shopify stores, and social platforms to surface trending items. Its lists features including NEXUS AI Product Discovery, Facebook Winning Ads Finder, Store Intelligence, Niche Spy, AliExpress Trend Explorer, Amazon Trend Explorer, CJDropshipping Trend Explorer, a Chrome extension, review import, and product push/import to Shopify. The Pro tier adds TikTok Viral Ads Finder.
Within the research workflow, Sell The Trend answers three questions: Is this product already in curated dropshipping databases? Are other Shopify stores selling it? Is there a supplier path?
Strengths and Limitations
Strengths: Beginner-friendly interface, curated lists that reduce blank-page paralysis, built-in product import to Shopify, and Store Intelligence that can reveal competitor product patterns.
Limitations: Every subscriber sees the same products — saturation risk is baked in. Export is dashboard/import-oriented, not open-ended spreadsheet research. Lite starts at $39.97/month, Essential at $49.97/month, Pro at $99.97/month.
Best for: Beginners who want a curated starting point and don't want to set up their own scraping workflows yet. Pair it with Thunderbit when you find something promising — Sell The Trend gives you the idea, Thunderbit gives you the competitor and supplier data you can analyze independently.
3. Minea: Spy on Facebook, TikTok, and Pinterest Ads to Find Proven Products
is the ad proof layer. It helps answer one specific question: "Are real advertisers already spending money to sell this product?"
What Minea Does for Winning Product Research
Minea monitors ads across Facebook, TikTok, and Pinterest. Its lists features by tier: Starter ($49/month) includes Meta/Facebook Ads Library, Daily Top 10 Products, tracking lists, AliExpress supplier finder, AI Magic Search, and AI Creative Finder. Premium ($99/month) adds TikTok Ads Library, Pinterest Ads Library, Shopify trending shops, and sales/traffic/active ads insights. Business ($399/month) adds Success Radar with trending products refreshed every 8 hours.
You can filter by engagement, ad duration (longer-running ads suggest profitability), product category, country, and advertiser. Longer-running ads aren't proof of profit, but they're a better signal than a one-day viral spike.
Strengths and Limitations
Strengths: Multi-platform ad tracking. Engagement and ad-duration signals help gauge demand. Useful for finding product angles and creative patterns. Good validation layer after Google Trends or Exploding Topics.
Limitations: Shows products already being advertised — you're not early. Free access is limited to a trial with 200 credits. Dashboard-centric workflow. TikTok and Pinterest intelligence require the $99/month Premium plan.
Best for: Validating that a product can be marketed successfully. The strongest pairing: Minea finds the ad-proven product → Thunderbit scrapes the store selling it for price/margin data → Google Trends checks whether demand is still rising.
4. Google Trends: Validate Demand Trajectory for Free
is the free, essential demand-validation step. It won't tell you supplier cost or margin, but it will show whether interest is rising, stable, seasonal, or declining — and that single data point can save you from testing a product whose wave has already passed.
How to Use Google Trends for Shopify Dropshipping Product Research
Search the candidate product keyword. Set the time frame to 12 months, then expand to 5 years for context. You can and .
What to look for:
- Rising over 6+ months: Strong test candidate.
- Spike then crash: Avoid unless it's seasonal and you're early enough for the next peak.
- Flat and stable: Evergreen, but you'll need differentiation.
- Declining: Move on.
Check geographic breakdown to align with your target market. A product trending in the US but flat in Europe tells you where to focus ads.
Distinguishing "Saturated and Declining" from "Saturated and Still Growing"
This distinction is critical and almost no one talks about it. Here's the decision logic:
| Trend Shape | Competitor Volume | Interpretation |
|---|---|---|
| Rising | High | Saturated but still growing — compete only with a clear angle |
| Rising | Low/medium | Strong test candidate |
| Flat | High | Evergreen but crowded — needs differentiation |
| Declining | High | Avoid unless you have a unique channel |
| Spike then crash | Any | Usually avoid |
Strengths: Completely free, reliable Google search data, great for seasonality and geographic targeting.
Limitations: Shows relative interest (not absolute volume), no product-specific data (prices, margins), export limited to CSV.
5. TikTok Creative Center: Spot Viral Products Gaining Social Traction
is a free window into what's working creatively on the platform where many consumers first discover products.
How to Use TikTok Creative Center for Dropshipping Research
TikTok's documentation says the Trends section lets you then view trendlines, related videos, audience insights, regional popularity, and related hashtags. For product research:
- Open Creative Center → Inspiration → Top Ads.
- Filter by region, industry (e.g., "Home & Garden," "Beauty & Personal Care"), and objective.
- Search product terms or category terms.
- Review engagement moments and hooks — what makes people stop scrolling?
- Switch to Trends → Hashtags for broader category signals.
- Save creative patterns, not just product names.
You're looking for proof that the product has a scroll-stop angle: problem/solution, transformation, demo, unboxing, comparison, or reaction.
Strengths: Free, direct view into TikTok-native creative patterns, real ad performance data, good for early social buzz.
Limitations: TikTok-only (no cross-platform view), manual browsing (no bulk export), data is biased toward TikTok's audience demographics.
Best for: Validating viral potential and checking what ad creatives work. Pair it with Google Trends — TikTok shows social buzz, Google Trends confirms sustained search demand.
6. Exploding Topics: Find Winning Products Before They Saturate
is the early-signal tool in this stack. It's useful before a product even reaches ad spy tools or curated dropshipping lists.
How Exploding Topics Works for Product Discovery
Exploding Topics through online sources and analyst review, then adds topics with business relevance and long-term potential to its database. Trends must show compounding search-volume growth over several months before qualifying.
Search categories like pets, beauty, home, fitness, kitchen, or ecommerce. Look for product-like trends — "AI pet camera" is more actionable than "pet tech." The free version gives you limited browsing and a newsletter. The paid , with Investor at $99/month and Business at $249/month.
Strengths: Finds categories and products before they appear everywhere. Data-driven, not opinion-based. Free browsing/newsletter for lightweight research.
Limitations: Doesn't tell you whether the product is easy to source. Doesn't calculate margins. Doesn't prove ad-testability. CSV export is available only on higher tiers.
Best for: Dropshippers who want first-mover advantage. Ideal as the first step in the workflow: Exploding Topics finds early signal → Google Trends validates → Thunderbit scrapes competitor data.
Patterns Across These 6 Tools
A few patterns jumped out while testing all six:
- No single tool does everything. Exploding Topics catches early signals but can't check margins. Minea proves ad viability but can't scrape supplier costs. Google Trends validates demand but gives you zero product-level data. The value is in the combination.
- Free tools cover more than you'd expect. Google Trends, TikTok Creative Center, and Thunderbit's free tier can handle a surprising amount of research at zero cost.
- The paid tools overlap more than they differentiate. Sell The Trend and Minea both surface trending products — but Sell The Trend focuses on curated databases while Minea focuses on live ad data. Pick based on whether you want ideas or proof.
Side-by-Side Comparison: 6 Shopify Dropshipping Product Research Tools
| Tool | Best Pipeline Role | Starting Price | Free Tier | Export / Data Portability | Main Limitation |
|---|---|---|---|---|---|
| Exploding Topics | Early signal | Free; paid from $39/mo yearly | Free browsing/newsletter | CSV on higher tiers | Doesn't prove sourcing or profitability |
| TikTok Creative Center | Social traction / creative signal | Free | Free | Manual save/browse | TikTok-only and manual |
| Google Trends | Demand validation | Free | Free | CSV export | Relative interest, not exact volume |
| Minea | Ad proof | $49/mo | Trial / first 200 credits | Dashboard-centric | You see what others can see |
| Sell The Trend | Curated product discovery | $39.97/mo | Trial flow | Product import/dashboard | Shared product pool |
| Thunderbit | Competitor + supplier data | Free; paid from ~$15/mo | 6 pages/mo | Excel, CSV, Sheets, Airtable, Notion, JSON | You choose the sites and analysis logic |
The Winning Product Research Workflow: How to Chain These 6 Tools Together
This is the repeatable system — run it weekly, or anytime a new product idea catches your eye. Once your spreadsheet template is ready, the full workflow takes under 30 minutes per product idea.
Step 1: Catch Early Signals (Exploding Topics + TikTok Creative Center)
Start with Exploding Topics. Browse product-like trends in your target categories. Then cross-check with TikTok Creative Center — are hashtags, ads, or creative patterns forming around the same product?
Time estimate: 5–7 minutes per product idea.
Step 2: Validate Demand (Google Trends)
Plug the product keyword into Google Trends. Check the 12-month and 5-year views. Avoid spike-and-crash curves unless the product is seasonal and you're early enough for the next peak. Check geographic demand to align with your target market.
Time estimate: 2–3 minutes.
Step 3: Check Ad Proof (Minea or Sell The Trend)
Use Minea to see if advertisers are actively running ads. Look for duration, engagement, and multiple creative variants. Or use Sell The Trend's NEXUS engine and Store Intelligence to confirm the product appears in curated dropshipping datasets.
Time estimate: 5–10 minutes.
Step 4: Scrape Competitor Data and Calculate Margins (Thunderbit)
Use Thunderbit to scrape competitor Shopify stores selling this product — extract prices, reviews, variants, stock status. Scrape AliExpress supplier pages for landed cost data. Calculate margin: if you can't sell at 2.5× landed cost, move on.
Time estimate: 10 minutes once fields are set.
Step 5: Apply the 5-Point Validation Checklist
Score the product:
| Criterion | Pass? |
|---|---|
| Scroll-stop factor | Yes / No |
| Demand trajectory (6+ months rising) | Yes / No |
| 2.5× landed cost possible | Yes / No |
| 15-second ad demo possible | Yes / No |
| Not easily available locally | Yes / No |
If it passes 4 out of 5, it's worth a small ad test. Fewer than 4? Save the research and move on before you waste money.
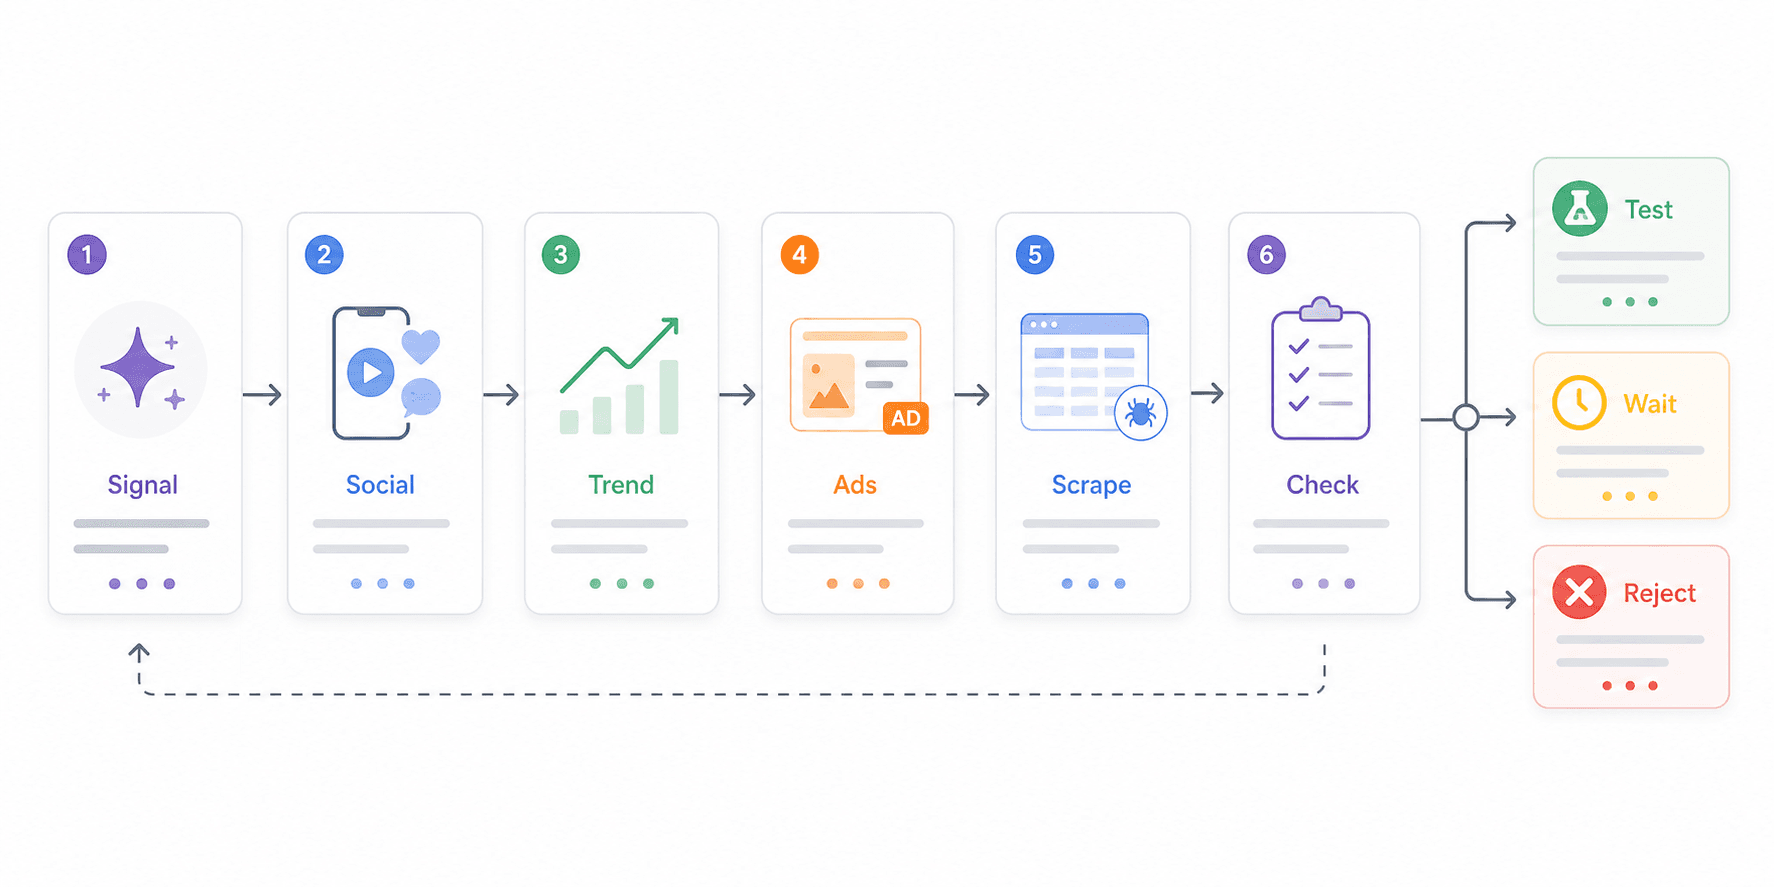
Here's the visual flow:
1Early Signal (Exploding Topics + TikTok Creative Center)
2        ↓
3Demand Validation (Google Trends)
4        ↓
5Ad Proof (Minea / Sell The Trend)
6        ↓
7Competitor + Supplier Scrape (Thunderbit)
8        ↓
95-Point Checklist → Test / Wait / Reject
Dropshipping Margin Benchmarks by Category (With Real Numbers)
These are representative margin ranges — not guarantees. Actual numbers depend on supplier, shipping method, ad cost, refund rate, and bundle strategy. Use the table as a starting hypothesis, then verify live numbers yourself.
| Category | Typical AliExpress Cost | Common Selling Price | Est. Gross Margin | Margin Notes |
|---|---|---|---|---|
| Pet accessories | $3–$12 | $19.99–$39.99 | 55%–80% | Strong problem/solution products; review volume matters |
| Beauty tools | $5–$18 | $24.99–$59.99 | 45%–75% | Watch ad policy claims and before/after promises |
| Kitchen gadgets | $4–$15 | $19.99–$49.99 | 50%–75% | Good demo potential; high local availability risk |
| Baby products | $6–$20 | $24.99–$59.99 | 40%–70% | Avoid safety-risk products and regulated claims |
| Phone accessories | $1–$8 | $9.99–$29.99 | 45%–80% | Very saturated; needs design, brand, or bundle angle |
| Home décor | $5–$25 | $24.99–$79.99 | 40%–70% | Shipping damage and dimensions can hurt margins |
that experienced dropshippers commonly land around 15%–20% net margin, while beginners often run below 10%. That's why I prefer products that show 40%+ net margin in the spreadsheet before ads fully normalize — real ad costs always compress the math.
How to Verify These Numbers Yourself
Use Thunderbit to scrape AliExpress supplier pages for current cost data on any product. Then scrape competitor Shopify stores for actual selling prices. Calculate:
1Landed cost = product cost + shipping + estimated payment/fulfillment cost
2Gross margin = (selling price – landed cost) / selling price
3Breakeven CPA = selling price – landed cost – payment fees – returns buffer
This turns a static reference table into a repeatable process you can run on any product, any week. For more on , we've covered the basics on our blog.
Does Product Saturation Actually Kill Dropshipping Profits? (Myth vs. Reality)
Saturation anxiety drives most beginners to niche-hop endlessly — and it's mostly misplaced.
Why Saturation Signals Proven Demand
In a , one commenter put it clearly: "I don't really think 'saturated' means dead, if anything it usually means there's proven demand." Another said: "Saturated just means lazy marketing is dead."
Experienced dropshippers keep saying it: don't look for exclusivity, look for products with massive demand. The real differentiator is marketing execution — creative quality, ad targeting, landing page conversion, offer structure — not product novelty alone. Phone cases, pet accessories, reusable bottles, kitchen tools, and beauty accessories are all "saturated" categories that continue to produce profitable stores.
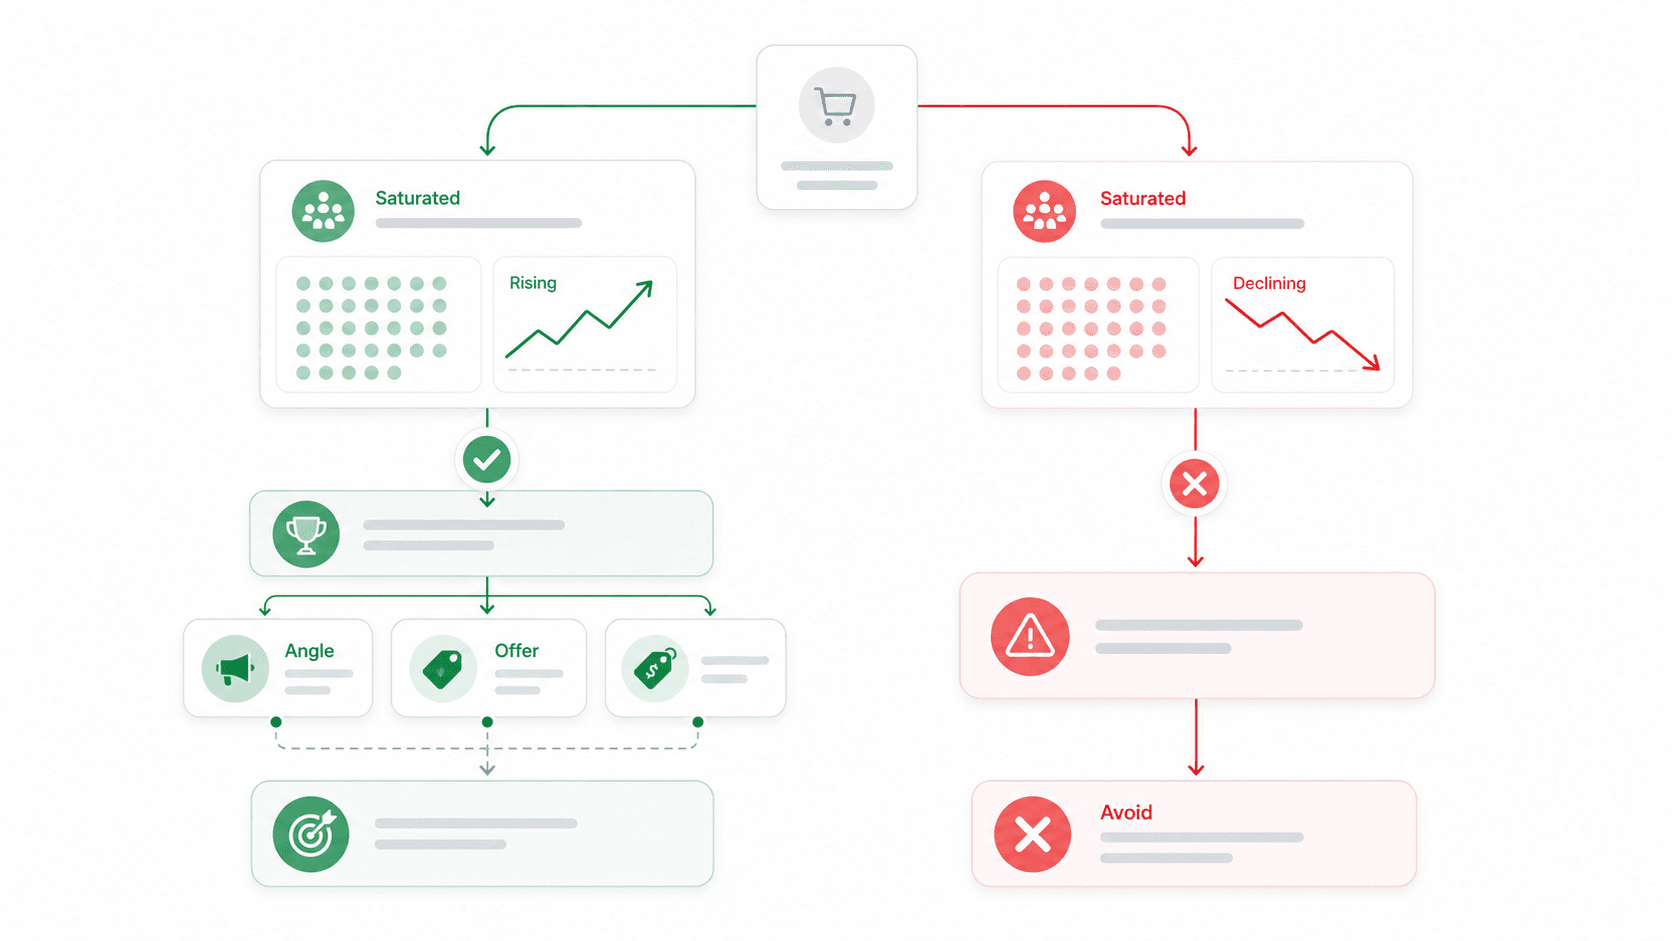
How to Tell "Saturated and Declining" from "Saturated and Still Growing"
Use Google Trends to check whether the product's search interest is still rising or has peaked and is falling.
- Rising + saturated = opportunity. Compete on better ads, better store experience, better price, or a sharper audience.
- Declining + saturated = avoid. The wave has passed.
Using the Tools to Make Data-Driven Decisions (Not Fear-Based Ones)
Use Sell The Trend or Exploding Topics to spot rising products. Validate growth trajectory with Google Trends. Use Thunderbit to scrape how many competitors are actively selling it, at what price points, and with how many reviews. Use Minea to check whether ads are still running or have stopped.
Make a decision based on data, not panic. That directly counters the niche-hopping behavior that kills beginner stores — four separate mention store owners abandoning products after two days because they "felt" saturated, without ever checking the actual numbers.
How to Choose the Right Tool for Your Situation
Quick decision guide:
- Just starting out, zero budget? Begin with Google Trends + TikTok Creative Center + Thunderbit free tier. You can validate demand, check creative patterns, and scrape competitor data without spending a dollar.
- Want curated product ideas without building workflows? Sell The Trend's Lite plan ($39.97/month) gives you a browsable database and product import to Shopify.
- Need ad proof before testing? Minea ($49/month Starter) shows you what real advertisers are spending money on across Meta, TikTok, and Pinterest.
- Want first-mover advantage on trends? Exploding Topics Pro ($39/month) surfaces products before they hit ad spy tools.
- Need competitor and supplier data in a spreadsheet? Thunderbit's paid plans (from ~$15/month) let you scrape any site and export to Excel, Sheets, Airtable, or Notion.
- Want the full pipeline? Combine all six. The free tools cover 60% of the workflow. Add paid tools where they save you the most time.
For more on how AI tools are changing research, we've covered the broader landscape on the Thunderbit blog.
Thunderbit Deep Dive: Why Competitive Intelligence Is the Missing Layer
Most product research tools focus on what's trending. Very few help you answer the harder question: "What are my competitors actually charging, and can I beat them on margin?"
That's the gap Thunderbit fills. When you find a promising product through Exploding Topics, validate it on Google Trends, and confirm ad proof on Minea, the next step is cold, hard numbers. Thunderbit lets you:
- Scrape any competitor's Shopify collection page — not just stores in a pre-built database, but any store you find.
- Enrich product data with Subpage Scraping — visit each product page to pull review counts, stock status, full descriptions, and variant details.
- Scrape AliExpress supplier pages for real cost, shipping, and order volume data.
- Export everything to Google Sheets, Excel, Airtable, or Notion for analysis.
- Re-run the same scrape weekly to track price changes, new products, and inventory shifts.
The concrete example: scrape the top 50 products from a competitor's "Best Sellers" collection, compare their price points to AliExpress costs, and identify 5 products with ≥50% margin potential — all in under 10 minutes. That's competitive intelligence no ad spy tool provides.
If you want to see this in action, check out our for walkthrough videos, or explore the we've compared on our blog.
Conclusion: Build a Repeatable System, Not a One-Time Product List
Winning products aren't found in a static list. They're discovered through a repeatable research workflow you can run every single week.
Use Exploding Topics for early signals. Use TikTok Creative Center for social traction and scroll-stop patterns. Use Google Trends to validate demand trajectory. Use Minea and Sell The Trend for ad proof and curated product intelligence. Use Thunderbit to scrape competitor Shopify stores and AliExpress supplier pages so you can calculate real margins instead of guessing.
Then apply the 5-point checklist: scroll-stop factor, demand trajectory, margin headroom, ad-testability, and low local availability. If a product passes 4 out of 5, test it with a small budget. If it fails, move on before you waste money.
Start with the free tools — Google Trends, TikTok Creative Center, and . Once your process is consistent, add paid tools where they save time. And if you want to turn competitor Shopify stores and supplier listings into a product research spreadsheet today, give a try — scrape the data in minutes instead of copying it page by page.
FAQs
1. What is a "winning product" in Shopify dropshipping?
A winning product has strong consumer demand, healthy profit margins (typically 40%+ gross), visual appeal for social ads, and a rising or stable trend trajectory. It should be easy to explain in a short video, easy to ship, and hard enough to compare locally that your store can still earn margin after ad costs.
2. Can I find winning dropshipping products for free?
Yes. Google Trends, TikTok Creative Center, and Thunderbit's free tier (6 pages/month) all allow meaningful product research at zero cost. Paid tools like Sell The Trend, Minea, and Exploding Topics Pro offer deeper dashboards and save time, but the free tools cover a surprising amount of the workflow.
3. How often should I research new products for my Shopify store?
Weekly or bi-weekly. Trends move quickly in dropshipping — a product can go from rising to saturated in weeks. A good weekly target is 20 raw ideas, 5 serious candidates, and 1–2 products worth deeper validation using the 5-point checklist.
4. Is it better to sell trending products or evergreen products?
Both can work. Trending products can produce fast revenue spikes, while evergreen products create steadier baseline demand. The best stores maintain a mix — an evergreen category focus plus regular trend-aware product testing to capture new opportunities.
5. Does product saturation mean I should avoid a product?
Not necessarily. Saturation often signals proven demand. The key distinction is whether the product's search interest is still rising (opportunity) or declining (avoid). Use Google Trends to check the trajectory, and use Thunderbit to scrape competitor price points and review counts — then make a data-informed decision rather than a fear-based one.
Learn More