
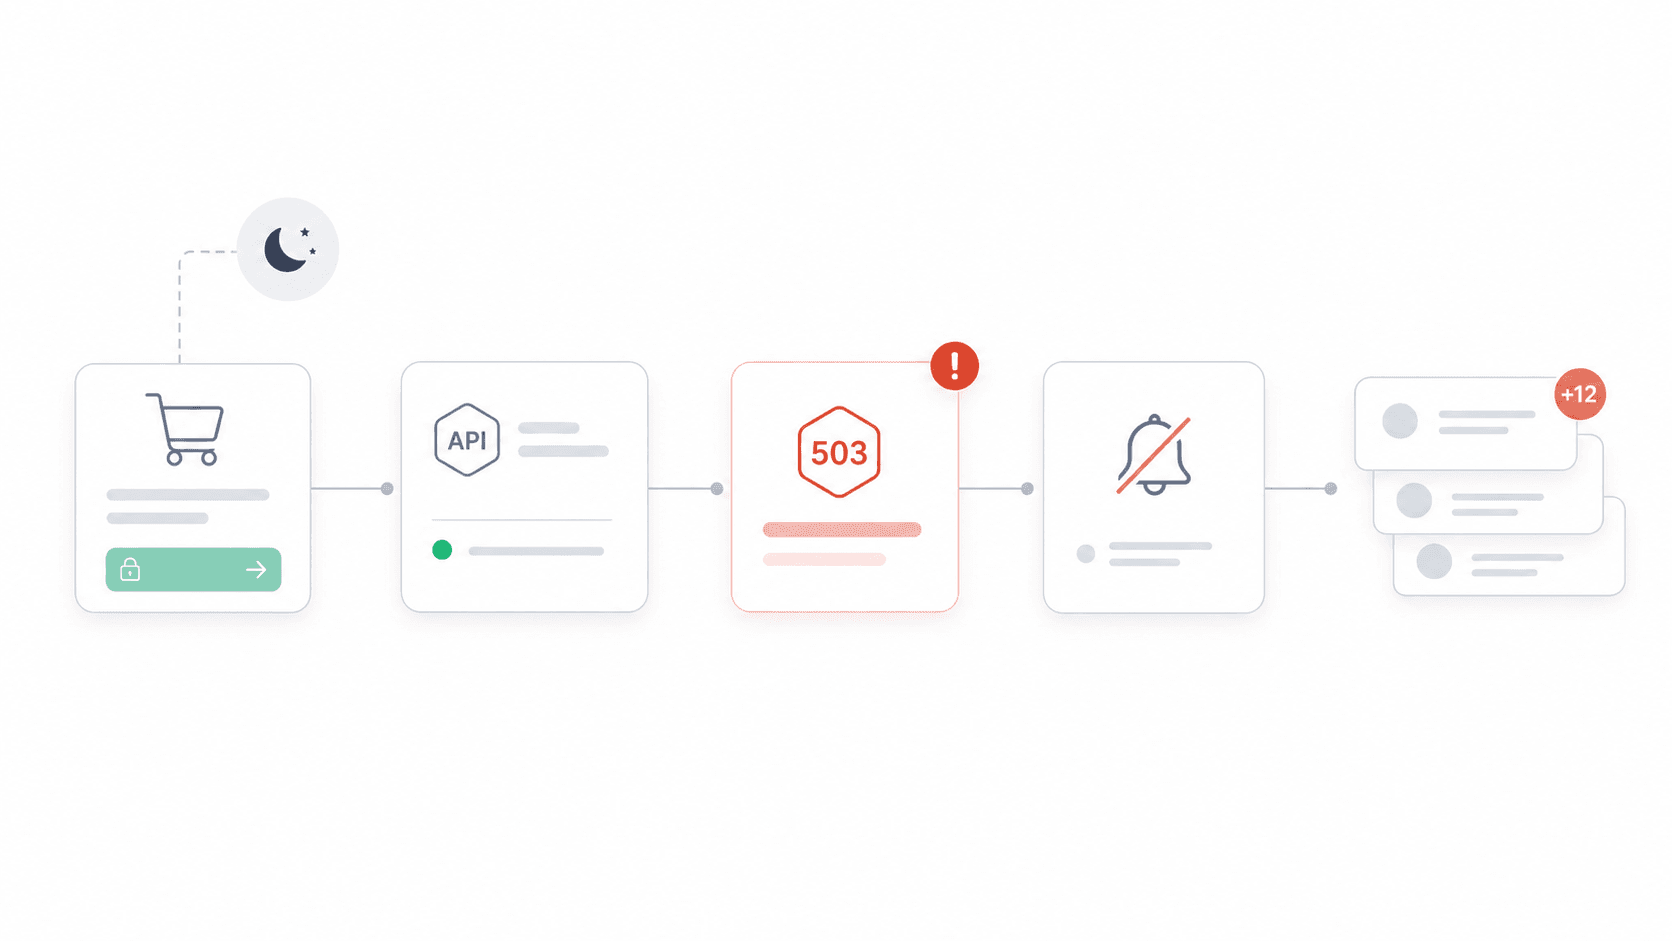
Last month, a friend's Stripe integration silently started returning 503s at 11 PM on a Friday. Nobody noticed until Saturday morning — when the support inbox had 200+ angry emails from customers whose checkouts failed.
That story isn't unusual. A puts average downtime at $5,600 per minute, while . The real number depends on traffic, conversion rate, order value, SLA exposure, and recovery cost — but the directional truth is clear: unmonitored APIs are a business risk, not just an engineering annoyance. And with and , monitoring isn't optional anymore. What I wanted to do with this guide is something I haven't seen elsewhere: organize tools by your use case, evaluate alert quality (not just alert existence), show real 2026 pricing, and measure how fast you can actually get running. Not just another flat list of logos.
One more thing: if your API work involves collecting web data, feeding LLMs, building RAG systems, monitoring competitor pages, or extracting pricing/product data from websites, the "API tool" conversation should not stop at uptime monitoring. You also need a reliable way to turn messy web pages into structured data. That's where fits into this guide: it is not an uptime monitor, but it is one of the fastest ways to turn websites into clean Markdown or schema-based JSON through an API.
What Is API Monitoring (and Why Should Your Team Care)?
API monitoring means continuously checking that your API endpoints are available, fast, and returning the right data. Not just "is the server up?" — a good monitor validates HTTP status codes, response payloads, latency, SSL certificates, multi-step workflows (like login → search → checkout), and even schema correctness.
It's different from general website monitoring (which checks if a page loads) and from APM (Application Performance Monitoring), which digs into code-level traces, database queries, and runtime internals. API monitoring sits at the boundary: it tests what your users, partners, and integrations actually experience when they call your endpoints.
There's also a related category worth calling out: web data APIs. These don't monitor whether your own API is healthy; they help your product or workflow reliably collect external web data. For example, can distill a web page into clean Markdown, extract structured fields as JSON, and run batch jobs across many URLs. If your "API" project depends on fresh vendor data, product pages, public listings, documentation pages, or research sources, that kind of data extraction API can be just as operationally important as uptime checks.
Why should non-engineers care? Because and . When a payment gateway, auth service, or shipping API fails, it's not an abstract infrastructure problem — it's lost revenue, broken partner contracts, support spikes, and eroded trust. Product managers, sales, ops, and customer success teams all have skin in this game.
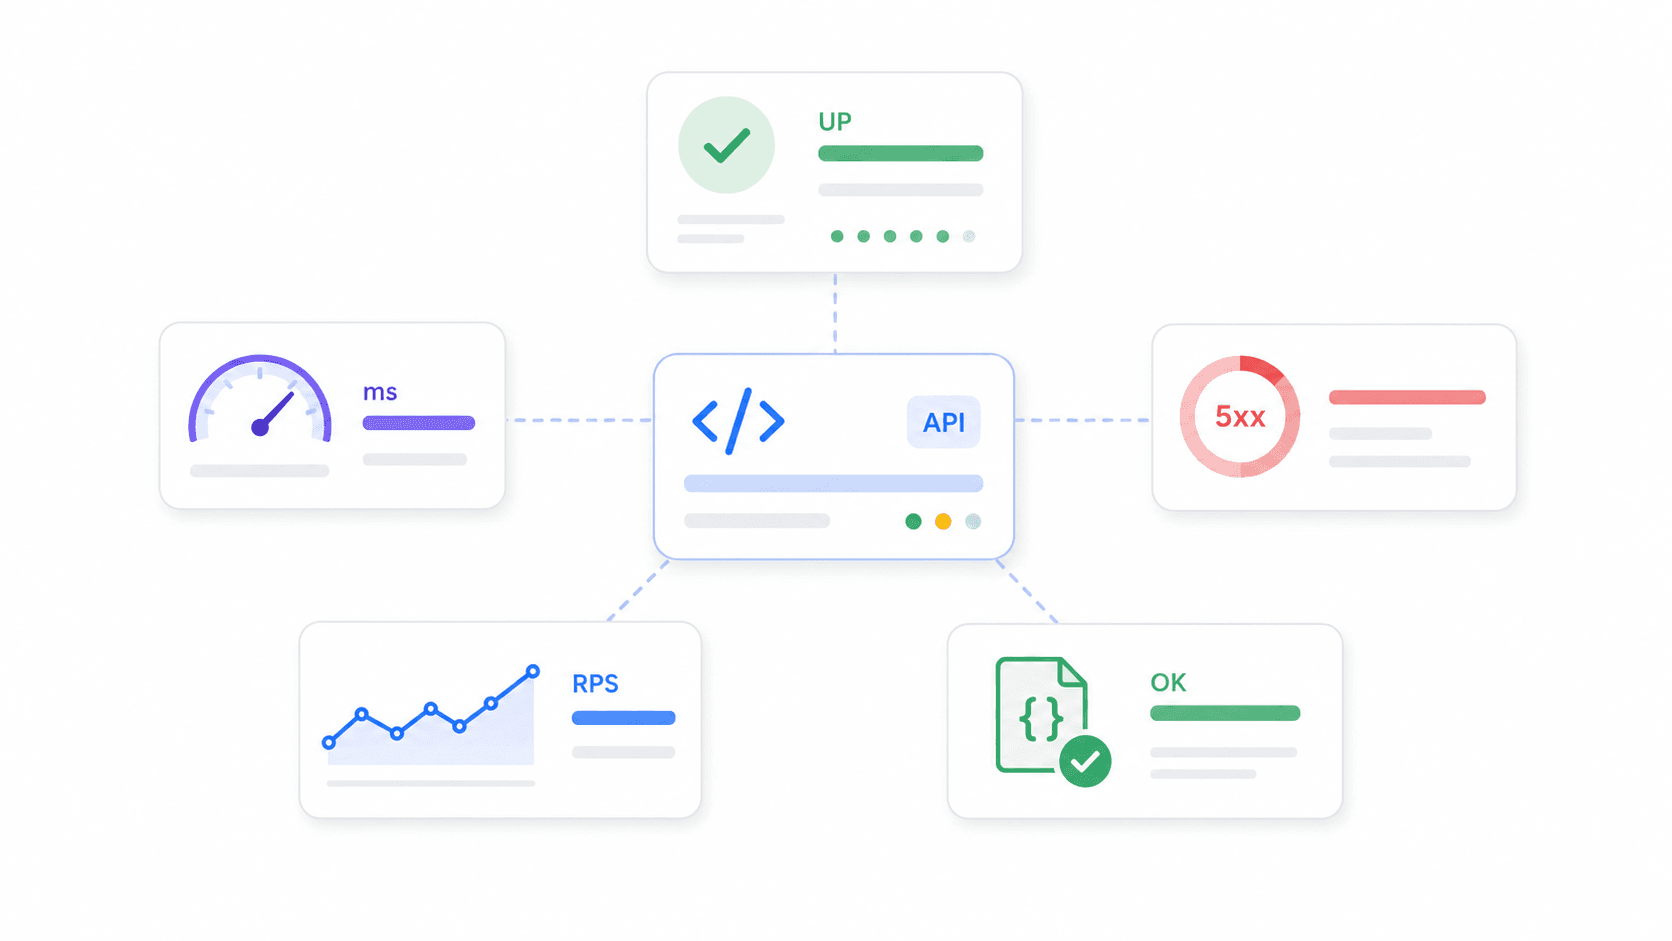
Key metrics to watch:
- Uptime percentage: share of time an endpoint is available
- Response time / latency: how long the endpoint takes to respond (average, p95, p99)
- Error rate: share of requests returning 5xx, timeouts, or assertion failures
- Throughput: requests per second/minute
- Correctness: whether the API returns expected data, not just a 200 OK
How We Evaluated the Best API Monitoring Tools for 2026
Most "best API monitoring tools" articles just stack vendor names and features. I wanted to be more deliberate about selection criteria — partly because I spent a lot of time reading developer forums, and partly because the Thunderbit team helped me from vendor sites to build a real comparison (more on that workflow later).
Here's what we weighted:
| Criterion | Why It Matters |
|---|---|
| Ease of setup / time-to-first-alert | Small teams need coverage today, not after a platform project |
| Alert intelligence & noise reduction | If alerts are noisy, teams ignore them and miss real incidents |
| Free tier generosity | Side projects and early startups often start free |
| Pricing transparency | Observability bills can balloon through hosts, seats, logs, synthetic runs, and data ingest |
| Integration breadth | Alerts need to land where teams already work (Slack, PagerDuty, etc.) |
| Scalability & data depth | Mature teams need traces, logs, APM, RBAC, SSO, retention |
| Community & support quality | Open-source teams need release cadence; enterprise teams need SLAs |
| Web data extraction ability | AI apps, RAG workflows, and market research tools often need clean external data, not just endpoint uptime |
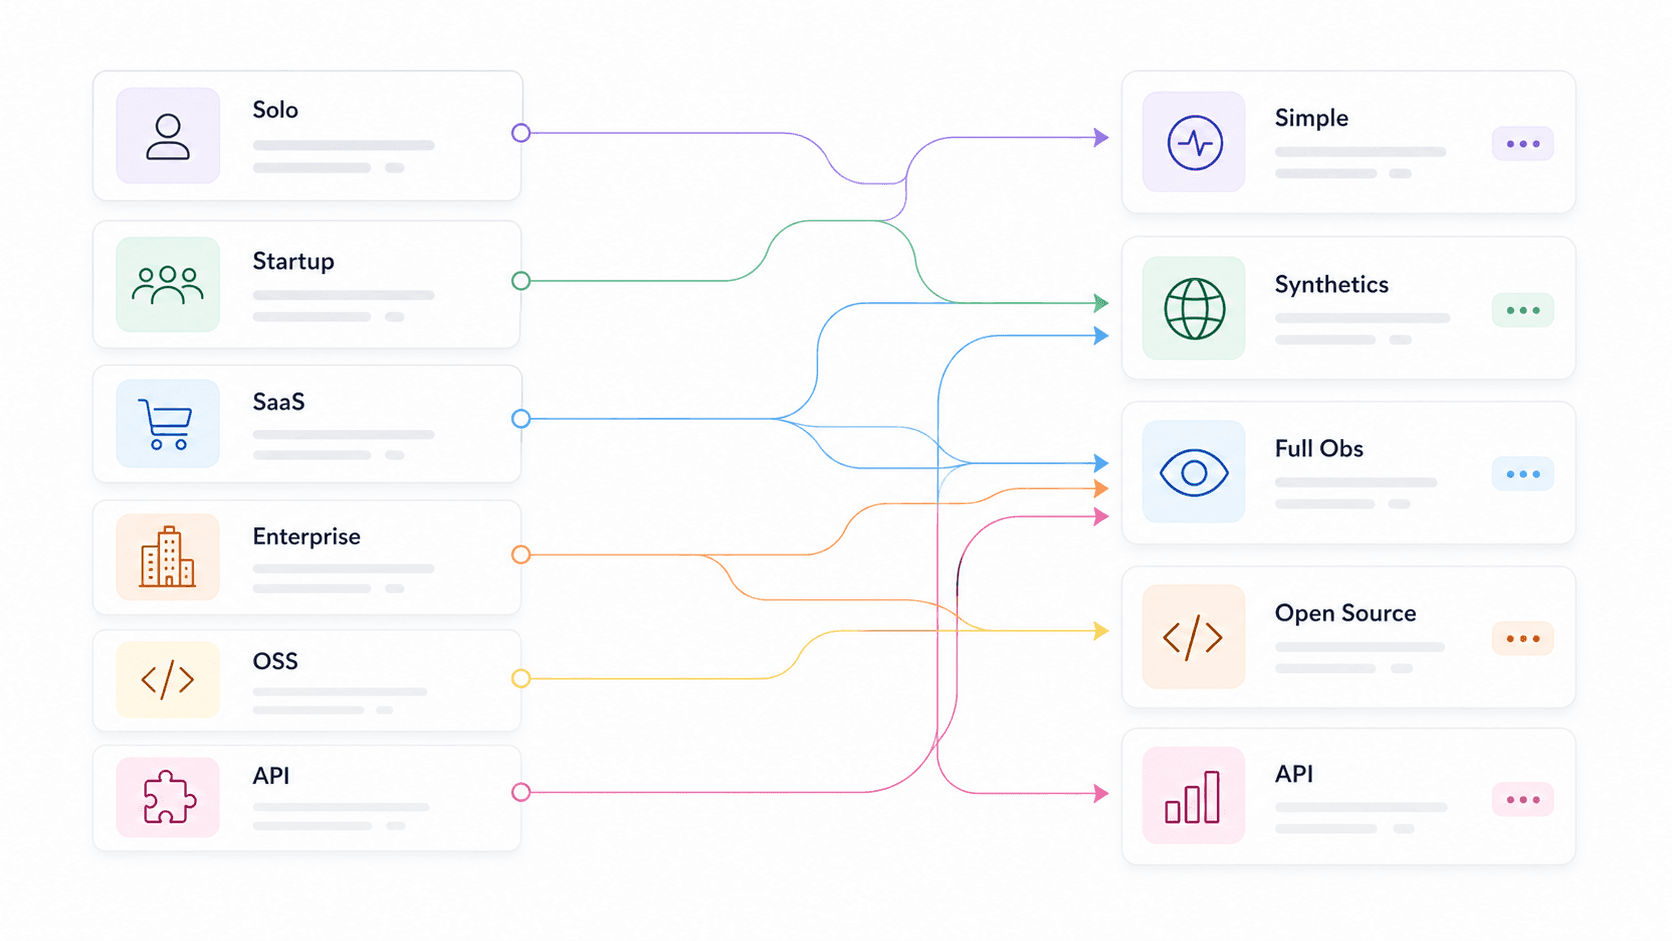
We also segmented recommendations by use case — solo dev, startup, e-commerce/SaaS, enterprise, open-source purist, API product team, and web data/AI app team — so you can skip to your context instead of reading 14 tool summaries hoping to guess which one applies. found and as selection criteria, which confirms that these aren't just nice-to-haves.
Best API Monitoring Tools by Use Case: The Quick-Pick Table
This is the shortcut. Find your row, then jump to the tool sections below for the full breakdown.
| Use Case | Recommended Tools | Key Differentiator |
|---|---|---|
| Web data / AI app teams | Thunderbit Open API, Moesif, Apitally | Turn websites into clean Markdown or structured JSON for LLMs, RAG, pricing, and research workflows |
| Solo dev / side project | UptimeRobot, Uptime Kuma, Gatus | Free or self-hosted, minimal config, fast setup |
| Startup (5–15 person team) | Checkly, Better Stack, Postman | Smart alerting, fast setup, affordable, status pages |
| E-commerce / SaaS | Datadog, New Relic, Moesif, Checkly | Business metrics, APM/tracing, SDK depth, multi-step synthetics |
| Enterprise / multi-cloud | Datadog, New Relic, Splunk, Grafana Cloud | Distributed tracing, compliance, hybrid, RBAC/SSO |
| Open-source purists | Prometheus + Grafana, Uptime Kuma, Gatus, Uptrace | Full control, OTel native, no vendor lock-in |
| API product teams | Moesif, Apitally, New Relic | Per-customer usage, endpoint trends, anomaly alerts |
The biggest pattern: the fastest-to-setup tools tend to be lighter on analytics, while the deepest platforms take more configuration and cost discipline. That's not a flaw — it's a tradeoff to be aware of. Thunderbit sits in a slightly different lane: it is fastest when the job is turning web pages into API-ready data, not paging engineers about downtime.
Thunderbit Open API: Best for Turning Websites into Structured API Data
is the API I would put first for teams whose "monitoring" or research workflow depends on external web data. It is not a traditional uptime monitoring tool like Checkly or UptimeRobot. Instead, Thunderbit turns any web page into clean, structured data your apps, agents, dashboards, and LLM pipelines can actually use.
The API has three core workflows. Distill converts a page into clean, LLM-ready Markdown. Extract takes a schema and returns structured JSON fields such as product name, price, availability, company size, funding stage, or review rating. Batch lets you process up to 100 URLs asynchronously with webhooks, which is useful when you are monitoring pricing pages, competitor catalogs, vendor documentation, news sources, or large research lists.
The reason it belongs in an API tools guide is that teams often underestimate how much infrastructure "just scrape this page" requires. JavaScript-heavy sites need rendering. Some pages need geo-routing. HTML needs to be stripped of nav bars, ads, modals, and boilerplate before it is useful to an LLM. Selectors break when layouts change. Proxy rotation, anti-bot handling, retries, queues, and result polling can turn a small data workflow into a maintenance project. Thunderbit absorbs much of that work behind one API.
Best for: AI app builders, RAG teams, e-commerce ops, sales ops, growth teams, market researchers, and developers who need website data through an API without building and babysitting a scraping stack.
Pricing: , including up to 600 Distill pages or 30 Extract pages, with 2 concurrent requests. Starter is listed at $16/month annually for 60,000 API units/year and 30 concurrent requests. Pro is listed at $40/month annually for 600,000 API units/year and 50 concurrent requests.
Setup speed: ~5–15 minutes to get an API key and run a first Distill or Extract request with cURL, SDKs, or the .
Downsides: Thunderbit won't replace Datadog, New Relic, Better Stack, or Checkly for uptime checks, incident escalation, traces, logs, or on-call routing. Think of it as the API you use to collect and structure web data — including vendor pricing, docs, competitor pages, product listings, or public datasets — not the system that pages your on-call engineer.
Datadog: Best for Full-Stack Visibility
Datadog is the tool I keep seeing in enterprise and mid-market SaaS stacks, and for good reason. It's not just API monitoring — it's a full observability platform that connects synthetic API tests to distributed traces, logs, infrastructure metrics, and real user monitoring in a single view.
For API monitoring specifically, Datadog supports HTTP, SSL, DNS, WebSocket, TCP, UDP, ICMP, gRPC, and . Its learn expected patterns and alert on deviations rather than static thresholds — which is a meaningful step up from "alert when latency > 500ms." It also offers that predict when a metric will breach a threshold, plus composite monitors that combine multiple conditions.
Best for: E-commerce, SaaS, and enterprise teams that need one pane of glass across APIs, infrastructure, logs, and traces.
Pricing: Free tier details vary by product. ; API synthetic tests at $5 per 10,000 runs. 800+ integrations.
Setup speed: ~15–30 minutes for agent install plus a basic synthetic test.
Downsides: Can get expensive at scale — "bill shock" is a recurring theme on Hacker News and Reddit. The sheer number of SKUs (hosts, logs, custom metrics, synthetics, users) means you need someone watching the bill, not just the dashboards. Learning curve is real for the full platform.
Checkly: Best for Developer-First Synthetic Checks
Checkly is the tool I'd hand to a startup engineering team that wants API checks living near their code. Its core idea is "monitoring as code": define API and browser checks programmatically, run them from global locations, integrate with CI/CD pipelines, and manage everything through Git.
The alert quality angle is strong here. Checkly's is explicitly framed as the "first line of defense" against false positives — you can configure fixed, linear, or exponential retries, same-location or different-location retries, and max retry durations before an alert fires. It also distinguishes between degraded, failed, and recovered states, which helps reduce noisy pages.
Best for: Startups and dev teams that want programmable API checks, , CI/CD integration, and fast setup.
Pricing: Recent public data shows a free plan with 10 uptime monitors, 1,000 browser checks, and 10,000 API checks. Starter around $24/month annually — before buying.
Setup speed: ~10–20 minutes for a first API check and alert channel.
Downsides: Focused on synthetic checks. Not a replacement for deep APM, log analytics, or distributed tracing. If you need to correlate an API failure with a database bottleneck, you'll need another tool alongside it.
UptimeRobot: Best for Simple, Affordable Uptime Tracking
UptimeRobot is the Honda Civic of API monitoring. It does one thing well: you create an HTTP, keyword, ping, port, SSL, or heartbeat monitor, pick an interval, and get alerted when it fails. That's it.
Best for: Solo devs, small teams, agencies, or anyone needing basic uptime and latency tracking without complexity.
Pricing: . Paid Solo around $7/month annually. No credit card required for free. Setup speed: ~2–5 minutes — fastest on this list.
Downsides: Limited alert intelligence. Basic threshold alerts, no anomaly detection, no distributed tracing, no deep analytics. If you need to know why an endpoint is slow (not just that it's slow), UptimeRobot won't get you there.
Uptime Kuma: Best Free, Self-Hosted API Monitoring Tool
Uptime Kuma is the darling of the self-hosting community, and the GitHub numbers back it up: , and release 2.3.2 as of May 2026. It's MIT-licensed, supports HTTP(s), keyword, JSON query, WebSocket, TCP, ping, DNS, push, Docker, multiple status pages, and 90+ notification services.
Best for: Solo devs and teams who want full control, privacy, and zero recurring SaaS cost — if you have a server.
Pricing: Free. The real cost is your VM/container, backups, updates, and making sure the monitor itself stays up. Setup speed: ~5–15 minutes with Docker for a basic check; 15–30 minutes with notification and status-page polish.
Downsides: You own maintenance. And here's the critical gotcha: if you host Uptime Kuma on the same infrastructure it's monitoring, a cloud or DNS outage takes down both your app and your monitor. Host it externally or pair it with a SaaS check.
Better Stack: Best for Fast Incident Response
Better Stack (often still called Better Uptime by users) combines uptime monitoring with incident management, on-call scheduling, escalation policies, and status pages in one platform. It's strongest not as an analytics tool, but as an incident workflow tool wrapped around monitoring.
define who gets alerted, in what order, with what delays, until acknowledgment. Metadata-based routing sends incidents by severity or ownership. It integrates with Slack, Teams, webhooks, and Zapier.
Best for: Startups and mid-size teams that want monitoring + incident response + status pages without stitching together three separate tools.
Pricing: . Team around $29/month annually. Setup speed: ~5–10 minutes via GUI wizard.
Downsides: Less depth in API payload analytics, distributed tracing, or business KPI analysis compared to Datadog, New Relic, or Moesif.
Prometheus + Grafana: Best Open-Source API Monitoring Stack
This is the industry-standard open-source combo. scrapes and stores time-series metrics. (73,705 GitHub stars, 3,010 contributors) provides dashboards and alerting. handles routing, grouping, deduplication, silencing, and inhibition. For API endpoint checks, teams add for HTTP, HTTPS, DNS, TCP, ICMP, and gRPC probing.
Best for: Open-source purists, Kubernetes/SRE teams, and organizations already standardized on Prometheus metrics.
Pricing: Free self-hosted. has a free tier (100k API test executions/month) and usage-based paid plans.
Setup speed: 1–4 hours for basic Blackbox + Prometheus + Grafana + Alertmanager. Days for production HA and alert tuning.
Downsides: PromQL, YAML, relabeling, dashboard design, retention, storage, HA, and alert tuning are real operational work. The recurring tradeoff is "less UI, more YAML." This is the stack for teams that already think in metrics and want one control plane — not for teams that want monitoring running by lunch.
New Relic: Best for SaaS Application Performance
New Relic combines APM, infrastructure monitoring, logs, distributed tracing, synthetic monitoring, alerts, dashboards, and AI-assisted incident analysis. Its free tier — — is genuinely generous for small teams.
The alert intelligence is where New Relic shines for the alert-fatigue discussion. Its features include event correlation, anomaly detection, predictive alerts, root-cause analysis, and flapping suppression. New Relic has published an example where — that's a concrete noise reduction number.
Best for: SaaS teams and e-commerce platforms that want API monitoring tightly integrated with application-level traces, errors, throughput, and user impact.
Pricing: Free: 100 GB/month, 1 full user. Paid uses per-user and data-based pricing.
Setup speed: ~15–30 minutes for agent install and guided setup.
Downsides: Pricing can become complex at scale. Alert configuration has a learning curve — the platform is powerful but not immediately obvious.
Moesif: Best for API Analytics and Business Metrics
Moesif is not a traditional uptime monitor. It's API analytics and product intelligence: understanding API usage by customer, endpoint, cohort, company, geography, SDK, plan, and behavior. If your question is "which customer is affected?" rather than "is the endpoint up?", Moesif is built for that.
It supports for API metrics like traffic spikes/drops, latency, and behavior changes. The dynamic alerts need a few days of API behavior to build a model, but once trained, they catch changes that static rules miss.
Best for: API product teams, SaaS companies, and e-commerce platforms that need to connect API performance to revenue, engagement, and retention.
Pricing: ; paid plans scale with API event volume. Self-service dollar amounts weren't fully crawlable in my research — verify the current page.
Setup speed: ~20–45 minutes (SDK/proxy/gateway integration is deeper than an external ping).
Downsides: More analytics-focused than traditional uptime monitoring. You'll likely want to pair Moesif with Checkly, UptimeRobot, or Datadog synthetics for external availability checks.
Splunk: Best for Enterprise Log Analysis and Compliance
Splunk is the tool you reach for when log aggregation, search, correlation, compliance-ready auditability, and hybrid/multi-cloud support are non-negotiable. covers infrastructure, APM, synthetics, real user monitoring, logs, and incident response. can group notable events into episodes and reduce noise across monitoring silos.
Splunk's own is sobering: , , and .
Best for: Enterprise and multi-cloud teams with strict compliance, security, audit, and log-search requirements.
Pricing: Usage-based and quote-heavy. No simple production free tier.
Setup speed: Cloud onboarding can be faster, but enterprise deployment often takes days to weeks.
Downsides: Expensive at scale. Complex setup. Overkill for solo devs and small startups.
Postman: Best for Teams Already Testing APIs
Postman is primarily an API development and testing platform, but its lets teams schedule Postman collections and run them from cloud locations. The strongest argument is reuse: if your QA or dev team already has Postman collections with assertions, turning those into monitors is a natural next step.
Best for: Dev and QA teams that already use Postman collections and want scheduled checks without buying a separate synthetic tool.
Pricing: Free tier exists. ; add-on block of 50,000 calls for $20/month. Verify the — Postman plan packaging changes.
Setup speed: ~10 minutes if collections already exist.
Downsides: Monitoring capabilities are lighter than dedicated tools like Checkly, Datadog, or New Relic. Alert options are basic.
Other API Monitoring Tools Worth a Look
: Lightweight, self-hosted, config-driven health dashboard. , supports HTTP, ICMP, TCP, DNS, Prometheus-friendly metrics, and uptime badges. Great for solo devs who want something simpler than Prometheus but prefer YAML/config-as-code over Uptime Kuma's UI.
: Newer tool focused on API traffic analytics and quality tracking for startups. Claims with custom alerts across 14 metrics. Good for lightweight API analytics without adopting a full observability platform.
: Full-stack monitoring with logs, synthetics, and infrastructure visibility. . A lower-cost Datadog alternative for mid-market teams.
: OpenTelemetry-native APM, tracing, metrics, and logs backend. . Not a pure uptime checker, but ideal for teams standardizing on OTel who want an open-source-friendly tracing backend.
Build vs. Buy: Should You Roll Your Own API Monitoring?
"Should I just write a script that pings my endpoints, or use a dedicated tool?"
This question comes up constantly in developer forums. I've read enough Reddit threads to see the pattern clearly: teams start with curl + cron, it works fine for a while, and then they switch once they need dashboards, historical data, multi-region checks, reliable alert routing, or cross-team visibility.
An honest decision matrix:
| Factor | Custom Script | Specialized Tool |
|---|---|---|
| Setup time | 1–4 hours (basic); days (robust) | 5–30 minutes |
| Maintenance | You own it forever | Provider handles updates |
| Alert quality | Basic (up/down) | Smart (latency trends, anomalies, retries) |
| Cost | Free (your time) | $0–$500+/mo |
| Dashboard | Build from scratch | Pre-built, customizable |
| Best when… | ≤3 endpoints, dev-heavy team, hobby project | 5+ endpoints, ops/product team, revenue at stake |
The key insight from forums: people who build their own often regret it once they need dashboards, historical data, or cross-team visibility. And there's the meta-problem — "you need monitoring on your monitoring." A self-hosted monitor, database, backup, network path, and alert provider all need to be reliable too.
Build if you have 2 endpoints and enjoy tinkering. Buy if you have a product to ship.
The same logic applies to web data extraction. You can write a scraper, run headless browsers, rotate proxies, maintain selectors, clean HTML, and build a queue. But if the job is to reliably feed web data into an API product, AI agent, or research workflow, using is usually faster than rolling your own scraping infrastructure.
Alert Fatigue: Why Alert Quality Beats Alert Quantity
This might be the most underrated criterion when choosing an API monitoring tool. Alert fatigue is what happens when teams receive so many noisy, duplicate, or non-actionable alerts that they start ignoring all of them — and then miss real incidents.
The numbers are striking. found the median organization generated and . Median incident actionability was only — meaning fewer than one in five alert-derived incidents were actually actionable. found and .
The best monitoring tool is the one whose alerts you actually trust. A comparison of how the tools handle alert intelligence:
| Tool | Alert Type | Noise Reduction Method | Alert Channels |
|---|---|---|---|
| Datadog | ML anomaly, forecast, composite | Historical anomaly bands, dynamic baselines, Watchdog AI | Slack, PagerDuty, Opsgenie, Teams, 20+ |
| Checkly | Threshold + degradation-based | Retry-before-firing, same/different-location retries | Slack, PagerDuty, Opsgenie, Teams, incident.io |
| New Relic | AI issue grouping, anomaly, predictive | Event correlation, flapping suppression, root-cause context | Slack, PagerDuty, Teams, webhooks |
| Moesif | Behavioral anomaly | Dynamic models after several days of behavior | Slack, PagerDuty, email, SMS |
| Better Stack | Uptime/incident/on-call | Escalation policies, ownership routing, delays | Slack, Teams, webhooks, Zapier |
| Prometheus + Alertmanager | PromQL rule alerts | Grouping, deduplication, silencing, inhibition | Email, PagerDuty, Opsgenie, webhooks |
| Splunk | Events, episodes, service health | ITSI Event Analytics, episode grouping, ticketing | Splunk On-Call, ServiceNow, webhooks |
| Thunderbit Open API | Not an alerting platform | Use with your own scheduler, workflow tool, or monitoring stack | Webhooks for batch jobs; alerts handled externally |
Practical advice: Start with fewer, higher-confidence alerts. Use retry-before-firing, multi-region confirmation, SLO burn-rate alerts, deduplication, and ownership routing. Alert on user impact and business-critical flows (checkout failure, auth failure, payment 5xx), not every internal symptom.
2026 Free Tiers and Pricing: What You Actually Pay
Pricing pages change. Free tiers shift. Hidden costs (hosts, seats, logs, synthetic runs, data ingest) can surprise you. This is the section I wish existed on every "best tools" article. The 2026 snapshot:
| Tool | Free Tier | Paid Starts At | Credit Card Required? | Best Free Use Case |
|---|---|---|---|---|
| Thunderbit Open API | 600 one-time API units | ~$16/mo annually | No | Web data extraction for LLMs, RAG, pricing, and research |
| Uptime Kuma | Unlimited (self-host) | — | No | Full monitoring, own server |
| UptimeRobot | 50 monitors, 5-min intervals | ~$7/mo | No | Basic uptime checks |
| Better Stack | 10 monitors, 1 status page | ~$29/mo | No | Startup uptime + status page |
| Checkly | 10 uptime, 10k API checks | ~$24/mo | Yes | Synthetic API checks |
| Postman | Free account + monitoring allowance | ~$14/user/mo | No | Reusing existing collections |
| Prometheus + Grafana | Unlimited (self-host) | — | No | Metrics + visualization |
| Grafana Cloud | 100k API test exec/mo | $29/mo platform + usage | Verify | Managed synthetics trial |
| New Relic | 100 GB/mo, 1 full user | Per-user + data | Some plans | APM + basic observability |
| Datadog | Trial/varies by product | $15/host/mo (Infra Pro) | Often yes | Full-stack evaluation |
| Moesif | Free/trial available | Volume-based | Verify | API analytics evaluation |
| Splunk | Trials available | Quote-based | Sales flow | Enterprise proof of concept |
| Gatus | Unlimited (self-host) | — | No | YAML-driven status dashboard |
| Apitally | Free/trial available | Verify | Verify | Lightweight API analytics |
| Sematext | Trial/free varies | ~$2/HTTP monitor | Verify | Lower-cost synthetics/logs |
| Uptrace | Free self-hosted | Cloud tiers vary | Verify | OTel APM evaluation |
Hidden cost note: Self-hosted tools (Uptime Kuma, Prometheus, Gatus) are "free" in license terms, but a small VM, backups, maintenance time, and external failover can easily become the real cost. For web data APIs, the hidden cost is usually different: maintaining headless browsers, broken selectors, proxy pools, anti-bot workarounds, and HTML cleanup.
Small-team estimate: For 10 API endpoints and 3 team members, the cheapest SaaS path is usually UptimeRobot free or low paid, Better Stack free/Team, or Checkly if execution volume fits. Datadog and New Relic can be affordable for evaluation, but the real bill depends on hosts, users, logs, traces, and synthetic run volume. If your project needs website data as an API, Thunderbit's free API units are enough to test the workflow before committing to a paid plan.
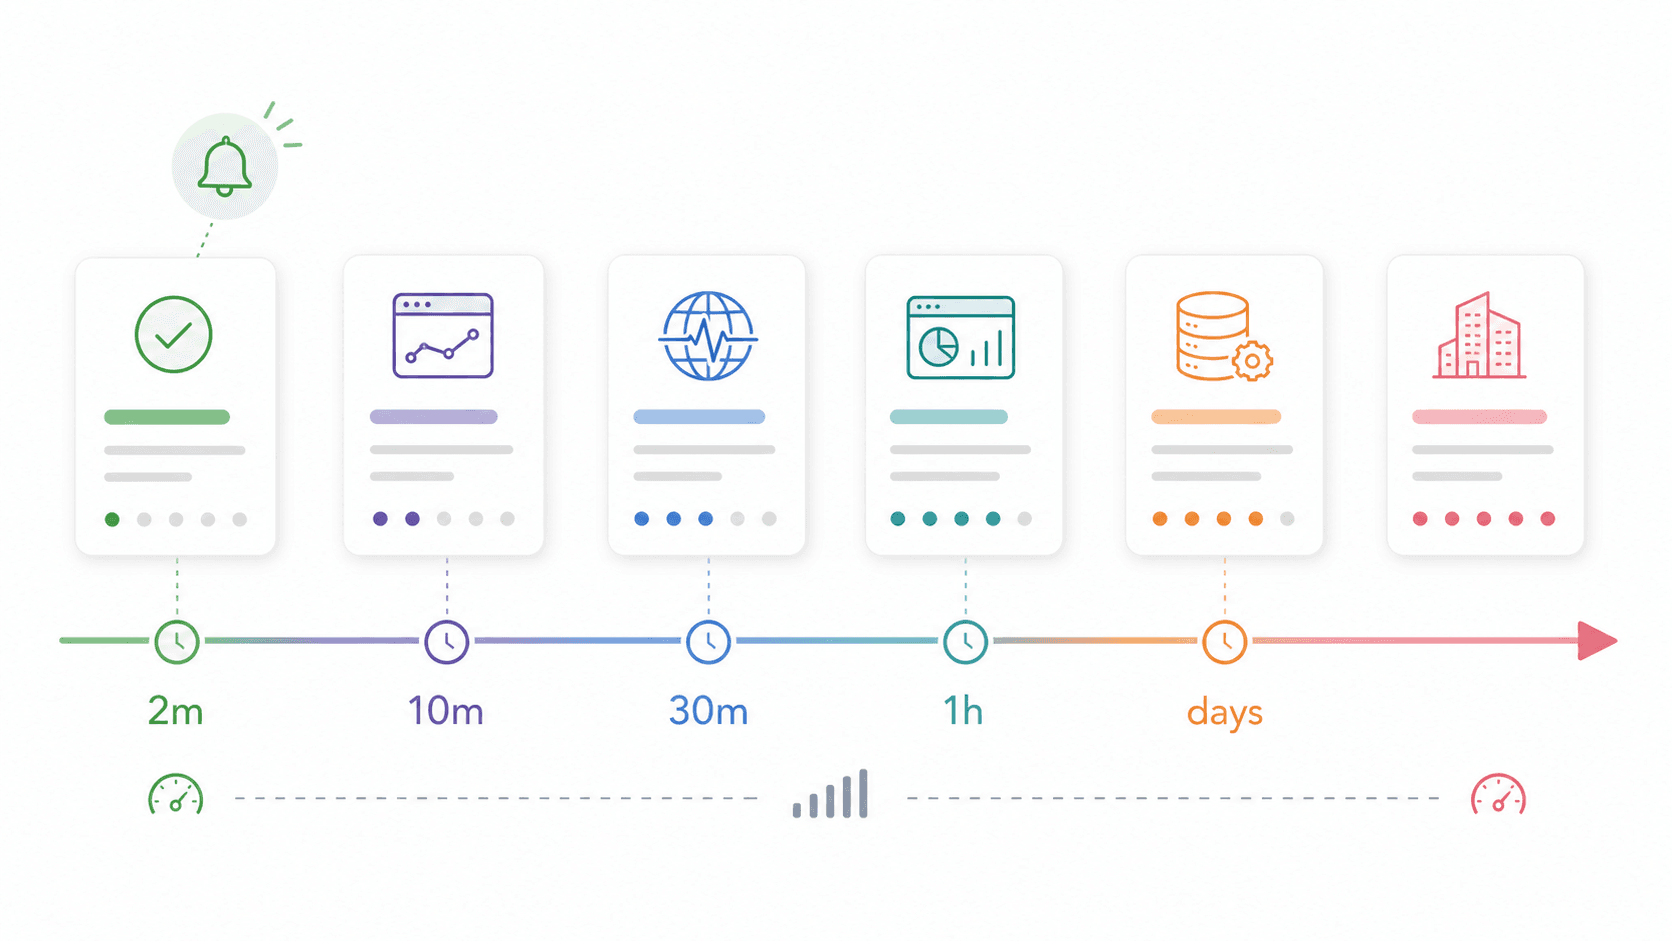
Setup Complexity Scorecard: How Fast to Your First Alert
No competitor article I've found evaluates time-to-value — how long from sign-up to receiving your first meaningful alert. For smaller teams, this matters more than feature depth.
| Tool | Time to First Alert | Technical Skill Needed | Config Approach |
|---|---|---|---|
| Thunderbit Open API | ~5–15 minutes | Low–Medium | API key, cURL/SDK/CLI |
| UptimeRobot | ~2–5 minutes | Low | GUI, click-to-add |
| Better Stack | ~5–10 minutes | Low | GUI wizard |
| Checkly | ~10–20 minutes | Low–Medium | Code or GUI |
| Postman | ~10 minutes (with collections) | Low–Medium | Collection scheduler |
| Uptime Kuma | ~5–30 minutes | Medium | Docker + GUI |
| Gatus | ~15–45 minutes | Medium | YAML + Docker |
| Datadog | ~15–30 minutes | Medium | Agent install + GUI |
| New Relic | ~15–30 minutes | Medium | Agent + guided setup |
| Moesif | ~20–45 minutes | Medium | SDK/proxy integration |
| Grafana Cloud Synthetics | ~15–45 minutes | Medium | GUI, Terraform optional |
| Prometheus + Grafana | 1–4 hours | Medium–High | YAML, PromQL |
| Uptrace | 30–90 minutes | Medium–High | OTel SDK integration |
| Splunk | Hours to weeks | High | Enterprise onboarding |
If monitoring needs to be live by end of day, start in the top half of that table. If the goal is durable platform observability, plan a separate project for the bottom half. And if your first milestone is "get clean data from these 100 web pages into an app," start with Thunderbit before building custom scraping infrastructure.
Best API Monitoring Tools Compared: The Full Side-by-Side
One table to scan before deciding:
| Tool | Best Use Case | Free Tier | Alert Intelligence | Setup Time | Hosting | Standout Feature |
|---|---|---|---|---|---|---|
| Thunderbit Open API | Web data extraction/API data pipelines | 600 API units | Not an alerting tool | 5–15 min | Cloud | Distill pages to Markdown or extract schema-based JSON |
| Datadog | Full-stack enterprise/SaaS | Trial/varies | Anomaly, forecast, AI | 15–30 min | Cloud | Correlates synthetics with logs/traces/infra |
| Checkly | Dev-first synthetics | Generous checks-based | Retries, degradation | 10–20 min | Cloud | Monitoring as code + Playwright |
| UptimeRobot | Simple uptime | 50 monitors | Basic thresholds | 2–5 min | Cloud | Fastest low-cost basic monitor |
| Uptime Kuma | Free self-hosted | Unlimited | Basic status/threshold | 5–30 min | Self-hosted | Clean UI, no SaaS fee |
| Better Stack | Incident response/status pages | 10 monitors | Escalations, routing | 5–10 min | Cloud | Monitoring + on-call + status page |
| Prometheus + Grafana | Open-source metrics stack | Unlimited (self-host) | Alertmanager grouping | 1–4 hr | Self-hosted/cloud | PromQL ecosystem depth |
| New Relic | SaaS APM + API checks | 100 GB/mo, 1 user | AI grouping, flapping suppression | 15–30 min | Cloud | Strong APM + synthetics together |
| Moesif | API analytics/business metrics | Free/trial | Behavioral anomalies | 20–45 min | Cloud | Per-customer API behavior analytics |
| Splunk | Enterprise logs/compliance | Trial | ITSI episodes, AIOps | Days+ | Cloud/self-managed | Enterprise log search and governance |
| Postman | Teams already testing APIs | Free account | Basic monitor alerts | 10 min | Cloud | Reuse API test collections |
How Thunderbit Can Speed Up Your API Tool Evaluation
Full disclosure: is not an API monitoring tool — it's an AI web scraper and for turning web pages into clean Markdown or structured JSON. That makes it useful in a different part of the monitoring-tool decision process: collecting vendor pricing, plan limits, feature claims, documentation details, and integration lists before you pick a platform.
Instead of manually opening 10+ vendor pricing pages, copying plan names, monitor limits, check intervals, integrations, and credit card requirements into a spreadsheet, we used the to extract structured data from each tool's pricing and features pages. Thunderbit's AI reads each page and suggests fields — plan name, free tier details, paid price, supported integrations — then structures the output into an exportable spreadsheet.
For developer workflows, gives you the same idea programmatically. Use Distill when you want clean Markdown for LLMs or RAG. Use Extract when you need specific fields returned as JSON. Use Batch when you need to process a list of pricing pages, documentation URLs, product pages, or competitor pages and receive results asynchronously.
The workflow:
- Open a vendor's pricing page (Datadog, Checkly, UptimeRobot, etc.)
- Click "AI Suggest Fields" — Thunderbit proposes columns based on the page content
- Click "Scrape" — data populates into a structured table
- Use subpage scraping to hit each vendor's pricing, features, and docs pages
- Export to Google Sheets, Excel, Airtable, Notion, or CSV
For API-first teams, the API workflow is just as direct:
- Get a free API key from Thunderbit
- Call the Distill endpoint for clean Markdown from any public page
- Call the Extract endpoint with schema descriptions for structured JSON
- Use Batch endpoints and webhooks for larger URL lists
- Send the output into your app, spreadsheet, warehouse, vector database, or monitoring workflow
For a comparison across 10+ vendors, manual copy-paste can easily take 2–3 hours once you include pricing subpages, docs, and integrations pages. Thunderbit cut our first-pass extraction to roughly 15–30 minutes, with the remaining time spent on verification and judgment calls. If your ops, procurement, research, or AI product team is evaluating tools under time pressure, it's a practical shortcut. You can see more about this kind of workflow on our guide, explore , or check out our for walkthroughs.
How to Pick the Best API Monitoring Tool for Your Team
The "best" API monitoring tool depends on your team size, technical depth, budget, and what failure looks like for your product.
A solo dev doesn't need Splunk. A regulated enterprise shouldn't rely on a cron job. An API product team may need Moesif-style customer analytics more than uptime pings. An e-commerce team should prioritize critical-path checks for login, search, add-to-cart, checkout, and payment authorization. An AI or data product team may need Thunderbit-style web data extraction before it needs full observability.
Three principles that held up across all my research:
- Match the tool to your use case. The quick-pick table exists for a reason — start there.
- Prioritize alert quality over alert quantity. If your team ignores alerts, you don't have monitoring. You have noise.
- Don't underestimate setup speed. A monitor that goes live today and sends trustworthy alerts is better than a perfect platform plan that leaves checkout unmonitored for another month.
If you're comparing multiple tools simultaneously and want to accelerate the research, give a try for bulk-extracting vendor data into a single spreadsheet. If you're building an API product, RAG pipeline, AI agent, or market intelligence workflow that needs clean web data, start with . It won't pick the monitoring tool for you — but it'll get you to the decision faster, and it can give your own product a reliable web data layer.
FAQs About the Best API Monitoring Tools
What is the best free API monitoring tool in 2026?
For SaaS simplicity, UptimeRobot offers 50 free monitors at 5-minute intervals with no credit card required. For self-hosted control, Uptime Kuma is open-source, unlimited, and has a clean UI with 90+ notification services. For teams that want metrics depth and already have technical skill, Prometheus + Grafana + Alertmanager is the best open-source stack — though setup takes hours, not minutes.
If your goal is not uptime monitoring but extracting web data through an API, Thunderbit Open API has a free tier with 600 one-time API units, which is enough to test page-to-Markdown distillation or schema-based JSON extraction before scaling up.
What is the difference between API monitoring and APM?
API monitoring checks endpoint availability, response time, errors, and correctness from the outside — it simulates what a user or integration experiences. APM (Application Performance Monitoring) goes deeper inside the application: code-level traces, database queries, runtime errors, queue latency, and service dependencies. Tools like Datadog and New Relic offer both; UptimeRobot and Uptime Kuma focus on external uptime checks.
Thunderbit Open API is different from both: it is a web data extraction API. It helps you turn external websites into Markdown or structured JSON, which is useful for LLM apps, research workflows, pricing intelligence, and data pipelines.
How often should I monitor my APIs?
Production revenue-critical APIs (checkout, auth, payments) should typically be checked every 1 minute. Internal or low-traffic APIs can often be checked every 5 minutes. But frequency alone isn't the whole story — use retries, multiple regions, and meaningful assertions so each check is both fast and trustworthy. A 1-minute check that fires false alarms is worse than a 5-minute check you can trust.
For web data extraction workflows, frequency depends on how often the source changes. Pricing pages may need daily or weekly extraction. Fast-moving inventory, travel, or marketplace data may need hourly or more frequent refreshes. Thunderbit's batch API and webhooks are useful when you need to process many URLs on a schedule.
Can I monitor APIs without writing code?
Yes. UptimeRobot, Better Stack, and Uptime Kuma can be used entirely through GUIs. Checkly supports both GUI and code-based setup. Postman uses a collection-based interface. Prometheus/Grafana usually requires YAML and PromQL. Datadog and New Relic can start through guided setup but become more powerful with deeper instrumentation.
If you want to extract website data without writing code, Thunderbit's Chrome Extension is the no-code path. If you want to automate that same workflow from an application, gives developers Distill, Extract, and Batch endpoints.
How do I reduce alert fatigue from API monitoring?
Choose tools with smart alerting: anomaly detection (Datadog, New Relic), retry-before-firing (Checkly), behavioral anomalies (Moesif), or grouping/silencing (Prometheus Alertmanager). Start with fewer, higher-confidence alerts focused on user-facing impact. Use SLO burn-rate alerts instead of static thresholds, deduplicate across services, route by ownership, and measure actionability — if fewer than 20% of your alerts lead to real action, reduce noise first.
Learn More