
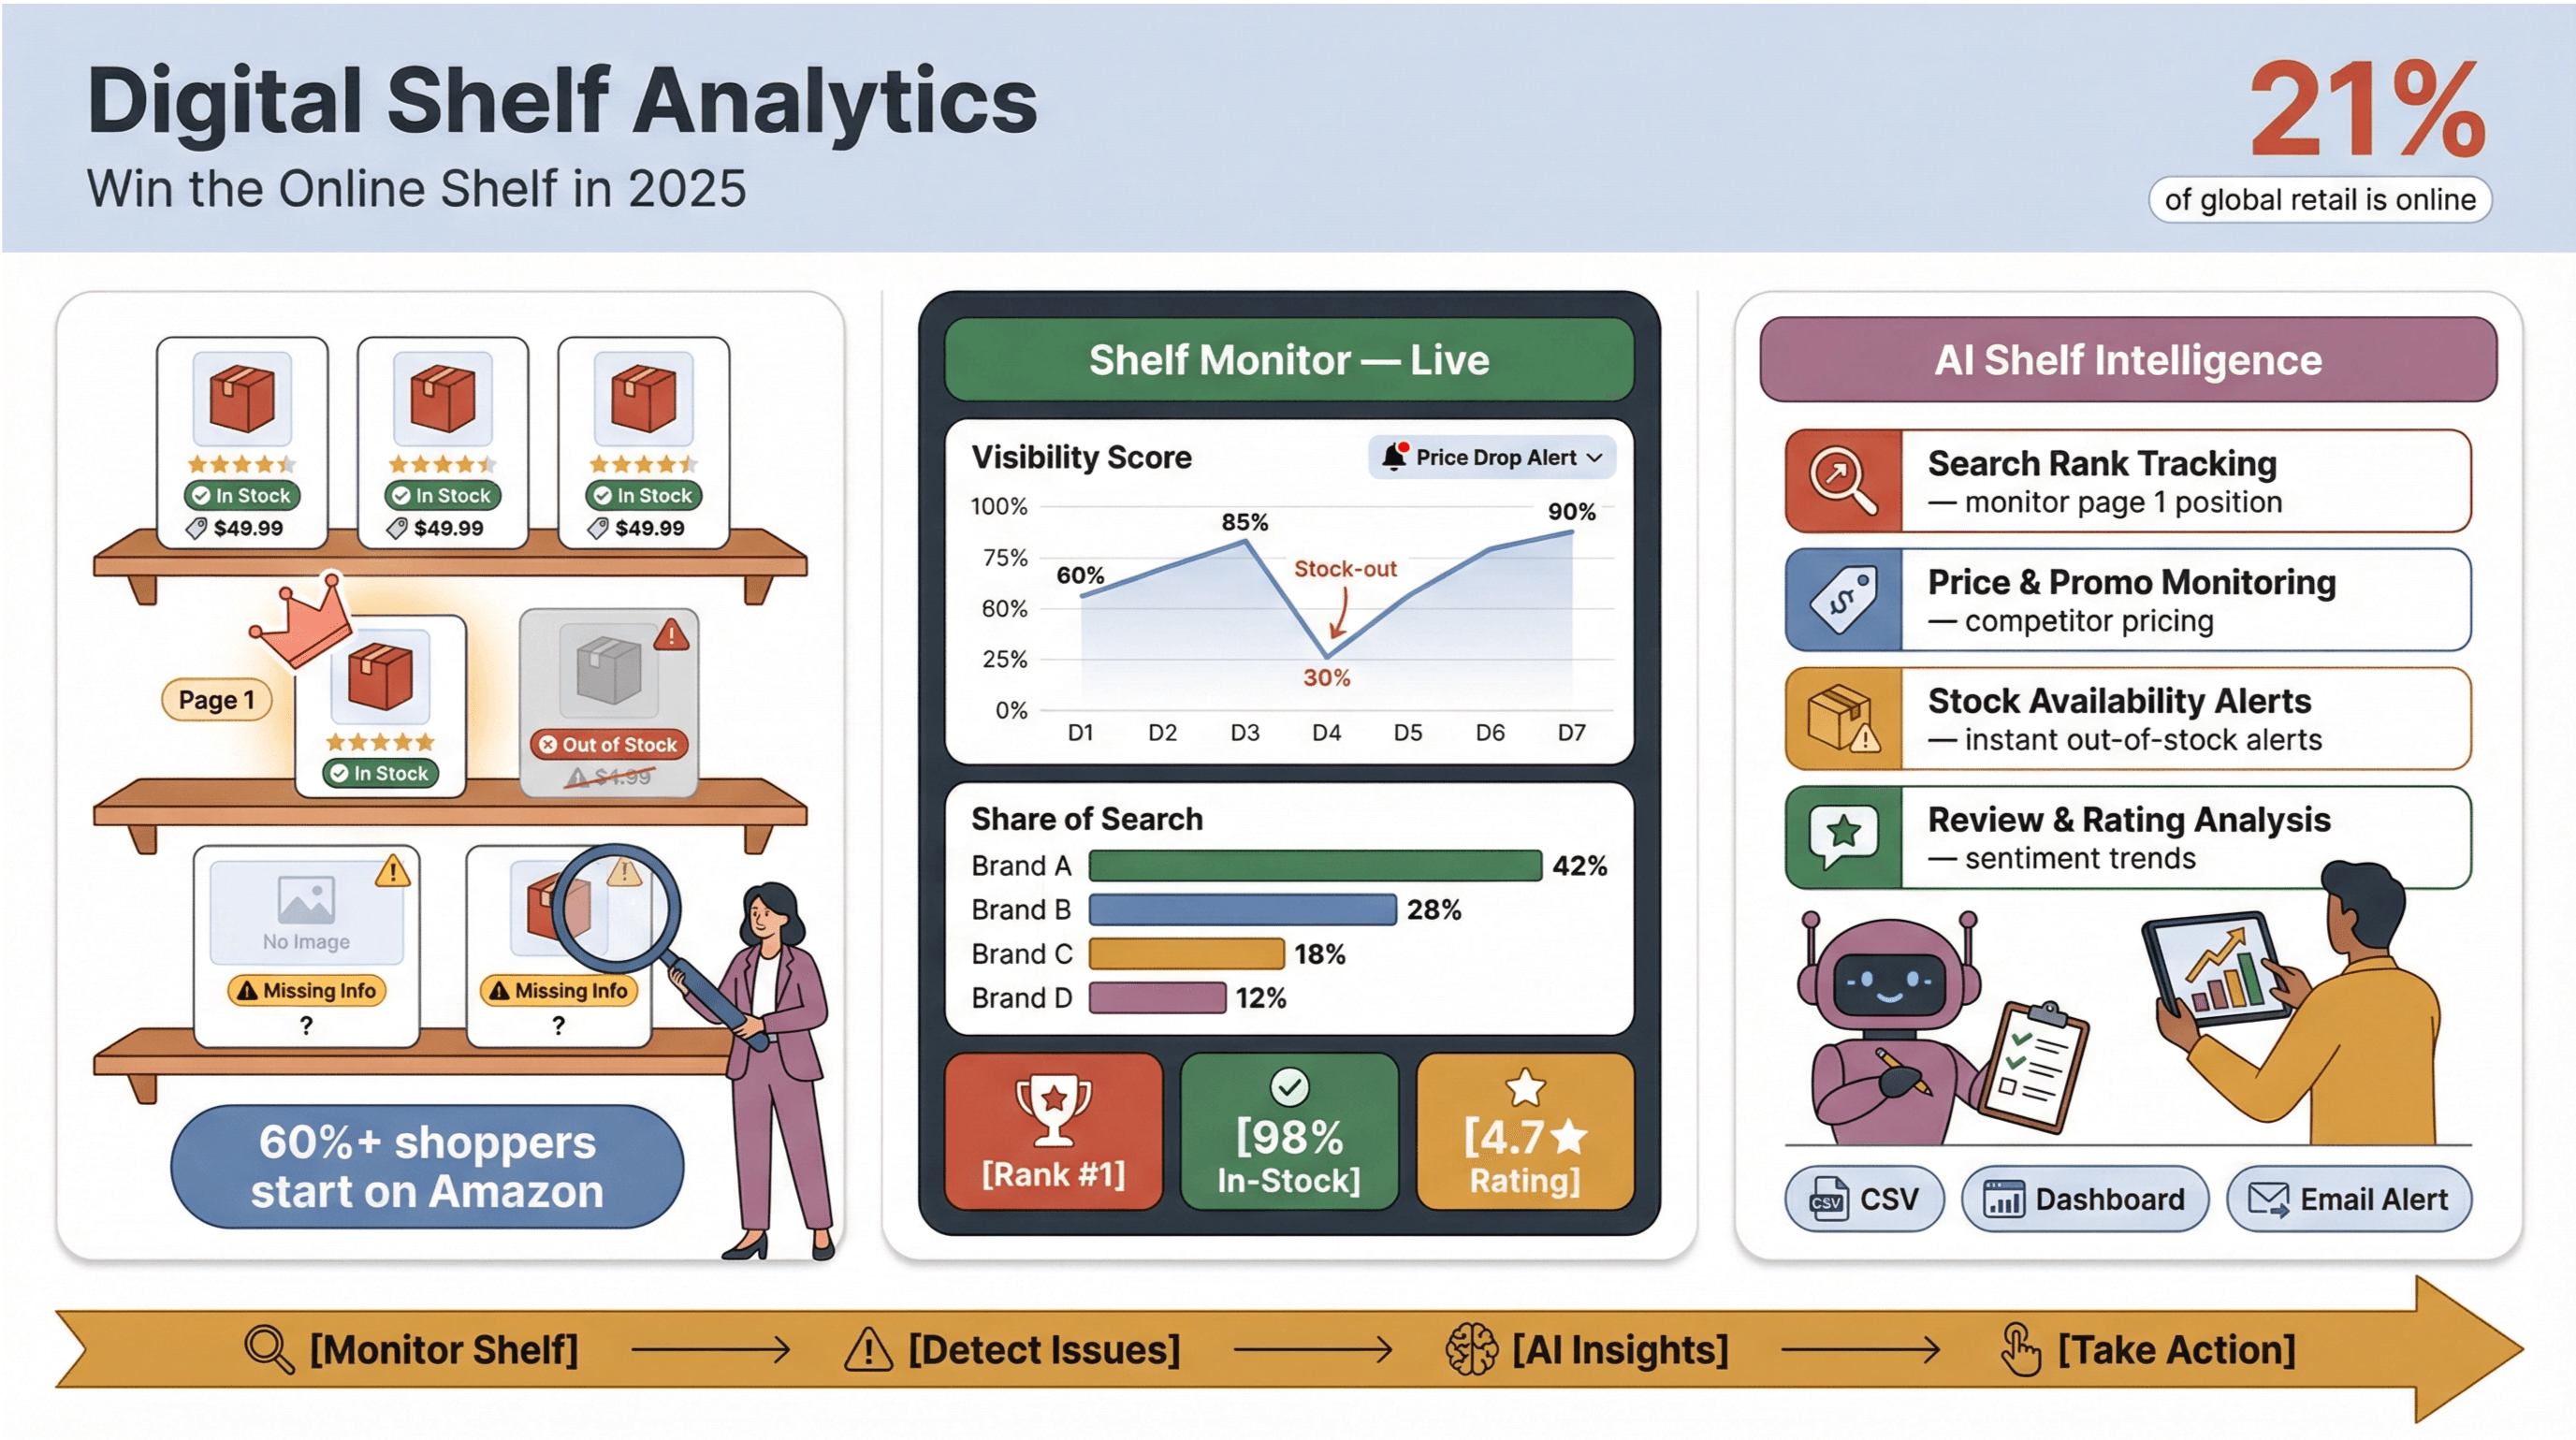
Ecommerce isn’t just about having the best product anymore—it’s about being seen at the right place, at the right time, with the right offer. In 2025, the “digital shelf” is where brands win or lose, and the competition is fierce. With , the stakes for ecommerce product visibility have never been higher. But here’s the kicker: more than 60% of shoppers start their search on Amazon, not on your website (). If your product isn’t showing up on page one—or worse, if it’s out of stock or missing key info—you’re invisible.
I’ve seen brands pour millions into ads and content, only to lose out because they couldn’t monitor their online shelf in real time. That’s why I’m obsessed with digital shelf analytics and why, at Thunderbit, we’ve built tools to make online shelf monitoring not just possible, but practical for every team. Let’s dive into what digital shelf analytics really means, why it’s so critical, and how you can use AI-powered solutions like to boost your ecommerce product visibility and outpace the competition.
What Is Digital Shelf Analytics? A Clear Guide for Ecommerce Teams
Let’s cut through the jargon. Digital shelf analytics is all about tracking, measuring, and optimizing how your products appear, perform, and compete across online retailers and marketplaces. Think of it as your “always-on” radar for product visibility, pricing, content health, and competitive moves—everywhere your products are sold online.
Unlike traditional retail analytics, which focuses on physical shelf space and slow-moving planograms, digital shelf analytics is dynamic, granular, and real-time. It’s not just about what’s happening on your own website, but how your products stack up on Amazon, Walmart, Target, niche marketplaces, and even international sites. As puts it, digital shelf analytics gives brands actionable data from third-party digital channels, not just first-party web analytics.
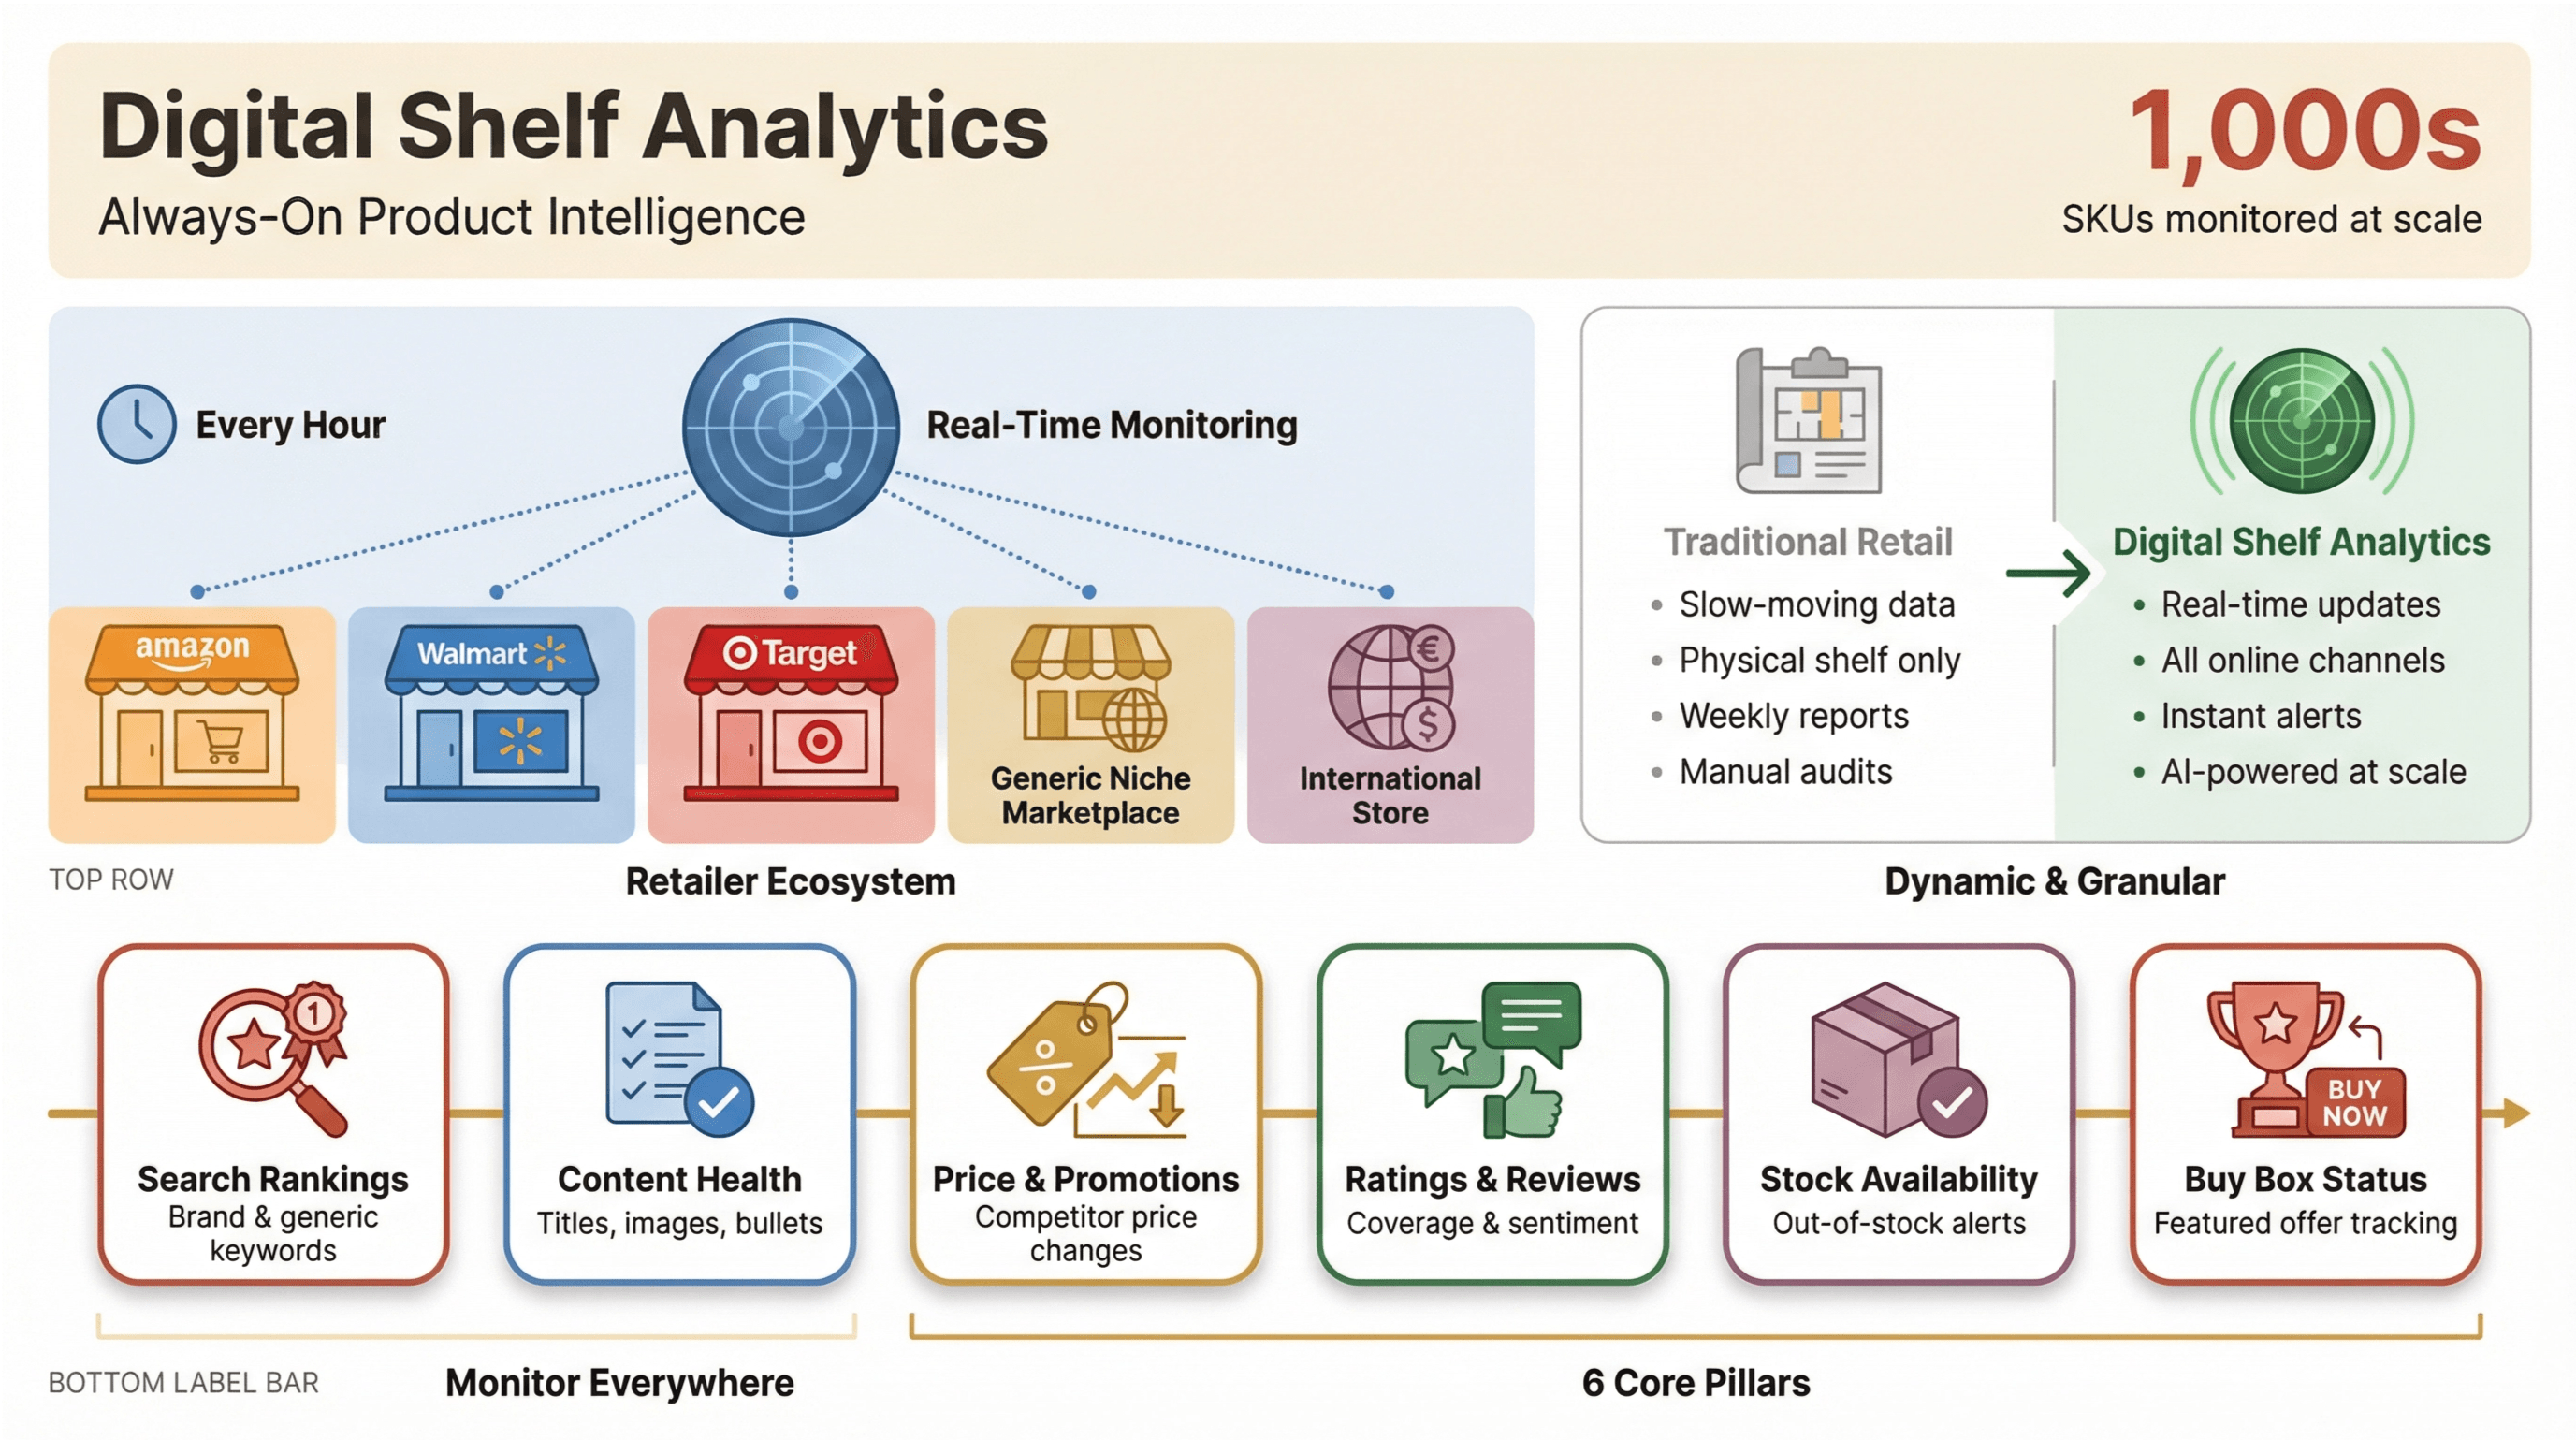 In practice, this means monitoring:
- Search rankings for your priority keywords (brand, generic, and solution-based)
- Product content completeness (titles, bullets, images, enhanced content)
- Price and promotion changes
- Ratings and review coverage
- Stock availability
- Buy Box or featured offer status
And doing it at scale, across thousands of SKUs and dozens (or hundreds) of online stores. Manual tracking? Forget it. The digital shelf changes every hour, and missing a single out-of-stock event or price drop can cost you big.
Why Digital Shelf Analytics Matters for Ecommerce Growth
So, why does this matter? Because the digital shelf is where shoppers make decisions—and where brands either capture demand or lose it to competitors. Here’s what the data shows:
- 75% of shoppers will switch brands if they can’t find the info they need ()
- Product pages with enhanced content see a 39% lift in conversion rates ()
- Adding just one review can boost conversion by 52% ()
- Buy Box wins drive 80–83% of Amazon sales ()
- Stockouts cost retailers nearly $1 trillion worldwide each year ()
Digital shelf analytics isn’t just about reporting—it’s about finding and fixing the root causes of lost sales, wasted ad spend, and missed opportunities. It’s the difference between being “retail ready” and being left behind.
Here’s a quick table summarizing the ROI-focused benefits for different teams:
| Team | Digital Shelf Analytics Benefit | Example Outcome |
|---|---|---|
| Sales | Track share of search, Buy Box wins | Higher conversion, more units sold |
| Marketing | Optimize content, monitor reviews | Increased traffic, better brand perception |
| Operations | Monitor stock, price, compliance | Fewer stockouts, reduced lost sales, faster fixes |
And it’s not just theory—brands using digital shelf analytics have reported .
Key Metrics for Online Shelf Monitoring: What to Track and Why
If you want to win the digital shelf, you need to track the right metrics. Here’s my go-to list, mapped to the ecommerce funnel:
Discoverability (Impressions → Clicks)
- Search Rank: Where does your product show up for key terms?
- Share of Search: How many of the top slots do you own?
- Sponsored vs. Organic Placement: Are you paying for visibility, or earning it?
Readiness (Click → Consideration)
- Content Completeness: Are all required attributes, images, and enhanced content blocks present?
- Image Compliance: Are your hero images up to retailer standards?
- Ratings & Reviews Coverage: Do you have enough reviews and a strong average rating?
Competitiveness (Consideration → Cart)
- Price Index: How does your price compare to competitors?
- Buy Box/Featured Offer: Are you the default option on marketplaces?
Operations (Cart → Purchase)
- In-Stock Rate: Are your products available everywhere they should be?
- Shipping Promise: Are you offering competitive delivery times and costs?
Each of these metrics directly influences ecommerce product visibility and conversion. For example, a drop in search rank can tank your traffic overnight, while missing images or low review counts can kill conversion—even if you’re showing up on page one.
Thunderbit: Your AI-Powered Solution for Digital Shelf Analytics
Here’s where Thunderbit comes in. is an AI web scraper Chrome Extension built for business users who need to monitor their digital shelf—without coding, templates, or endless manual work.
What makes Thunderbit different? It’s all about speed, flexibility, and AI-driven automation:
- AI Suggest Fields: Just describe what you want (“Extract product name, price, rating, review count, and rank position for every result on this page”), and Thunderbit’s AI figures out the rest.
- Subpage Scraping: Need more detail? Thunderbit can visit each product page (PDP), extract in-stock status, enhanced content, shipping promise, and more—then merge it all into one table.
- Instant Data Export: With one click, send your data to Excel, Google Sheets, Airtable, or Notion. No more copy-paste marathons.
- Pagination and Scheduling: Scrape across multiple pages or schedule recurring jobs to keep your shelf data fresh.
- Cloud or Browser Scraping: Run jobs in the cloud for speed, or in your browser for login-protected sites.
Thunderbit is trusted by , from ecommerce giants to indie brands. And yes, there’s a so you can try it out risk-free.
Step-by-Step: How to Use Thunderbit for Ecommerce Product Visibility
Let’s walk through how you can use Thunderbit to monitor your digital shelf—no technical skills required.
Using Natural Language to Define Your Data Needs
Start by thinking about what you want to track. For digital shelf analytics, your prompts might look like:
- “Extract product name, price, rating, review count, sponsored/organic label, rank position, and product URL for every result on this page.”
- “From each product page, extract in-stock status, price, promotion text, shipping estimate, buy box/featured offer seller, number of images, and whether video/360 view exists.”
Just open the , paste your target URL or a list of product URLs, and describe your needs in plain English. Thunderbit’s AI will read the page and suggest the best fields to extract.
AI Suggest Fields: Automate Data Extraction for Online Shelf Monitoring
Click “AI Suggest Fields” and let Thunderbit do the heavy lifting. The AI scans the page, identifies relevant data points (like product title, price, reviews, badges, etc.), and sets up your extraction columns automatically.
This is a lifesaver for non-technical users. No more fiddling with CSS selectors or writing code. Just review the suggested fields, tweak as needed, and you’re ready to scrape.
Exporting and Analyzing Data for Actionable Insights
Once your data is scraped, Thunderbit presents it in a clean table. You can:
- Export to Excel, Google Sheets, Airtable, or Notion with one click
- Download as CSV or JSON for deeper analysis
- Schedule recurring scrapes to keep your data fresh
Now you can analyze trends, visualize share of search, track price changes, and spot content gaps—turning raw shelf data into actionable business insights.
For more tips, check out .
Unique Data Case Study: Real-World Impact of Digital Shelf Analytics
Let’s get specific. Here’s a real-world case study that shows how digital shelf analytics, powered by Thunderbit, can drive measurable results.
The Challenge
A mid-sized beauty brand wanted to improve its visibility and conversion on Amazon and Walmart. They tracked 100 SKUs across 30 high-priority keywords, but manual monitoring was impossible—data was always out of date, and they kept missing out-of-stock events and negative review spikes.
The Approach
Using Thunderbit, the team set up daily scrapes of search results and product pages. They tracked:
- Share of search (how many page-one slots they owned)
- Content completeness (missing images, bullets, enhanced content)
- Review coverage (number and average rating)
- Price index (vs. competitors)
- In-stock rate
After two weeks of baseline monitoring, they launched interventions: fixing content gaps, soliciting reviews, adjusting pricing, and resolving stock issues.
The Results
- Share of search increased from 18% to 31% across tracked keywords
- Content completeness jumped from 72% to 97% (all SKUs now had enhanced content)
- Average review count rose by 22% after review campaigns
- In-stock rate improved from 89% to 99%
- Conversion rate (measured via retailer analytics) lifted by 14% in the “after” period
One key insight: a single out-of-stock event on a top SKU caused a 3-day drop in search rank, which took a week to recover—even after restocking. This directly tied operational issues to lost visibility and sales, underscoring the value of real-time shelf monitoring.
Comparing Thunderbit with Traditional Digital Shelf Monitoring Solutions
Let’s see how Thunderbit stacks up against other approaches:
| Feature/Metric | Manual Tracking | Code-Based Scrapers | Legacy DSA Platforms | Thunderbit |
|---|---|---|---|---|
| Setup Time | High | High | Medium | Low (minutes) |
| Maintenance | Constant | Frequent | Vendor-managed | Minimal (AI adapts) |
| Data Freshness | Low | Medium | High | High (real-time) |
| Customization | Low | High (if you code) | Medium | High (AI prompts) |
| Subpage Scraping | No | Complex | Limited | Yes (1 click) |
| Export Options | Manual | Scripted | Standard reports | Excel, Sheets, Notion, Airtable |
| Cost | Labor/time | Dev resources | $$$/year | Free–$15+/month |
Thunderbit bridges the gap between flexibility and ease of use—no technical skills required, no waiting for IT, and no vendor lock-in.
Dynamic Optimization: Combining AI Scraping with Digital Shelf Analytics
Here’s where things get really interesting. With Thunderbit, you’re not just collecting data—you’re enabling dynamic optimization. That means:
- Real-time monitoring: Spot issues (like stockouts, price changes, or review drops) as they happen, not after the fact.
- Closed-loop improvement: Monitor → Diagnose → Act → Re-measure. Every intervention (content fix, price change, review campaign) can be tracked for impact.
- Dynamic pricing and inventory: Adjust your offers in response to competitor moves, stock status, or market trends—backed by fresh data.
- Retail media alignment: Overlay shelf data with ad spend to avoid wasting budget on out-of-stock or poorly ranked SKUs.
The result? You’re not just reacting—you’re proactively managing your digital shelf for maximum visibility and sales.
Thunderbit in Action: How Brands Use Digital Shelf Analytics to Outperform Competitors
I’ve seen brands use Thunderbit to:
- Win the Buy Box by tracking price and stock daily, then adjusting offers in real time
- Boost review coverage by identifying SKUs with low ratings and launching targeted campaigns
- Spot content gaps (missing images, outdated bullets) and fix them before they hurt conversion
- Monitor competitors by scraping their product pages, prices, and reviews—then benchmarking performance
- Align retail media with shelf readiness, increasing ROAS by avoiding wasted spend on unready SKUs
One Thunderbit user (a CPG brand) told me, “We used to spend hours every week just trying to figure out where we were losing ground. Now, Thunderbit gives us a daily dashboard of what matters—so we can act fast and stay ahead.”
For more inspiration, check out and .
Conclusion & Key Takeaways: Elevate Your Ecommerce Product Visibility with Digital Shelf Analytics
Here’s the bottom line: digital shelf analytics is the secret weapon for ecommerce growth in 2025. It’s not just about tracking rank or price—it’s about understanding (and acting on) the signals that drive visibility, conversion, and loyalty across every online channel.
With AI-powered tools like , you can:
- Monitor your digital shelf in real time, across any retailer or marketplace
- Track the metrics that matter—search rank, content health, reviews, price, stock, and more
- Export and analyze data instantly, turning insights into action
- Outperform competitors by spotting issues and opportunities before they do
Ready to level up your ecommerce product visibility? and start building your digital shelf analytics workflow today. And if you want more tips, check out the for guides, case studies, and the latest in AI-powered ecommerce analytics.
FAQs
1. What is digital shelf analytics, and how is it different from traditional retail analytics?
Digital shelf analytics tracks and optimizes how your products appear and perform across online retailers and marketplaces. Unlike traditional retail analytics (focused on physical stores), it’s dynamic, granular, and covers third-party channels—helping you manage visibility, content, pricing, and stock in real time.
2. Why is online shelf monitoring so challenging for brands?
The digital shelf changes constantly—prices, rankings, reviews, and stock status can shift hourly. Manual monitoring doesn’t scale, and every retailer has different rules. That’s why AI-powered solutions like Thunderbit are essential for keeping up.
3. What are the most important metrics to track in digital shelf analytics?
Key metrics include search rank, share of search, content completeness, ratings/reviews, price index, Buy Box status, in-stock rate, and shipping promise. Each one directly impacts product visibility and conversion.
4. How does Thunderbit help with ecommerce product visibility?
Thunderbit uses AI to automate data extraction from any website, letting you monitor your digital shelf in real time. Features like AI Suggest Fields, subpage scraping, and instant exports make it easy to track, analyze, and act on shelf data—no coding required.
5. Can I use Thunderbit with Excel, Google Sheets, or other analytics tools?
Absolutely! Thunderbit lets you export scraped data directly to Excel, Google Sheets, Airtable, Notion, or as CSV/JSON files. This makes it easy to visualize trends, build dashboards, and integrate shelf analytics into your existing workflows.
Ready to see your products rise to the top of the digital shelf? and experience the difference for yourself.
Learn More