The Amazon marketplace in 2026 is a different beast than it was even a year or two ago. If you’re like me—always chasing the next data point, always curious about what’s really driving growth—you know that staying ahead means understanding the numbers behind the headlines. And let me tell you, the numbers this year are wild: Amazon’s global GMV is pushing past $800 billion, the seller base is consolidating, and some product categories are growing so fast it’s almost dizzying. Whether you’re an established seller, a brand just starting out, or a data nerd like me, these Amazon seller statistics aren’t just trivia—they’re your playbook for 2026.
Let’s dive into the most important Amazon seller statistics for 2026, break down which categories are on fire, compare private label and third-party seller performance, and see how tools like Thunderbit are helping sellers turn raw data into real advantage. I’ll also take you on a global tour of regional trends and finish with the headline stats you’ll want to bookmark (or, let’s be honest, cite in your next pitch deck).
2026 Amazon Seller Statistics: A Comprehensive Market Overview
The Amazon marketplace is bigger, more competitive, and—believe it or not—more concentrated than ever. Here’s what the data says about where we stand in 2026:
Total Amazon Net Sales (2025): $716.9 billion (up 12.4% YoY)
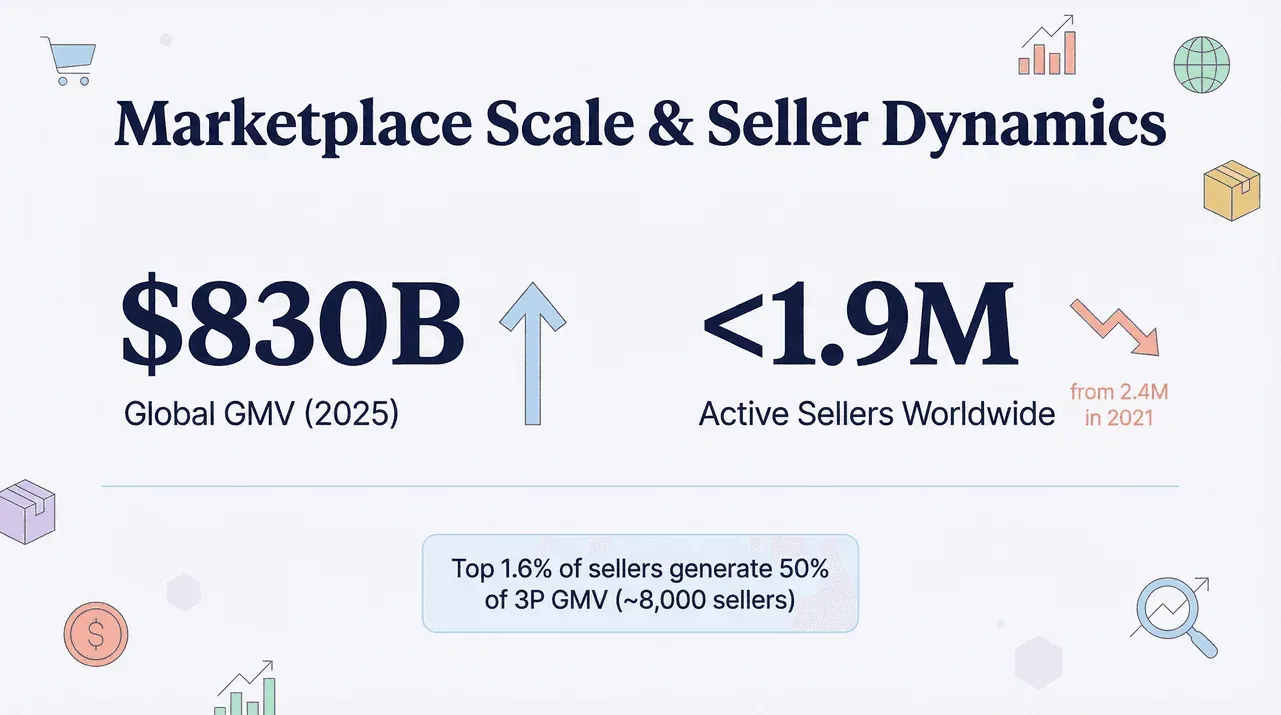
Estimated Global Amazon GMV (2025): $830 billion (all marketplaces)
Third-Party Seller GMV (2025): $575 billion (global)
Active Sellers Worldwide (end of 2025): ~1.65 million (down from 2.4 million in 2021)
New Seller Registrations (Amazon.com, 2025): 165,000 (down 44% YoY)
Seller Services Revenue (2025): $172.2 billion (commissions, FBA fees, etc.)
Advertising Services Revenue (2025): $68.6 billion (up 22.1% YoY)
Chinese Sellers’ Share of Global Active Sellers: 50.03% U.S. Third-Party GMV (2025): $305 billion
What’s the story behind these numbers? The seller base is shrinking, but the marketplace is growing—meaning more dollars per seller, but also fiercer competition and higher stakes. And with Amazon’s service revenue now making up nearly 59% of total net sales, it’s clear that seller economics are at the heart of Amazon’s business model.
Try Thunderbit for Amazon data research
Year-on-Year Shifts and Emerging Trends
- Seller Churn and Consolidation: The number of active sellers is down, but those who remain are doing more business. In fact, fewer than 8,000 sellers (about 1.6% of active sellers) now generate half of U.S. third-party GMV.
- Traffic Per Seller Is Up: With fewer sellers and steady traffic, visits per seller rose 31% from 2021 to 2025.
- Cross-Border Dynamics: Chinese sellers now make up the majority of active accounts, but U.S. sellers still capture a larger share of revenue per seller.
The bottom line: The Amazon marketplace in 2026 is all about scale, specialization, and data-driven agility.
Sales Growth and Market Share: Which Categories Have the Most Potential?
If you’re looking for the next big thing on Amazon, you need to know where the growth is happening. The data for 2025–2026 points to some clear winners—and a few surprises.
Category-Level Sales Growth and Market Share Shifts
Let’s break down the numbers by major product categories, focusing on the U.S. (where the data is richest):
| Category | Unit Sales YoY | Revenue YoY | Notable Drivers |
|---|---|---|---|
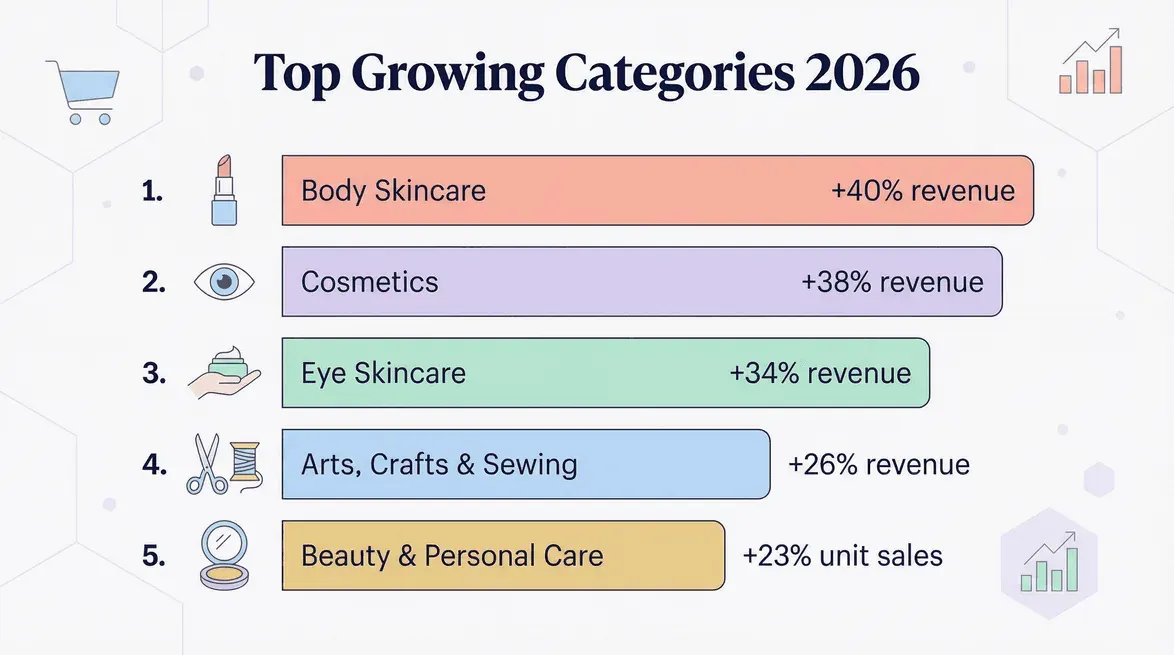
| Beauty & Personal Care | +23% | +22% | Largest YoY growth across 19 categories (Jungle Scout) |
| Cosmetics | +30% | +38% | Review volume up 45%, avg. price ~$23.10 (Jungle Scout) |
| Eye Skincare | +33% | +34% | Volume-led growth, avg. price ~$22.74 (Jungle Scout) |
| Body Skincare | +29% | +40% | Avg. sales price up 8% (Jungle Scout) |
| Arts, Crafts & Sewing | +28% | +26% | Paints/pens/markers lead, strong gifting seasonality (Jungle Scout) |
| Appliances | “Nearly +20%” | – | Strong consumer interest in upgrades (Jungle Scout) |
| Automotive (niches) | +15–20% | +15–20% | Strategic pricing, 3P sellers generate 60%+ of revenue (Jungle Scout) |
| Car Care & Cleaning | +14% | – | 6% YoY price drop fueled unit growth (Jungle Scout) |
2026’s Fastest-Growing Amazon Categories
Based on the data, here’s my ranking of the top 5 categories to watch in 2026:
- Cosmetics – Revenue up 38% YoY, with review volume up 45%. The beauty boom is real.
- Body Skincare – Revenue up 40%, driven by both volume and price increases.
- Eye Skincare – Revenue up 34%, with strong unit growth.
- Arts, Crafts & Sewing – Revenue up 26%, especially during gifting seasons.
- Appliances – Nearly 20% unit sales growth, signaling a shift in consumer priorities.
Why are these categories gaining traction? It’s a mix of consumer trends (self-care, home improvement, creative hobbies), competitive pricing, and the ability for sellers to differentiate with private label or unique bundles.
Private Label vs. Third-Party Sellers: Who’s Winning in 2026?
One of the hottest debates in the Amazon seller community is whether to go private label or stick with third-party/wholesale models. The numbers tell an interesting story.
Seller Model Breakdown
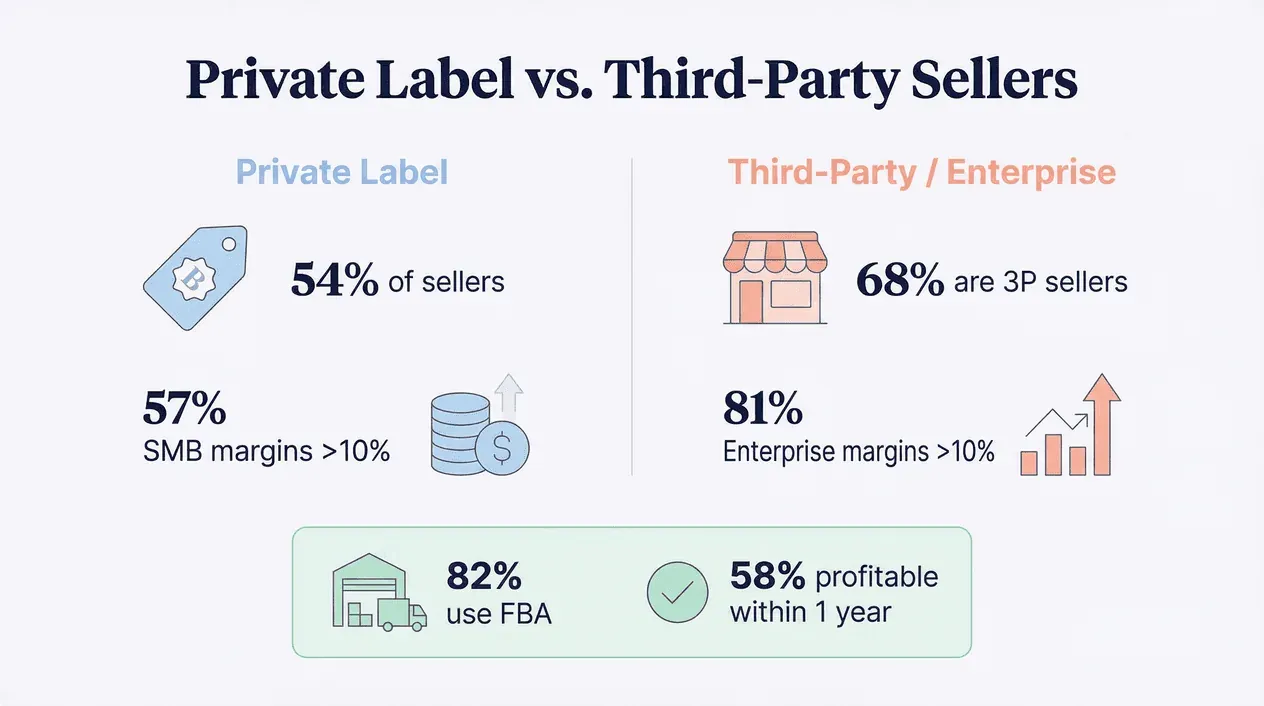
- 68% of sellers are third-party (3P) sellers (using Seller Central), while 54% use a private label model (Jungle Scout).
- 82% of sellers use FBA as their fulfillment method.
Performance Comparison: Key Metrics
Here’s a side-by-side look at the latest available KPIs (from Jungle Scout’s 2024 report):
| KPI | Amazon Sellers & SMBs | Enterprise Brands & Retailers |
|---|---|---|
| Share reporting >$1,000/month sales | 52% | – |
| Share reporting >$5,000/month sales | 30% | – |
| Share reporting >$100,000/month sales | – | 63% |
| Share reporting >$500,000/month sales | – | 40% |
| Net margin >10% | 57% | 81% |
| Net margin >20% | – | 54% |
| Lifetime profits threshold | 30% have >$50k | 85% have >$1M |
Key takeaways:
- Private label sellers (often SMBs) make up a large share of the marketplace, but enterprise brands are capturing higher margins and larger profits.
- More than half of SMB sellers are profitable within a year, and 19% of small business sellers average over $10,000/month in sales (Jungle Scout).
- Enterprise brands are more likely to report net margins above 20% and lifetime profits exceeding $1 million.
Private Label vs. Third-Party: Pros and Cons
- Private Label: Greater control over branding and pricing, but higher upfront investment and risk.
- Third-Party/Wholesale: Lower barriers to entry, but more competition and thinner margins.
In 2026, the edge goes to sellers who can carve out a niche—whether that’s through unique products, sharp pricing, or superior customer experience.
How Thunderbit Helps Sellers Turn Amazon Statistics Into Smarter Decisions
Scrape Amazon listings with Thunderbit Get Started Free
Let’s get practical. All these stats are great, but how do you actually use them to win on Amazon? That’s where Thunderbit comes in. As someone who’s spent years building and refining AI tools for business users, I’m a big believer in making data actionable—not just interesting.
Thunderbit’s AI Web Scraper: Your Amazon Data Sidekick
Thunderbit is an AI-powered Chrome Extension that lets you scrape Amazon product pages, rankings, reviews, and competitor data in just a couple of clicks. Here’s how sellers are using it in 2026:
- Competitive Analysis: Instantly pull pricing, stock status, and review data from top competitors. For example, one retailer used Thunderbit to monitor microwave pricing and spot when a competitor went out of stock—then adjusted their own pricing to capture more sales (Thunderbit case study).
- Category Opportunity Scanning: Scrape and analyze category pages to identify fast-growing niches, pricing bands, and review sentiment—perfect for spotting the next big trend.
- Fee and Margin Monitoring: With Amazon’s fee structure changing (again), Thunderbit helps sellers track SKU-level profitability by extracting all the data needed to model margins under the latest FBA and placement fees (Amazon Seller Central).
Thunderbit’s AI can even visit subpages (like product detail or review pages), enrich your data tables, and export everything to Excel, Google Sheets, Airtable, or Notion—no coding required.
Real-World Example: Outsmarting the Competition
A Thunderbit user in the home appliances category set up scheduled scrapes to monitor not just their own listings, but also competitor pricing and inventory. When a major rival ran low on stock, Thunderbit’s data flagged the opportunity, and the seller quickly adjusted their own inventory allocation and ad spend. The result? A 17% bump in weekly sales, all thanks to timely, actionable data.
Want to see it for yourself? Check out Thunderbit’s Amazon Product Scraper template or grab the Chrome Extension and try it on your own listings.
Use the Amazon Product Scraper Template
Regional Differences: Challenges and Opportunities for Amazon Sellers Worldwide
Amazon may be a global marketplace, but the playing field isn’t the same everywhere. Here’s how seller performance and opportunities differ by region:
Seller Distribution and Revenue by Region
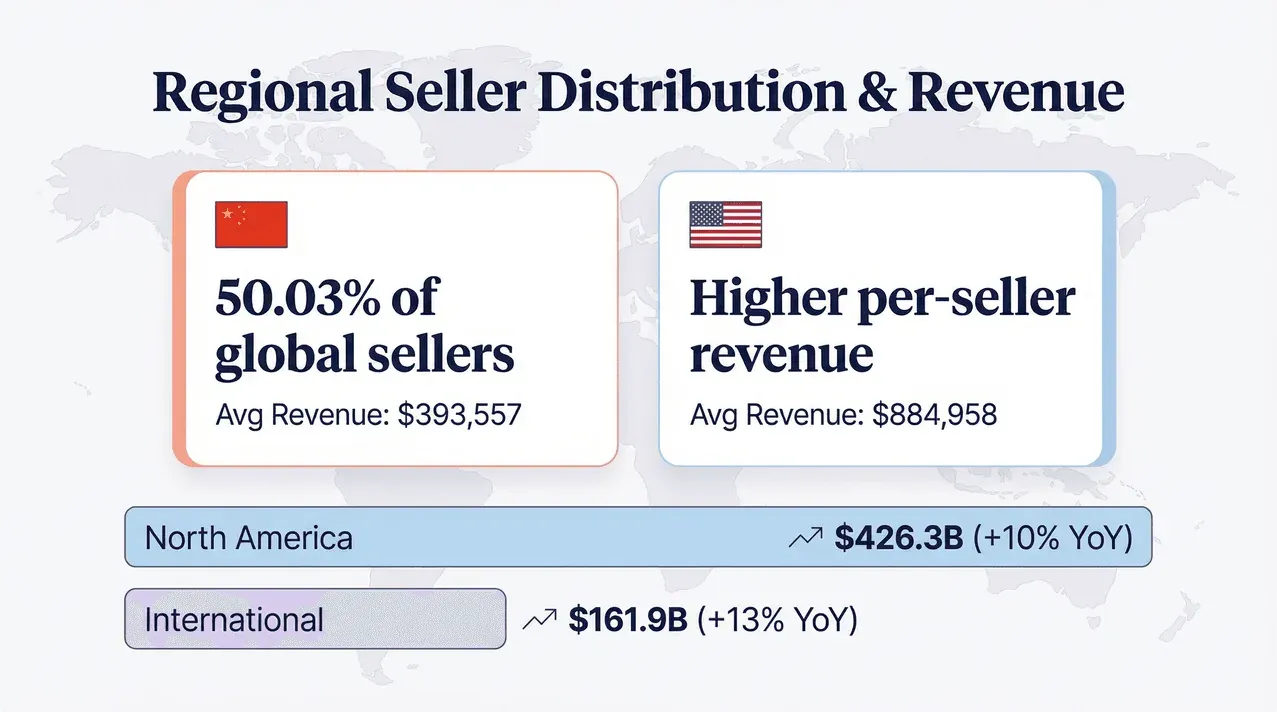
- Chinese Sellers: Now make up 50.03% of global active sellers, but capture only ~39% of third-party revenue worldwide.
- U.S. Sellers: In the U.S. marketplace, U.S.-based sellers generated ~$157B of $305B third-party GMV, averaging about $885,000 per seller—more than double the average for Chinese sellers (Marketplace Pulse).
Developed vs. Emerging Markets
- North America: Still the largest market by GMV, but growth is slowing as the market matures.
- International Markets: Amazon’s international segment grew 13% YoY in 2025, outpacing North America’s 10% growth.
- Emerging Markets: Countries like Saudi Arabia, South Africa, and Singapore offer higher traffic-per-seller ratios (e.g., Saudi Arabia ~8,228 visits per seller), but with lower overall traffic ceilings (Marketplace Pulse).
Regional Challenges and Opportunities
- Regulatory Hurdles: Sellers in Europe and Latin America face more complex compliance and tax requirements.
- Market Entry Barriers: Developed markets have higher competition, but also larger average order values and more sophisticated buyers.
- Growth Potential: Emerging markets offer less competition and higher traffic density, but require careful TAM (total addressable market) analysis.
For sellers considering global expansion, the data suggests a hybrid approach: leverage established markets for volume, but don’t ignore the explosive growth in select emerging regions.
Amazon Seller Statistics at a Glance: 2026 Top Stats
Here are the headline numbers you’ll want to keep handy (and maybe even cite in your next investor update):
- Amazon’s 2025 Net Sales: $716.9B
- Estimated Global GMV: $830B
- Third-Party Seller GMV: $575B
- Active Sellers Worldwide (end of 2025): ~1.65M
- Chinese Sellers’ Share of Active Sellers: 50.03%
- Beauty & Personal Care Category Growth: +23% unit sales, +22% revenue YoY
- Cosmetics Revenue Growth: +38% YoY
- Arts, Crafts & Sewing Revenue Growth: +26% YoY
- Top 1.6% of Sellers Generate 50% of U.S. 3P GMV: <8,000 sellers
- Thunderbit Users Can Scrape Amazon Data in 2 Clicks: (Thunderbit Chrome Extension)
Key Trends and Actionable Insights for 2026
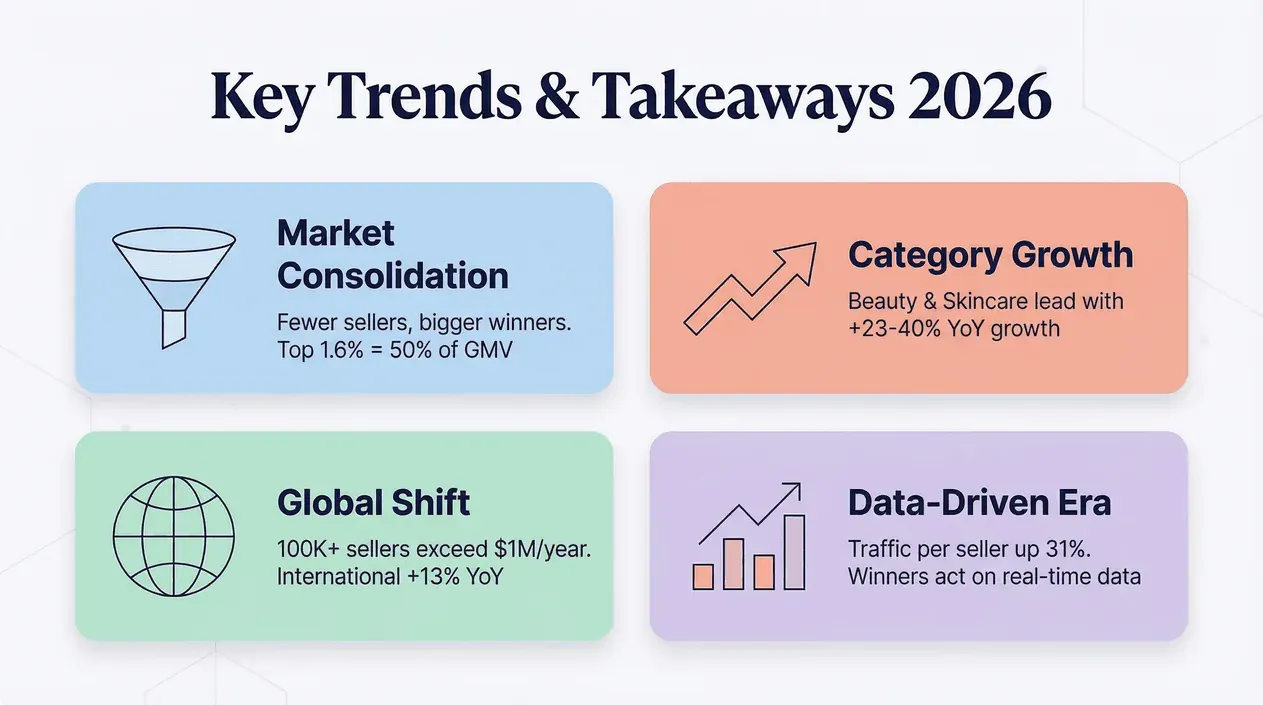
Let’s wrap up with the most important takeaways for Amazon sellers and brands in 2026:
- Marketplace Growth Is Outpacing Seller Growth: With fewer active sellers and higher GMV, the average “slice of the pie” is bigger—but only for those who can compete on price, service, and data-driven agility.
- Category Growth Is Uneven: Beauty, personal care, and creative hobbies are leading the charge, while some traditional categories are stagnating.
- Private Label Is Still Powerful, but Margins Are Tighter: The most successful sellers are those who can differentiate, manage costs, and respond quickly to market shifts.
- Regional Expansion Is a Double-Edged Sword: Emerging markets offer growth, but require careful planning and local expertise.
- Data Is the New Moat: Sellers who leverage tools like Thunderbit for real-time competitive intelligence, pricing, and review analysis are outpacing the competition.
If you’re serious about winning on Amazon in 2026, it’s time to get serious about your data stack. Whether you’re tracking category trends, monitoring fees, or scouting new markets, the right statistics—and the right tools—can make all the difference.
References and Further Reading
- Amazon 2025 Form 10-K
- Marketplace Pulse: Amazon Seller Registrations Hit Decade Low in 2025
- Marketplace Pulse: Top 1.6% of Sellers Drive 50% of Amazon’s 3P GMV
- Marketplace Pulse: China Reaches Global Majority on Amazon
- Jungle Scout: Amazon Market Trends – Cosmetics
- Jungle Scout: Amazon Market Trends – Eye Skincare
- Jungle Scout: Amazon Market Trends – Body Skincare
- Thunderbit: Amazon Product Scraper Template
- Thunderbit: Retailer Price Monitoring Case Study
For more tips and deep dives on scraping, automation, and e-commerce trends, check out the Thunderbit Blog. You may also like: What Is Data Scraping and How to Do It in 2025 and How to Scrape Any Website Using AI.
FAQs
1. How many active Amazon sellers are there in 2026?
By the end of 2025, roughly 1.65 million sellers were active worldwide, down from over 2.4 million in 2021. We don't have a clean mid-2026 count yet — Marketplace Pulse usually refreshes this once a year.
2. Which Amazon categories are growing the fastest in 2026?
Beauty & Personal Care, Cosmetics, and Body Skincare are leading the pack, with revenue growth rates of 22–40% YoY.
3. What’s the average revenue per Amazon seller in the U.S. vs. China?
In the U.S., the average revenue per seller is about $885,000, compared to about $394,000 for Chinese sellers.
4. How can Thunderbit help Amazon sellers make better decisions?
Thunderbit enables sellers to scrape and analyze Amazon product, pricing, and review data in real time—helping with competitive analysis, margin monitoring, and category trend spotting.
5. Is it easier or harder to succeed as a new Amazon seller in 2026?
It’s both: There are fewer new sellers entering the market (registrations down 44% YoY), but competition is fierce and success depends on smart category selection, data-driven strategy, and operational agility.
Ready to level up your Amazon strategy? Try Thunderbit’s Chrome Extension for free, and let the data work for you.
Try Thunderbit AI Web Scraper for Amazon research Get Started Free