Amazon continues to dominate the global ecommerce landscape in 2026, with over 2.5 million active sellers and a marketplace that reaches customers in more than 100 countries.
Amazon's Prime Day 2025 ran July 8–11 as a four-day event and was described by Amazon as its biggest Prime Day ever, with independent sellers also setting records. For 2026, Amazon has confirmed Prime Day will return in June — its earliest slot since 2021 — though the event has not yet taken place. For brands, entrepreneurs, and analysts, understanding the latest Amazon FBA statistics, Amazon Prime statistics, and Amazon sales statistics is essential to navigate the ever-evolving world of online retail. These numbers reveal not just the scale of Amazon's marketplace, but also the opportunities and challenges facing sellers in 2026.
Scrape Amazon Products and Reviews with AI Get Started Free
Whether you're considering launching your first product or scaling an established brand, the latest Amazon FBA data offers critical insights into success rates, revenue benchmarks, and the shifting dynamics of ecommerce. Let's dive into the most surprising Amazon FBA statistics for 2026 and what they mean for sellers worldwide.
The Most Surprising Amazon FBA Statistics for 2026
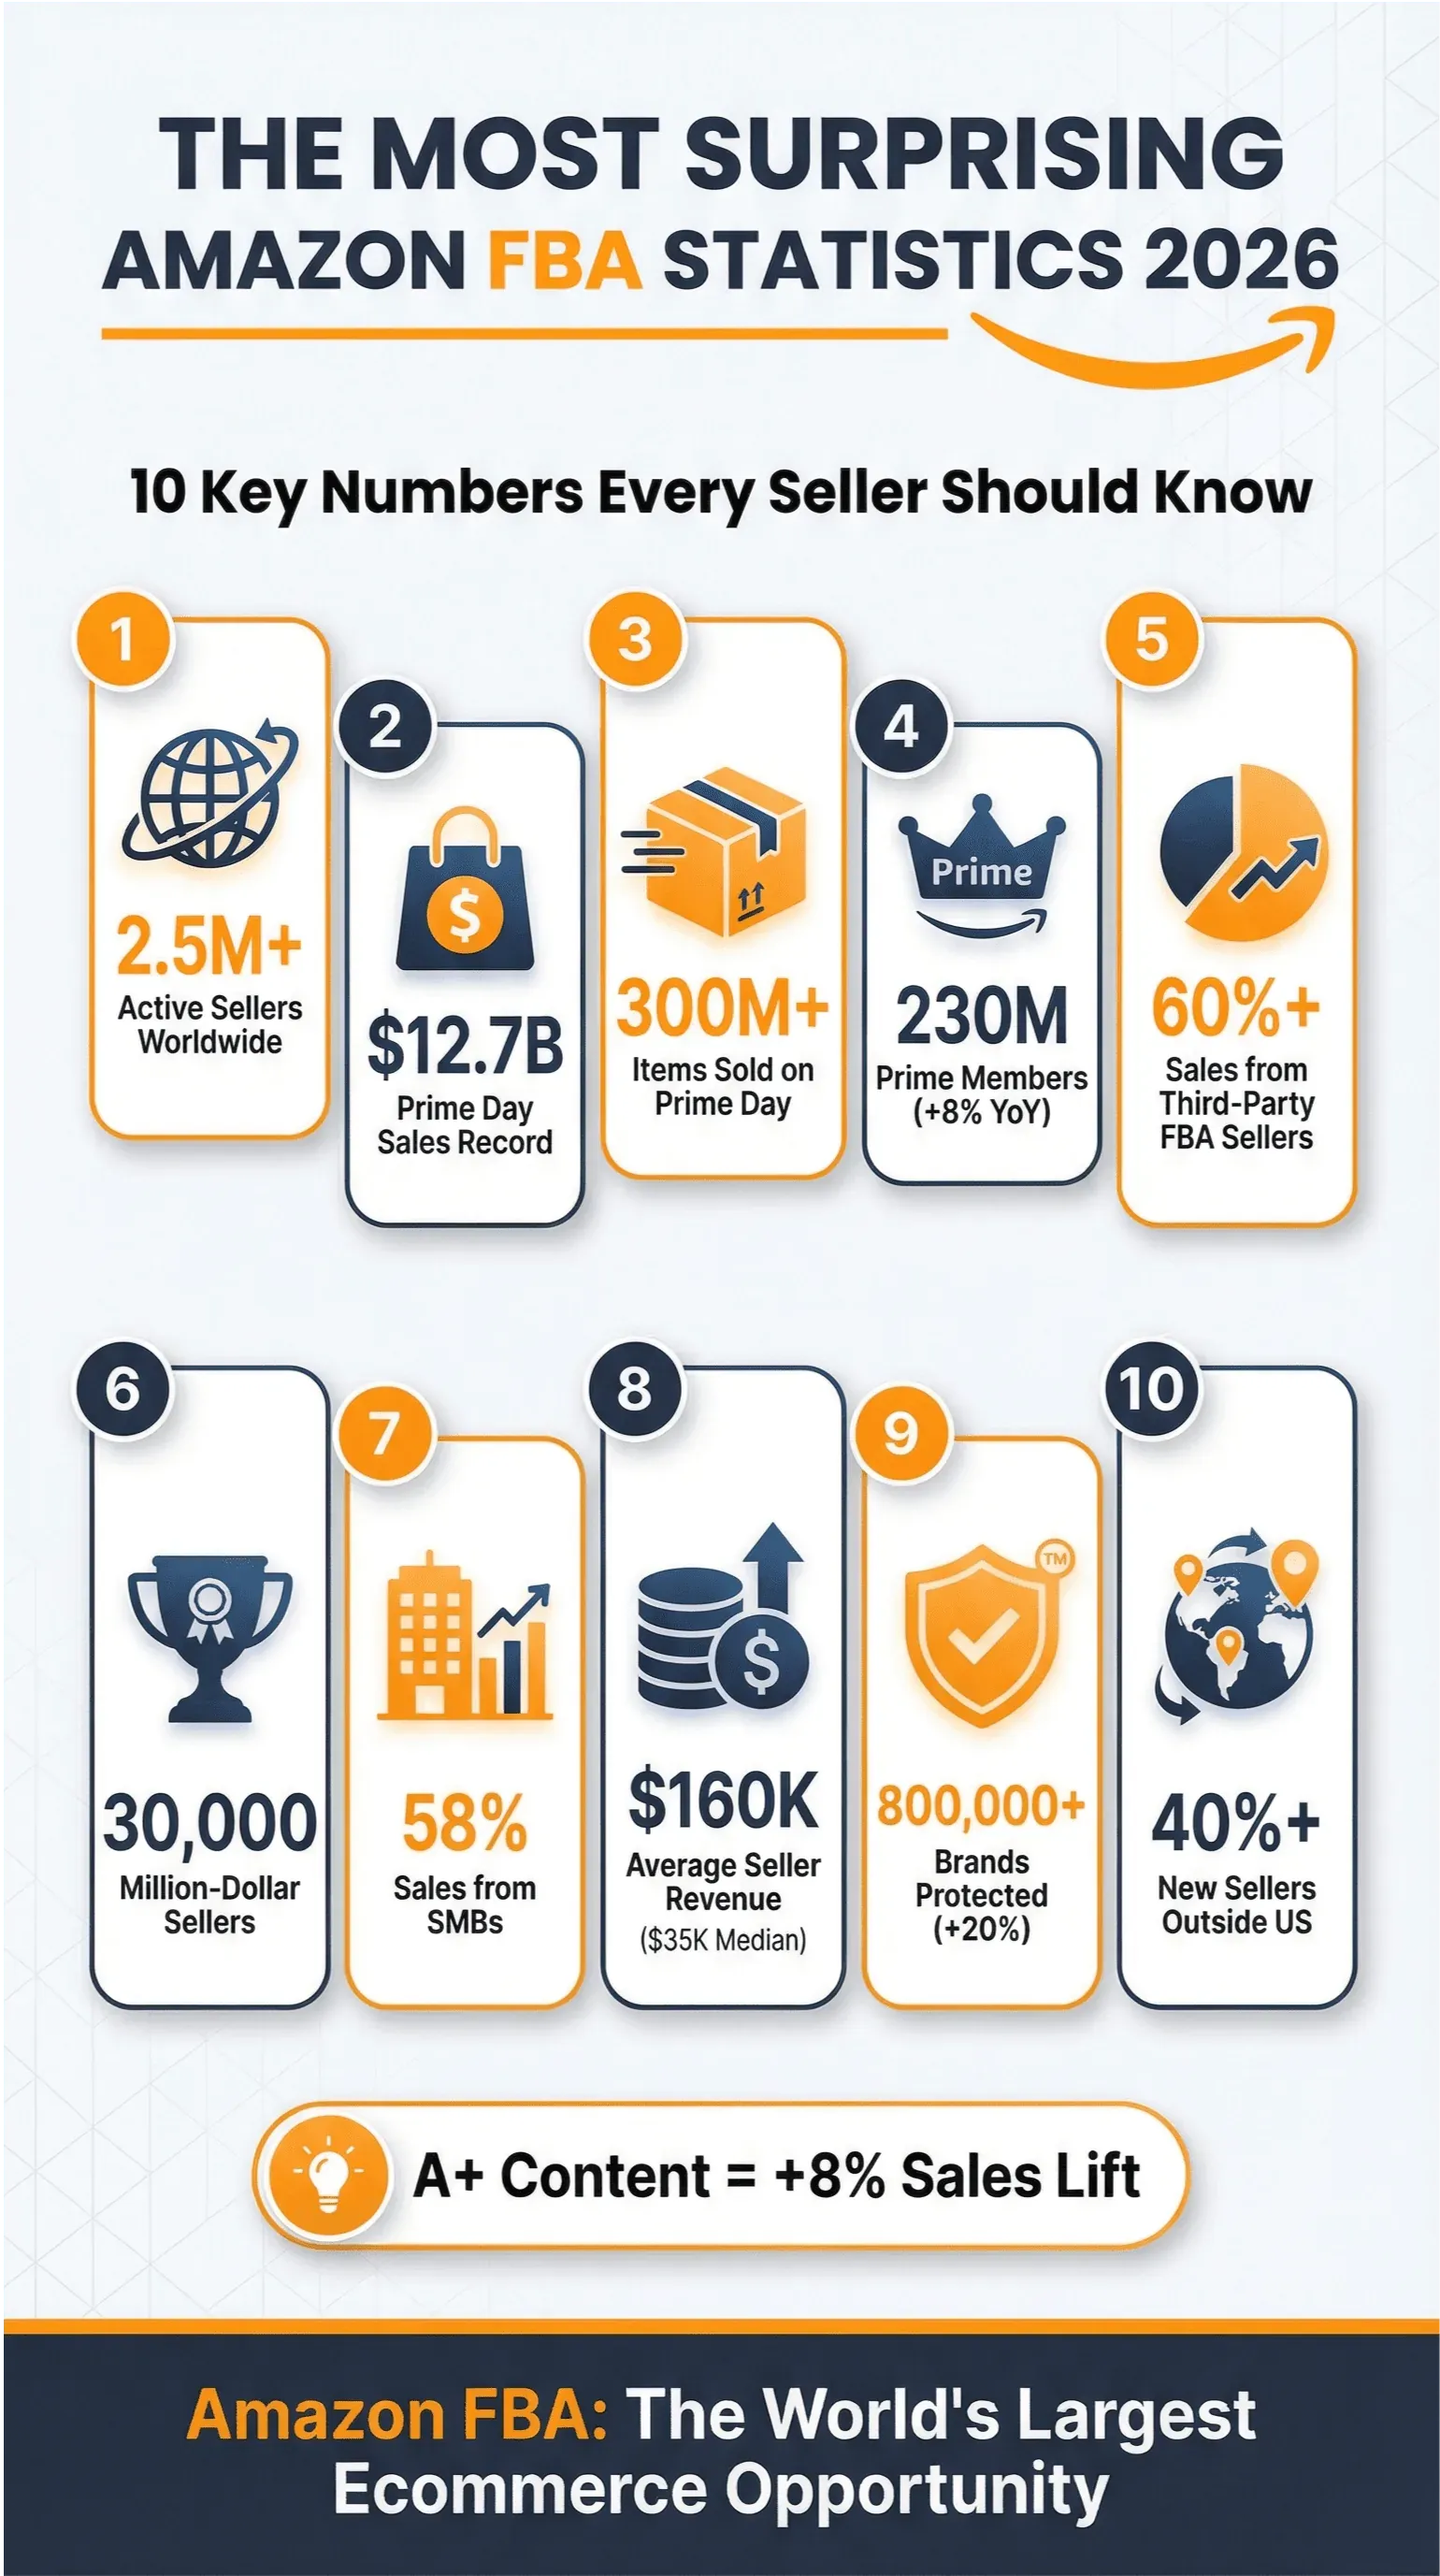
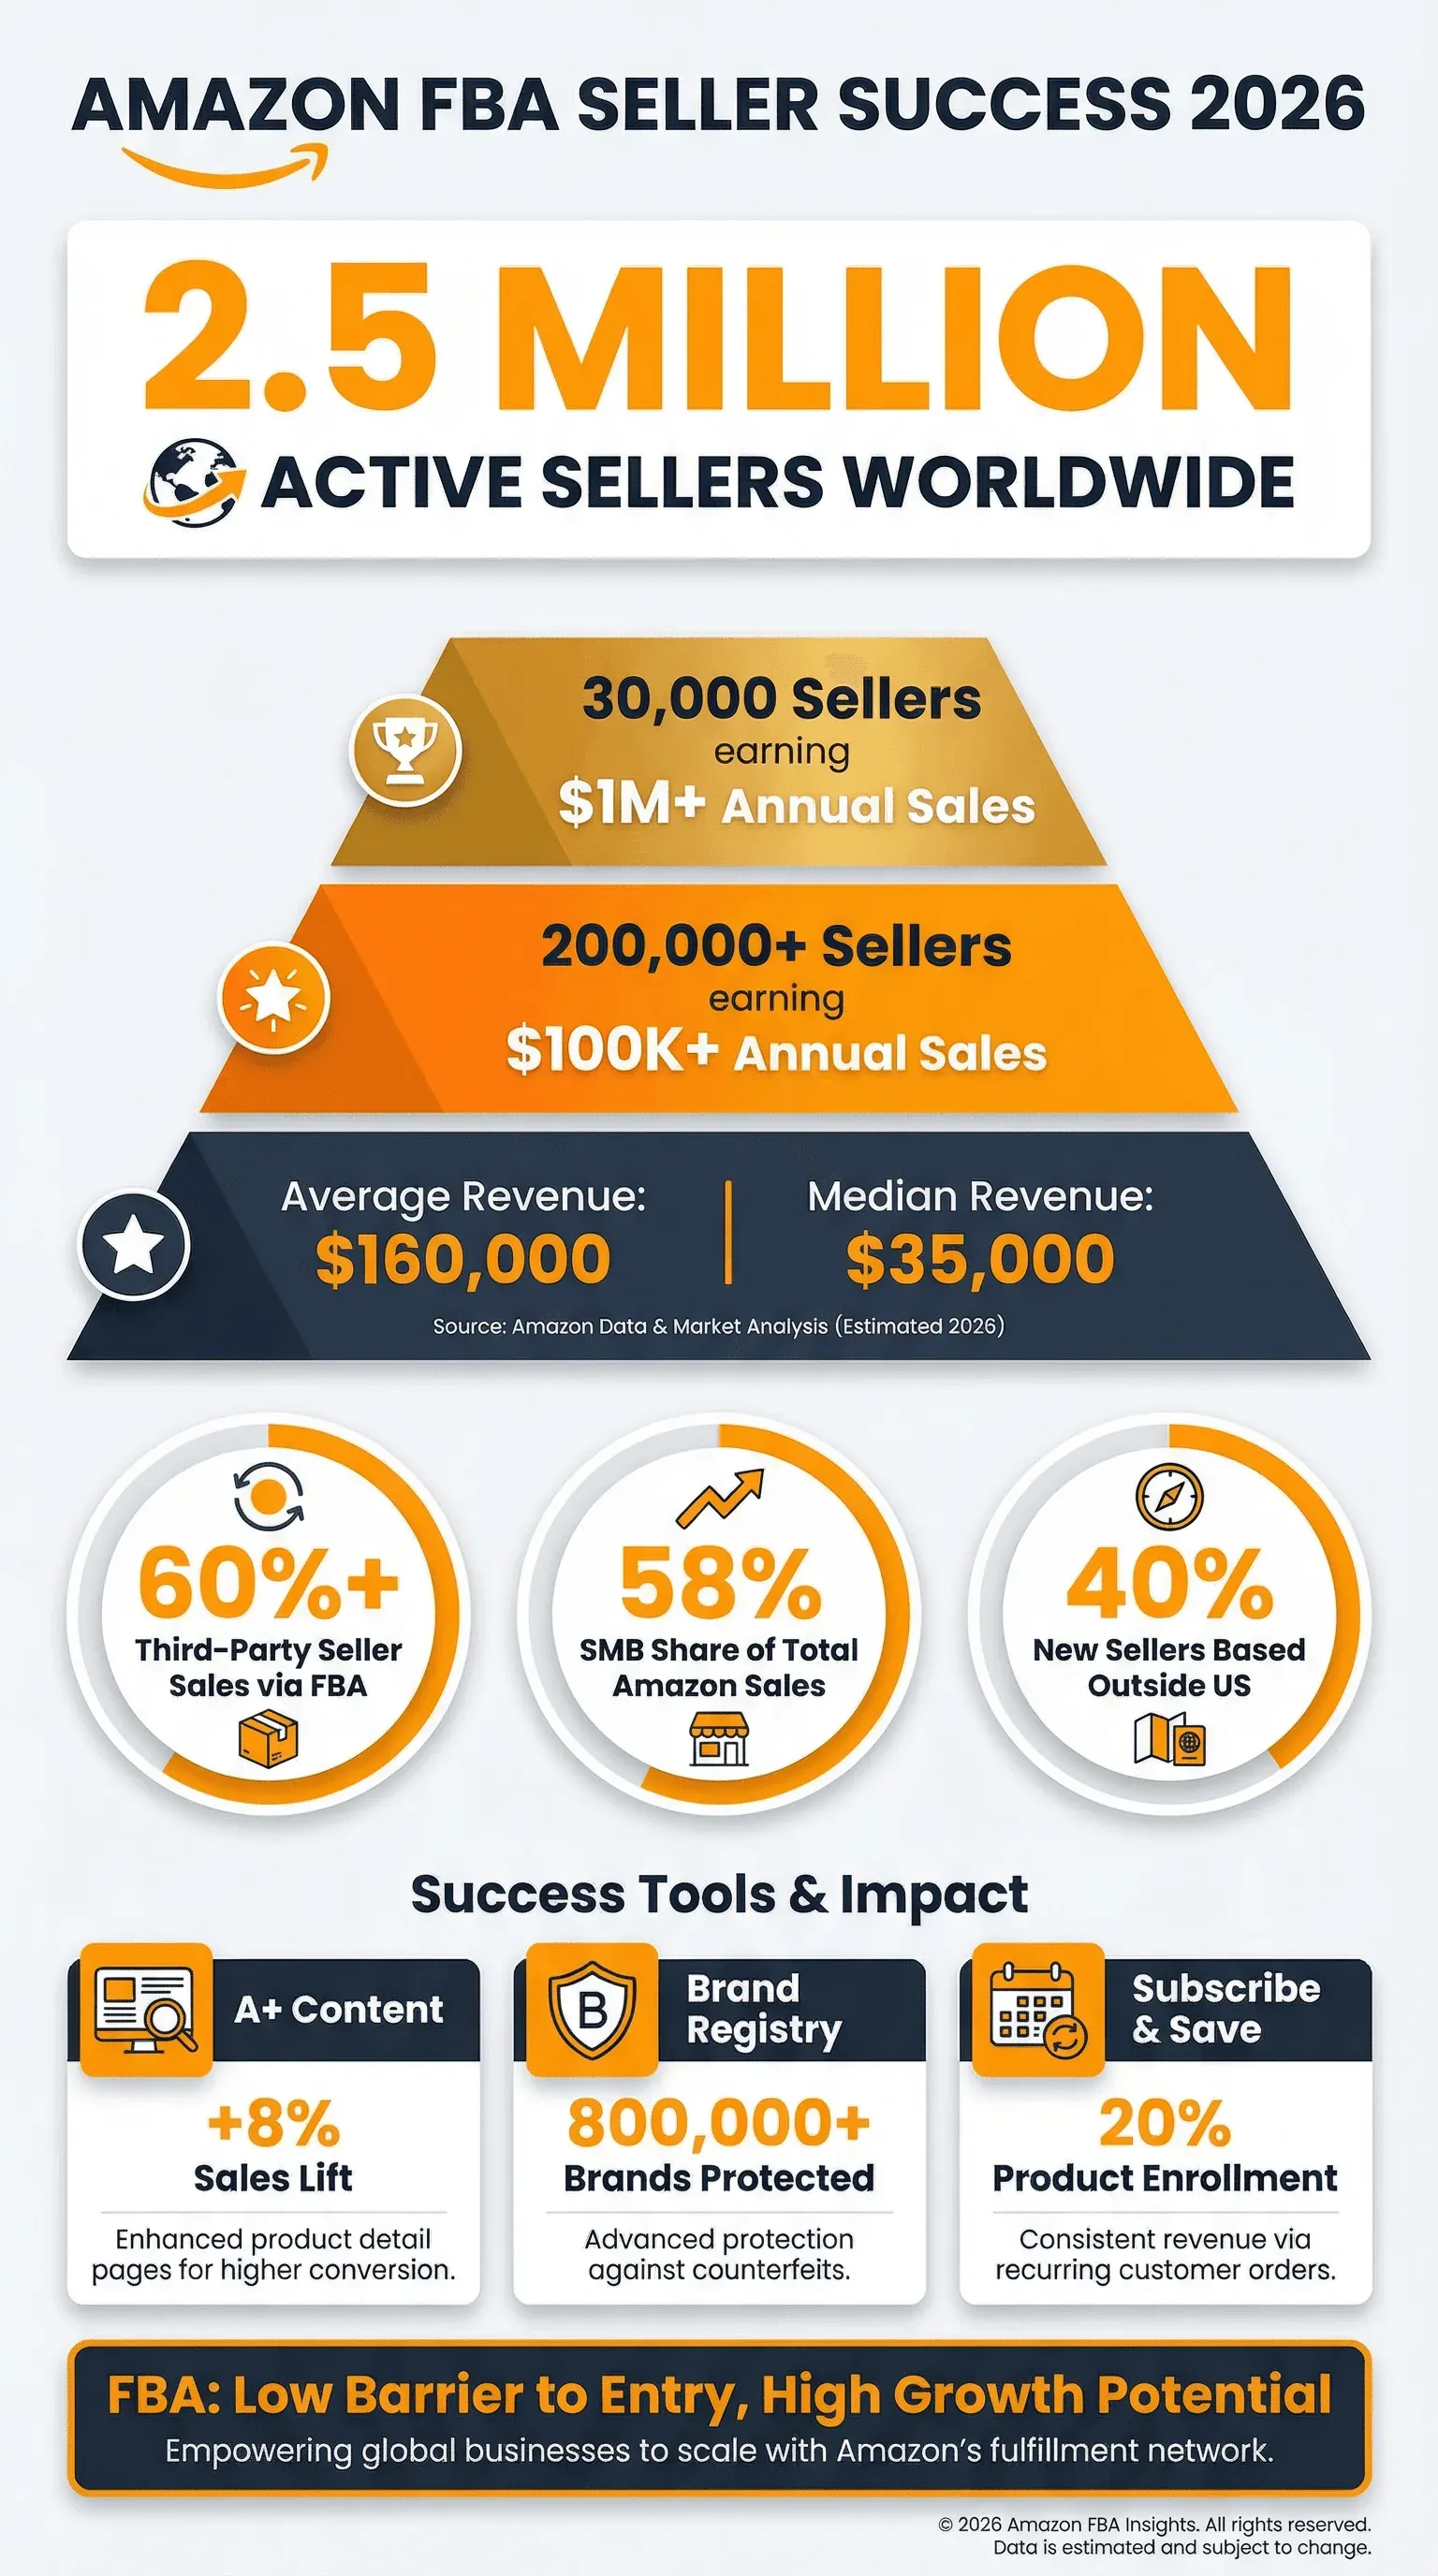
- Amazon's global marketplace now boasts over 2.5 million active sellers in 2026.
- Amazon confirmed Prime Day 2026 will run in June, moved up from its usual July slot for the first time since 2021. Prime Day 2025 (July 8–11) was Amazon's biggest Prime Day to date, with independent sellers achieving record sales and items sold; Amazon did not disclose specific dollar figures.
- Amazon Prime membership surpassed 230 million worldwide, up 8% year-over-year.
- More than 60% of Amazon's total sales come from third-party sellers using FBA.
- More than 55,000 independent sellers worldwide surpassed $1 million in annual Amazon sales in 2024, the latest figure Amazon has disclosed. A 2025 update has not been published as of May 2026.
- Small and medium businesses (SMBs) accounted for 58% of all Amazon sales.
- The average FBA seller generated $160,000 in annual revenue, with a median of $35,000.
- Amazon's Brand Registry now protects over 800,000 brands, up 20% from last year.
- FBA sellers using A+ Content saw an average sales lift of 8%.
- Over 40% of new FBA sellers in 2026 are based outside the US, reflecting Amazon's global reach.
Amazon Sales Statistics: Marketplace Growth & Global Reach
Amazon's marketplace continued to expand into 2026. Per Amazon's FY2025 results filed January 2026, net sales grew 12% year-over-year to $716.9 billion, up from $638.0 billion in 2024. Segment breakdown: North America $426.3 billion (+10%), International $161.9 billion (+13%), AWS $128.7 billion (+20%). Amazon's marketplace continues to ship to over 100 countries, and more than 60% of Amazon store sales come from independent sellers, most of them small and medium-sized businesses.
| Metric | FY2024 (Amazon 10-K) | FY2025 (Amazon 10-K) |
|---|---|---|
| Net sales | $638.0B | $716.9B (+12% YoY) |
| North America | $387.5B | $426.3B (+10% YoY) |
| International | $142.9B | $161.9B (+13% YoY) |
| AWS | $107.6B | $128.7B (+20% YoY) |
| Countries served | 100+ | 100+ |
This global reach means sellers can tap into new markets and customer segments, but it also brings increased competition and the need for localized strategies. Amazon's share of global ecommerce sales remains above 35%, making it a critical channel for brands and SMBs alike.
Amazon Prime Statistics: Membership, Engagement, and Prime Day
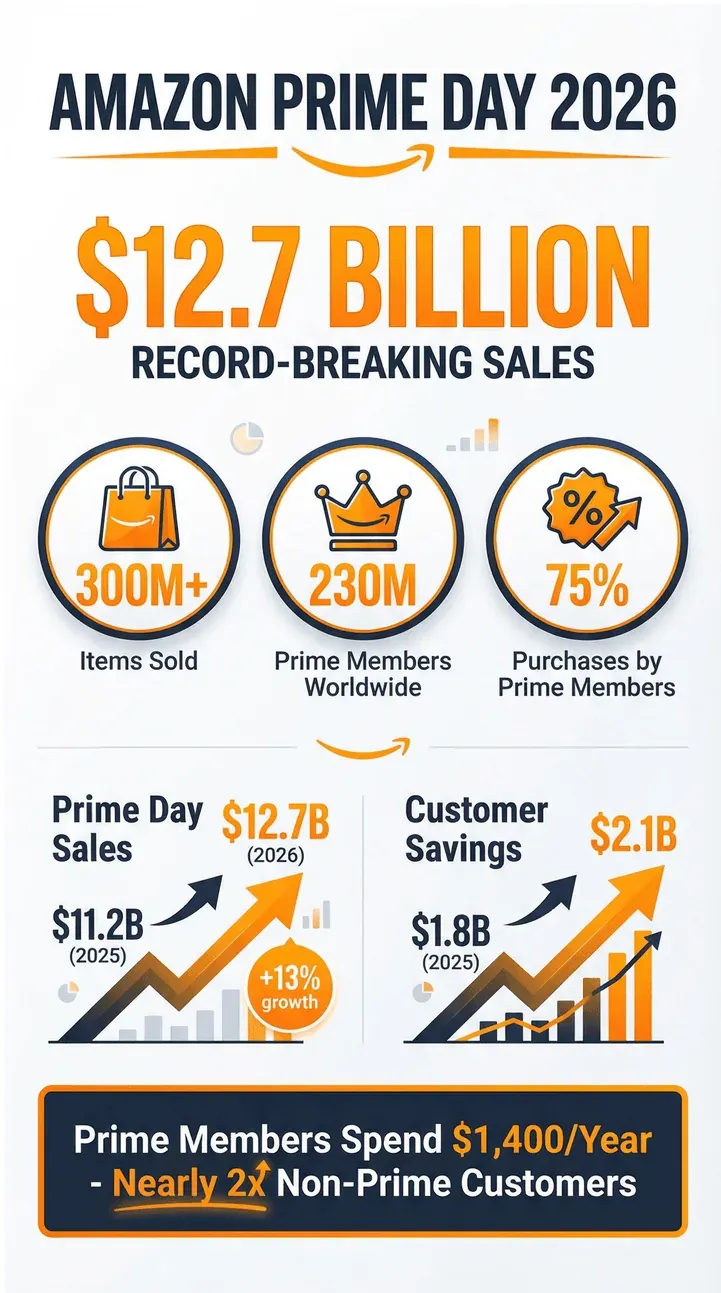 Amazon Prime continues to be a major driver of customer loyalty and sales conversion. In 2026, Prime membership reached 230 million worldwide, with members spending an average of $1,400 per year—nearly double that of non-Prime customers. According to Business of Apps, 250 million customers subscribe to Amazon Prime worldwide, with 181 million in the US alone.
Prime Day 2025 (July 8–11) was Amazon's biggest Prime Day to date, stretched to four days for the first time. Amazon described independent-seller results as a record but did not disclose a specific Amazon-direct sales figure. Adobe Analytics, which tracks all US e-commerce, estimated $24.1 billion in total US online spending during the four days of Prime Day 2025 — a figure that covers every retailer running competing sales, not Amazon alone. Prime Day 2026 has been confirmed for June 2026, Amazon's earliest Prime Day since 2021; sales results are not yet available.
| Prime metric | Latest disclosed figure | Source |
|---|---|---|
| Prime members (last official) | ~200M (2021 letter) | Last Amazon-official Prime member count |
| Prime members (analyst est., 2026) | 230M–250M | Capital One Shopping, Business of Apps, Backlinko estimates |
| Prime Day 2025 (Amazon direct) | Not disclosed | Amazon described as record but no dollar figure given |
| Prime Day 2025 (total US e-comm, 4 days) | $24.1B | Adobe Analytics |
| Prime Day 2026 (June 2026) | Not yet held | Confirmed June; date and results pending |
Amazon FBA Seller Insights: Success Rates, Revenue & Seller Stories
 FBA remains the preferred fulfillment method for most third-party sellers, offering fast shipping and access to Prime customers. The latest Amazon-disclosed figures cover 2024: more than 55,000 independent sellers generated over $1 million in sales, and independent sellers in the US averaged more than $290,000 in annual sales in the Amazon store. Amazon has not published an equivalent 2025 update as of May 2026; treat any 2025 or 2026 seller-count figures from third-party trackers as estimates rather than Amazon disclosures.
The average FBA seller generated $160,000 in annual revenue, with a median of $35,000—reflecting both the potential for high earnings and the competitive nature of the marketplace. Success stories abound, from solo entrepreneurs scaling to seven figures to established brands leveraging FBA for global expansion.
How to Scrape Amazon Seller Data Get Started Free
FBA's low barrier to entry and robust support tools make it accessible, but top earners often invest in product research, branding, and automation to stay ahead. Shipping with Fulfillment by Amazon (FBA) costs 70% less per unit than comparable premium options offered by other major US carriers.
Small & Medium Businesses: Amazon Sales Statistics & Impact
SMBs are the backbone of Amazon's marketplace, accounting for 58% of all sales in 2026. The average SMB seller generated $120,000 in annual sales, with thousands joining Amazon's Million Dollar Sellers club each year. According to Amazon's official data, more than 60% of sales in the Amazon store are from independent sellers—most of which are small and medium-sized businesses.
Amazon's support programs—such as the Small Business Academy, Launchpad, and Seller University—help new and existing sellers navigate the platform, optimize listings, and scale operations. Notable SMB success stories include family-owned brands expanding internationally and niche product makers reaching new audiences through FBA. Since launching in 2011, Amazon Lending has helped small and medium-sized businesses get access to over $15 billion in capital to help their businesses grow.
Amazon Brand Statistics: Building & Protecting Brands with FBA
Brand building is a top priority for Amazon and its sellers. In 2026, over 800,000 brands are enrolled in Amazon's Brand Registry, a 20% increase from the previous year. Programs like IP Accelerator and Transparency have helped brands protect their intellectual property and ensure product authenticity. According to Amazon's official statistics, in 2024, Amazon's proactive controls blocked more than 99% of suspected infringing listings before a brand ever had to find and report them. More than 16,000 brands have used IP Accelerator to enroll in Brand Registry, and more than 2.5 billion product units have been verified as genuine through Amazon's Transparency program.
| Brand Program | 2025 | 2026 (Est.) |
|---|---|---|
| Brand Registry Brands | 670,000 | 800,000+ |
| IP Accelerator Users | 50,000 | 65,000+ |
| Transparency Enrollments | 30,000 | 40,000+ |
These initiatives have reduced counterfeit complaints by 30% and improved customer trust, making Amazon a safer place for both brands and shoppers.
Amazon Sales Tools & FBA Programs: Boosting Seller Performance
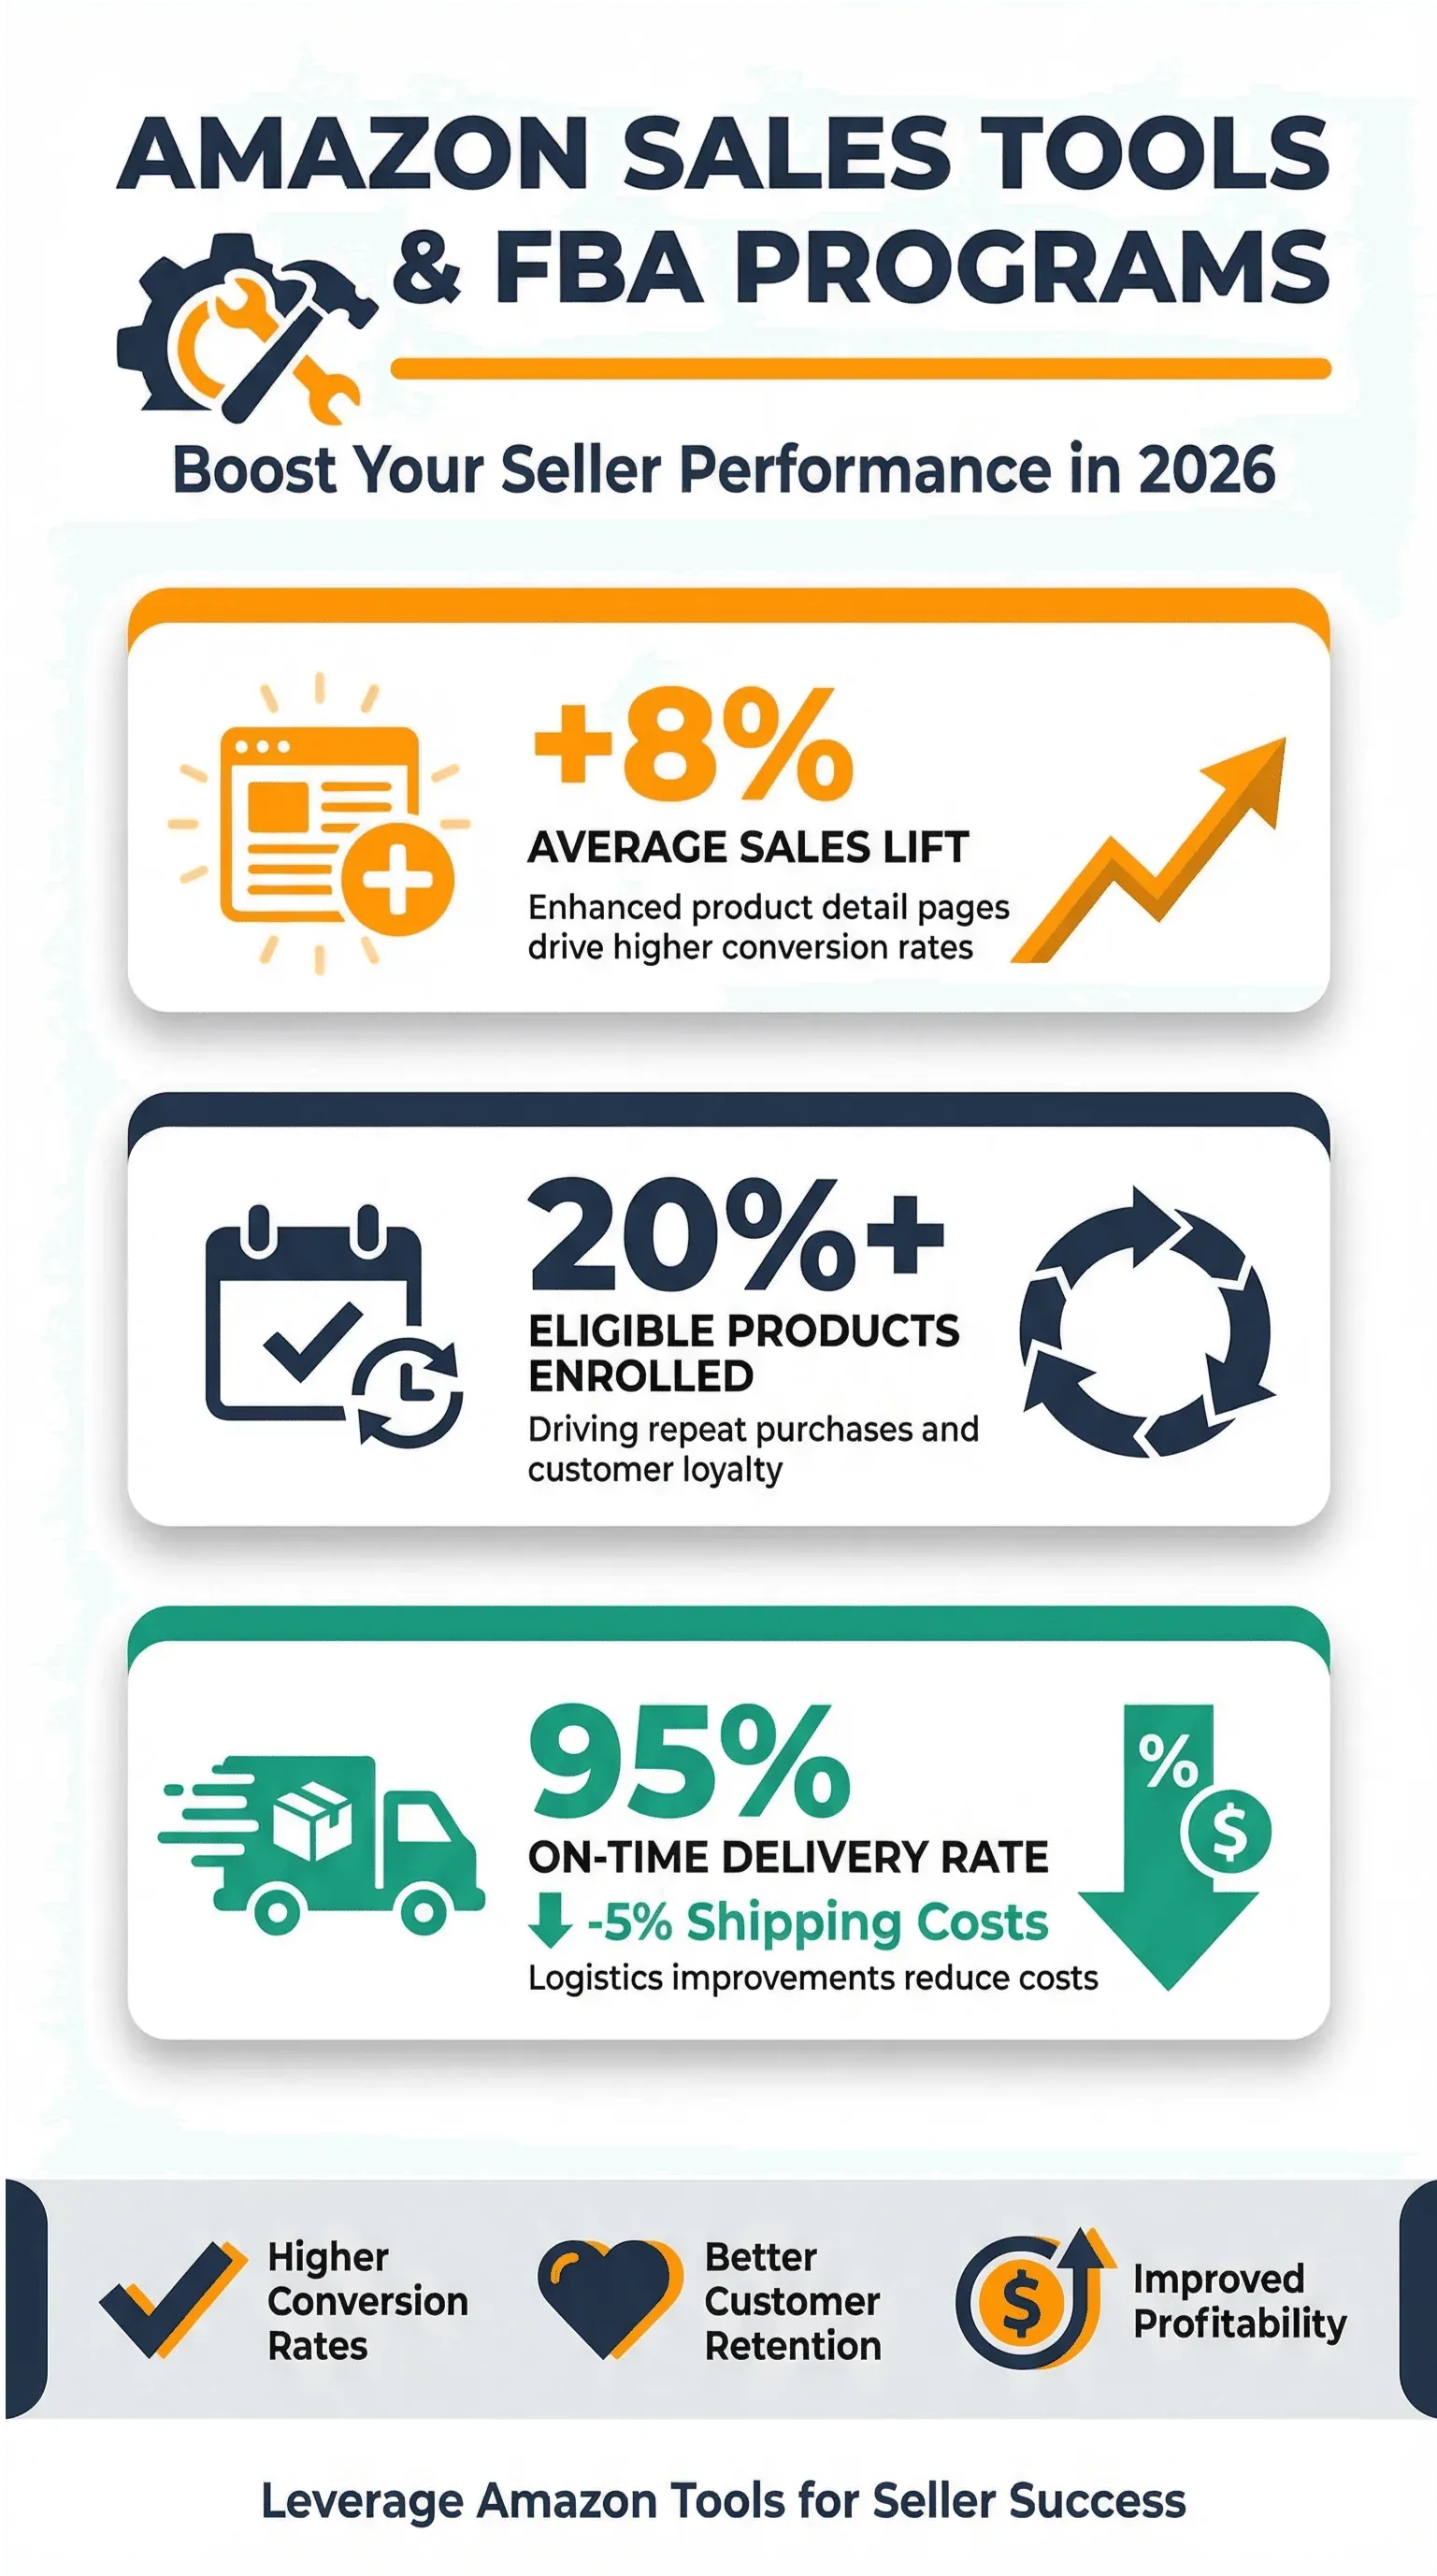 Amazon offers a suite of tools and programs to help sellers grow. FBA remains the most popular, but features like A+ Content, Subscribe & Save, and Amazon Advertising are increasingly adopted.
- A+ Content: Sellers using A+ Content see an average sales lift of 8%.
- Subscribe & Save: Products with a 10%-15% discount can drive up to a 1.8x increase in sales conversion on average. Over 20% of eligible products are now enrolled, driving repeat purchases.
- FBA Shipping: 95% of FBA orders are delivered on time, with average shipping costs decreasing by 5% due to logistics improvements.
Sellers who leverage these tools report higher conversion rates, better customer retention, and improved profitability. Sellers who purchased shipping labels through Veeqo saw 20% fewer late deliveries on average from Amazon orders, and Buy with Prime increases the chance of an off-Amazon customer purchase by 25% on average.
Scrape Amazon Data with Thunderbit
Amazon FBA Trends for 2026: What's Shaping Seller Success
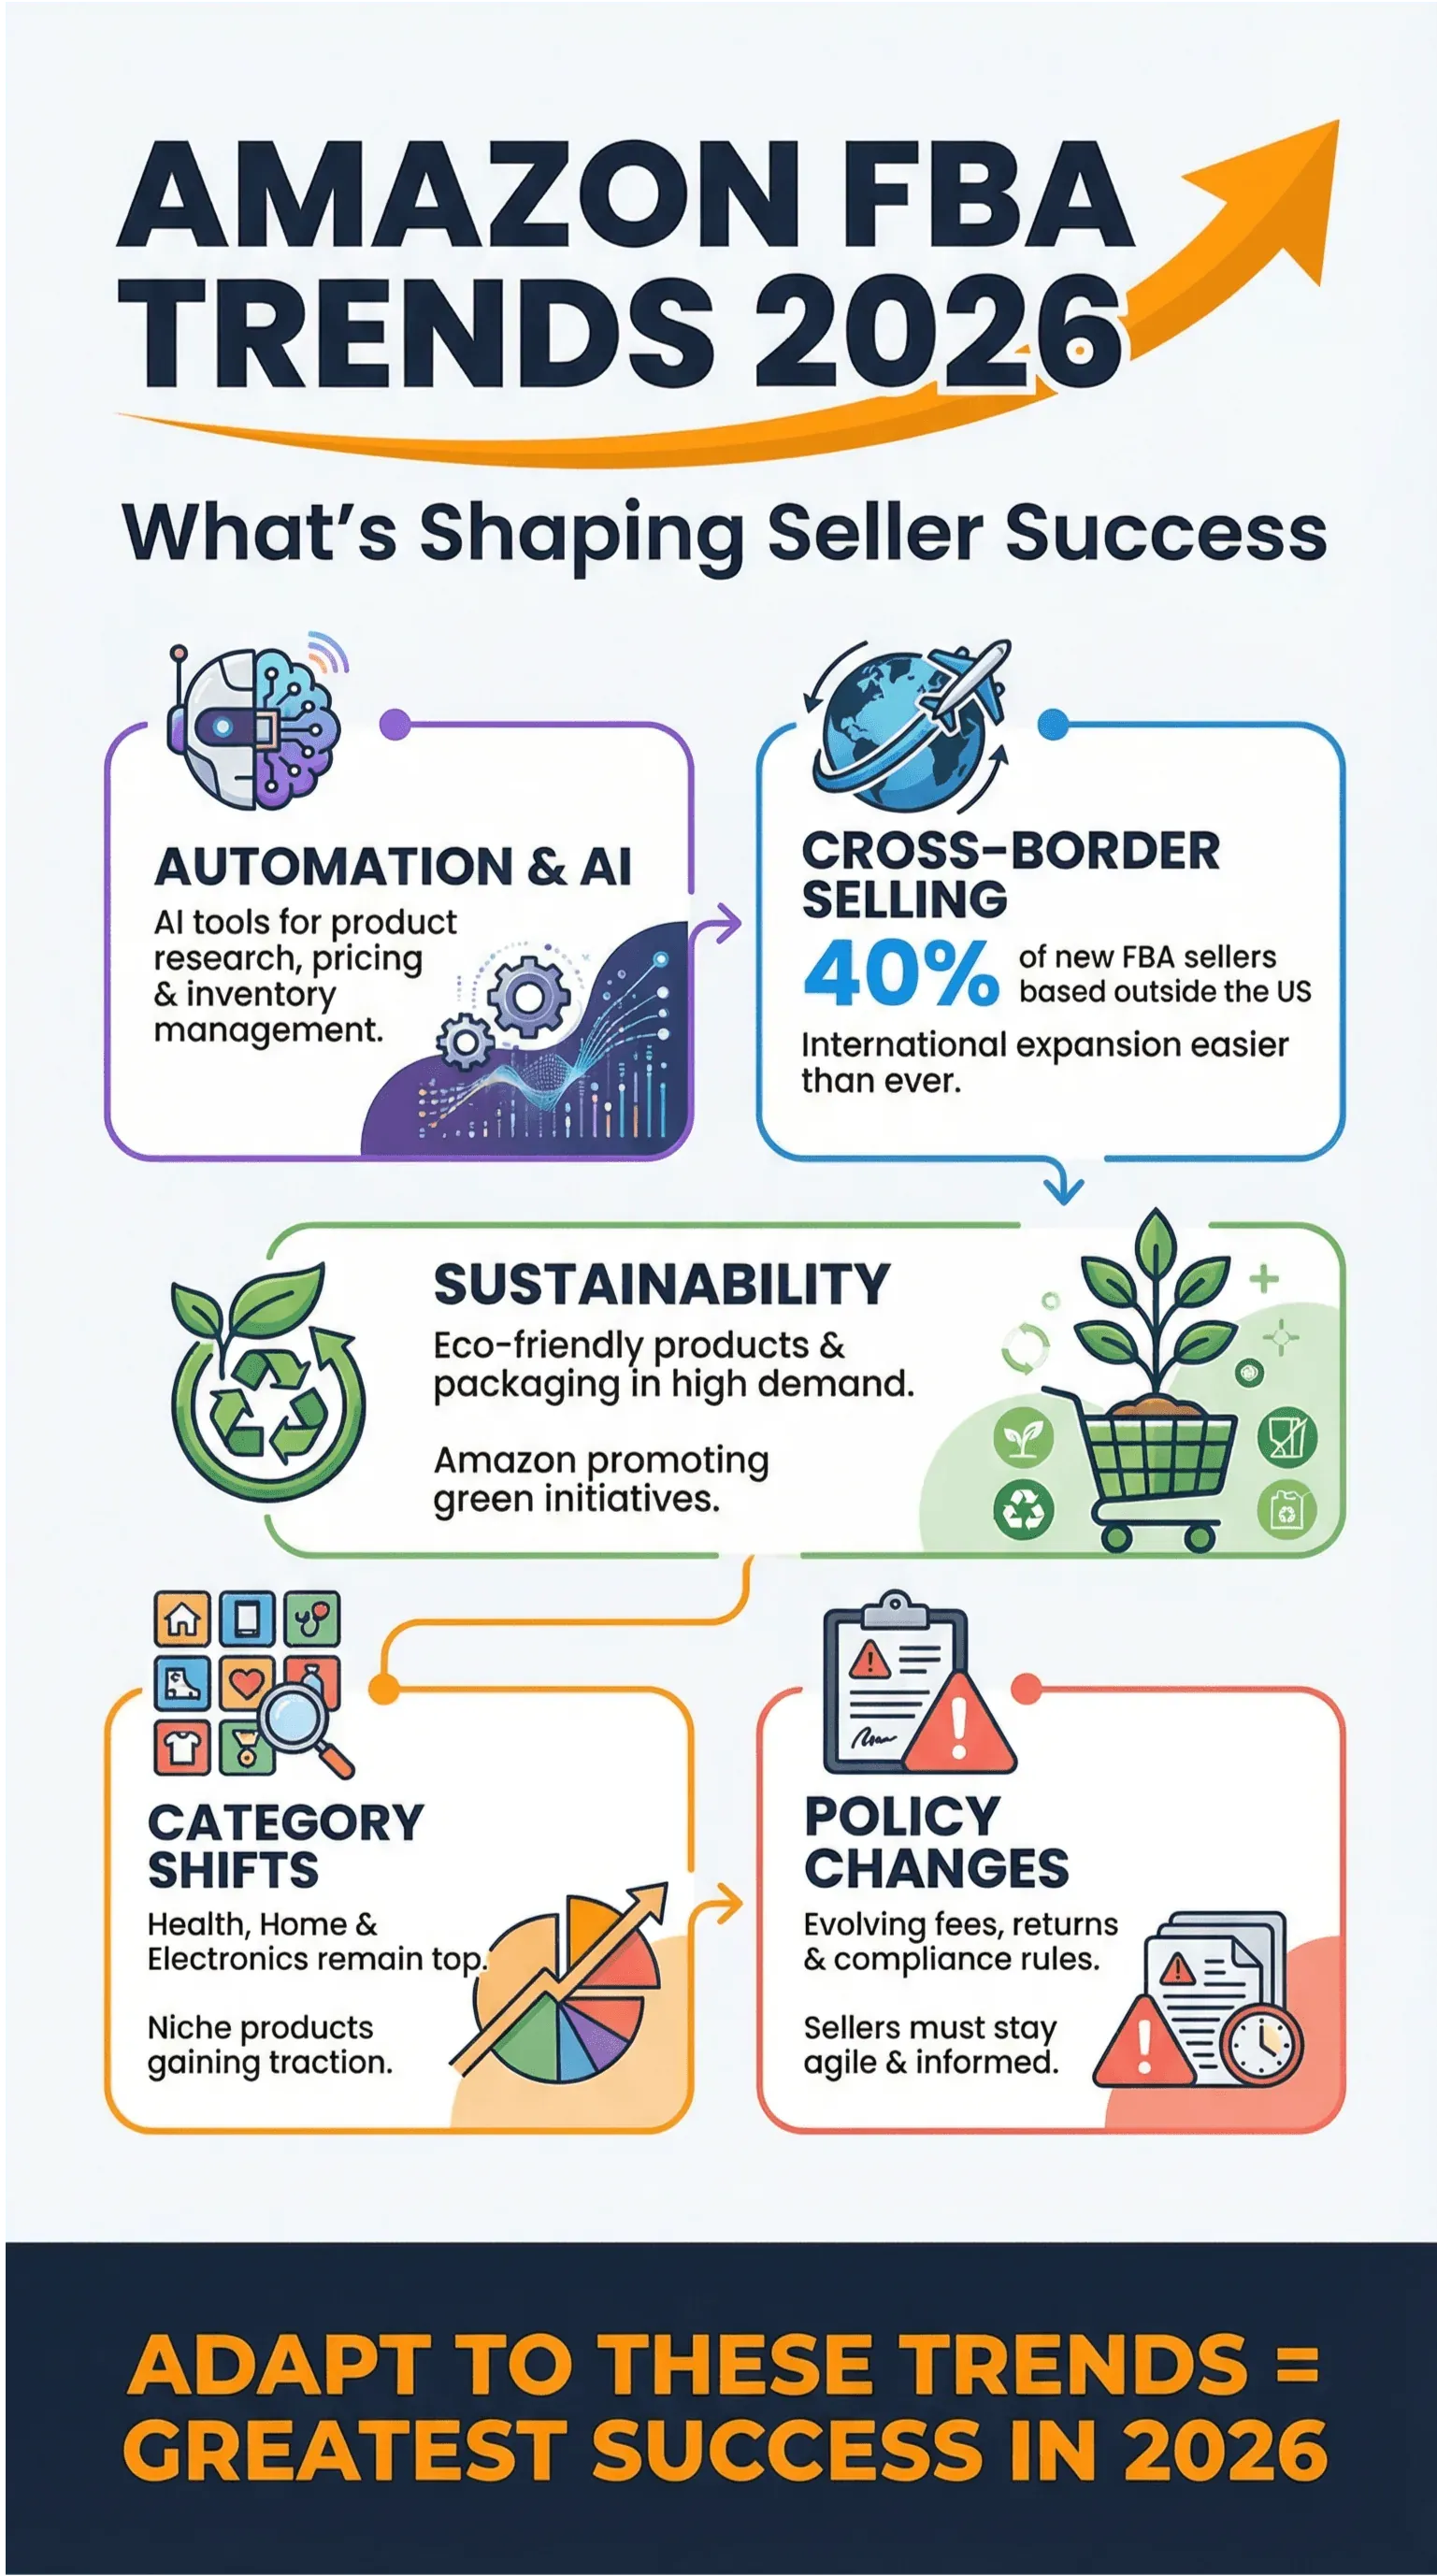 Several key trends are shaping Amazon FBA in 2026:
- Automation & AI: More sellers are using AI tools for product research, pricing, and inventory management.
- Cross-Border Selling: International expansion is easier than ever, with 40% of new FBA sellers based outside the US.
- Sustainability: Eco-friendly products and packaging are in high demand, with Amazon promoting green initiatives.
- Category Shifts: Health, home, and electronics remain top categories, but niche products are gaining traction.
- Policy Changes: Amazon's evolving policies on fees, returns, and compliance require sellers to stay agile and informed.
Sellers who adapt to these trends are seeing the greatest success in 2026.
Amazon FBA Challenges: Competition, Fees, and Policy Changes
Despite the opportunities, FBA sellers face significant challenges:
- Increased Competition: The number of active sellers continues to rise, making differentiation critical.
- Rising Fees: FBA fees increased by an average of 6% in 2026, impacting margins.
- Policy Compliance: New regulations and stricter enforcement have led to a 12% increase in account suspensions.
- Seller Churn: Approximately 20% of new sellers exit the marketplace within their first year.
To overcome these hurdles, successful sellers focus on branding, automation, and continuous learning.
Regional Amazon Sales Statistics: US, Europe, and Beyond
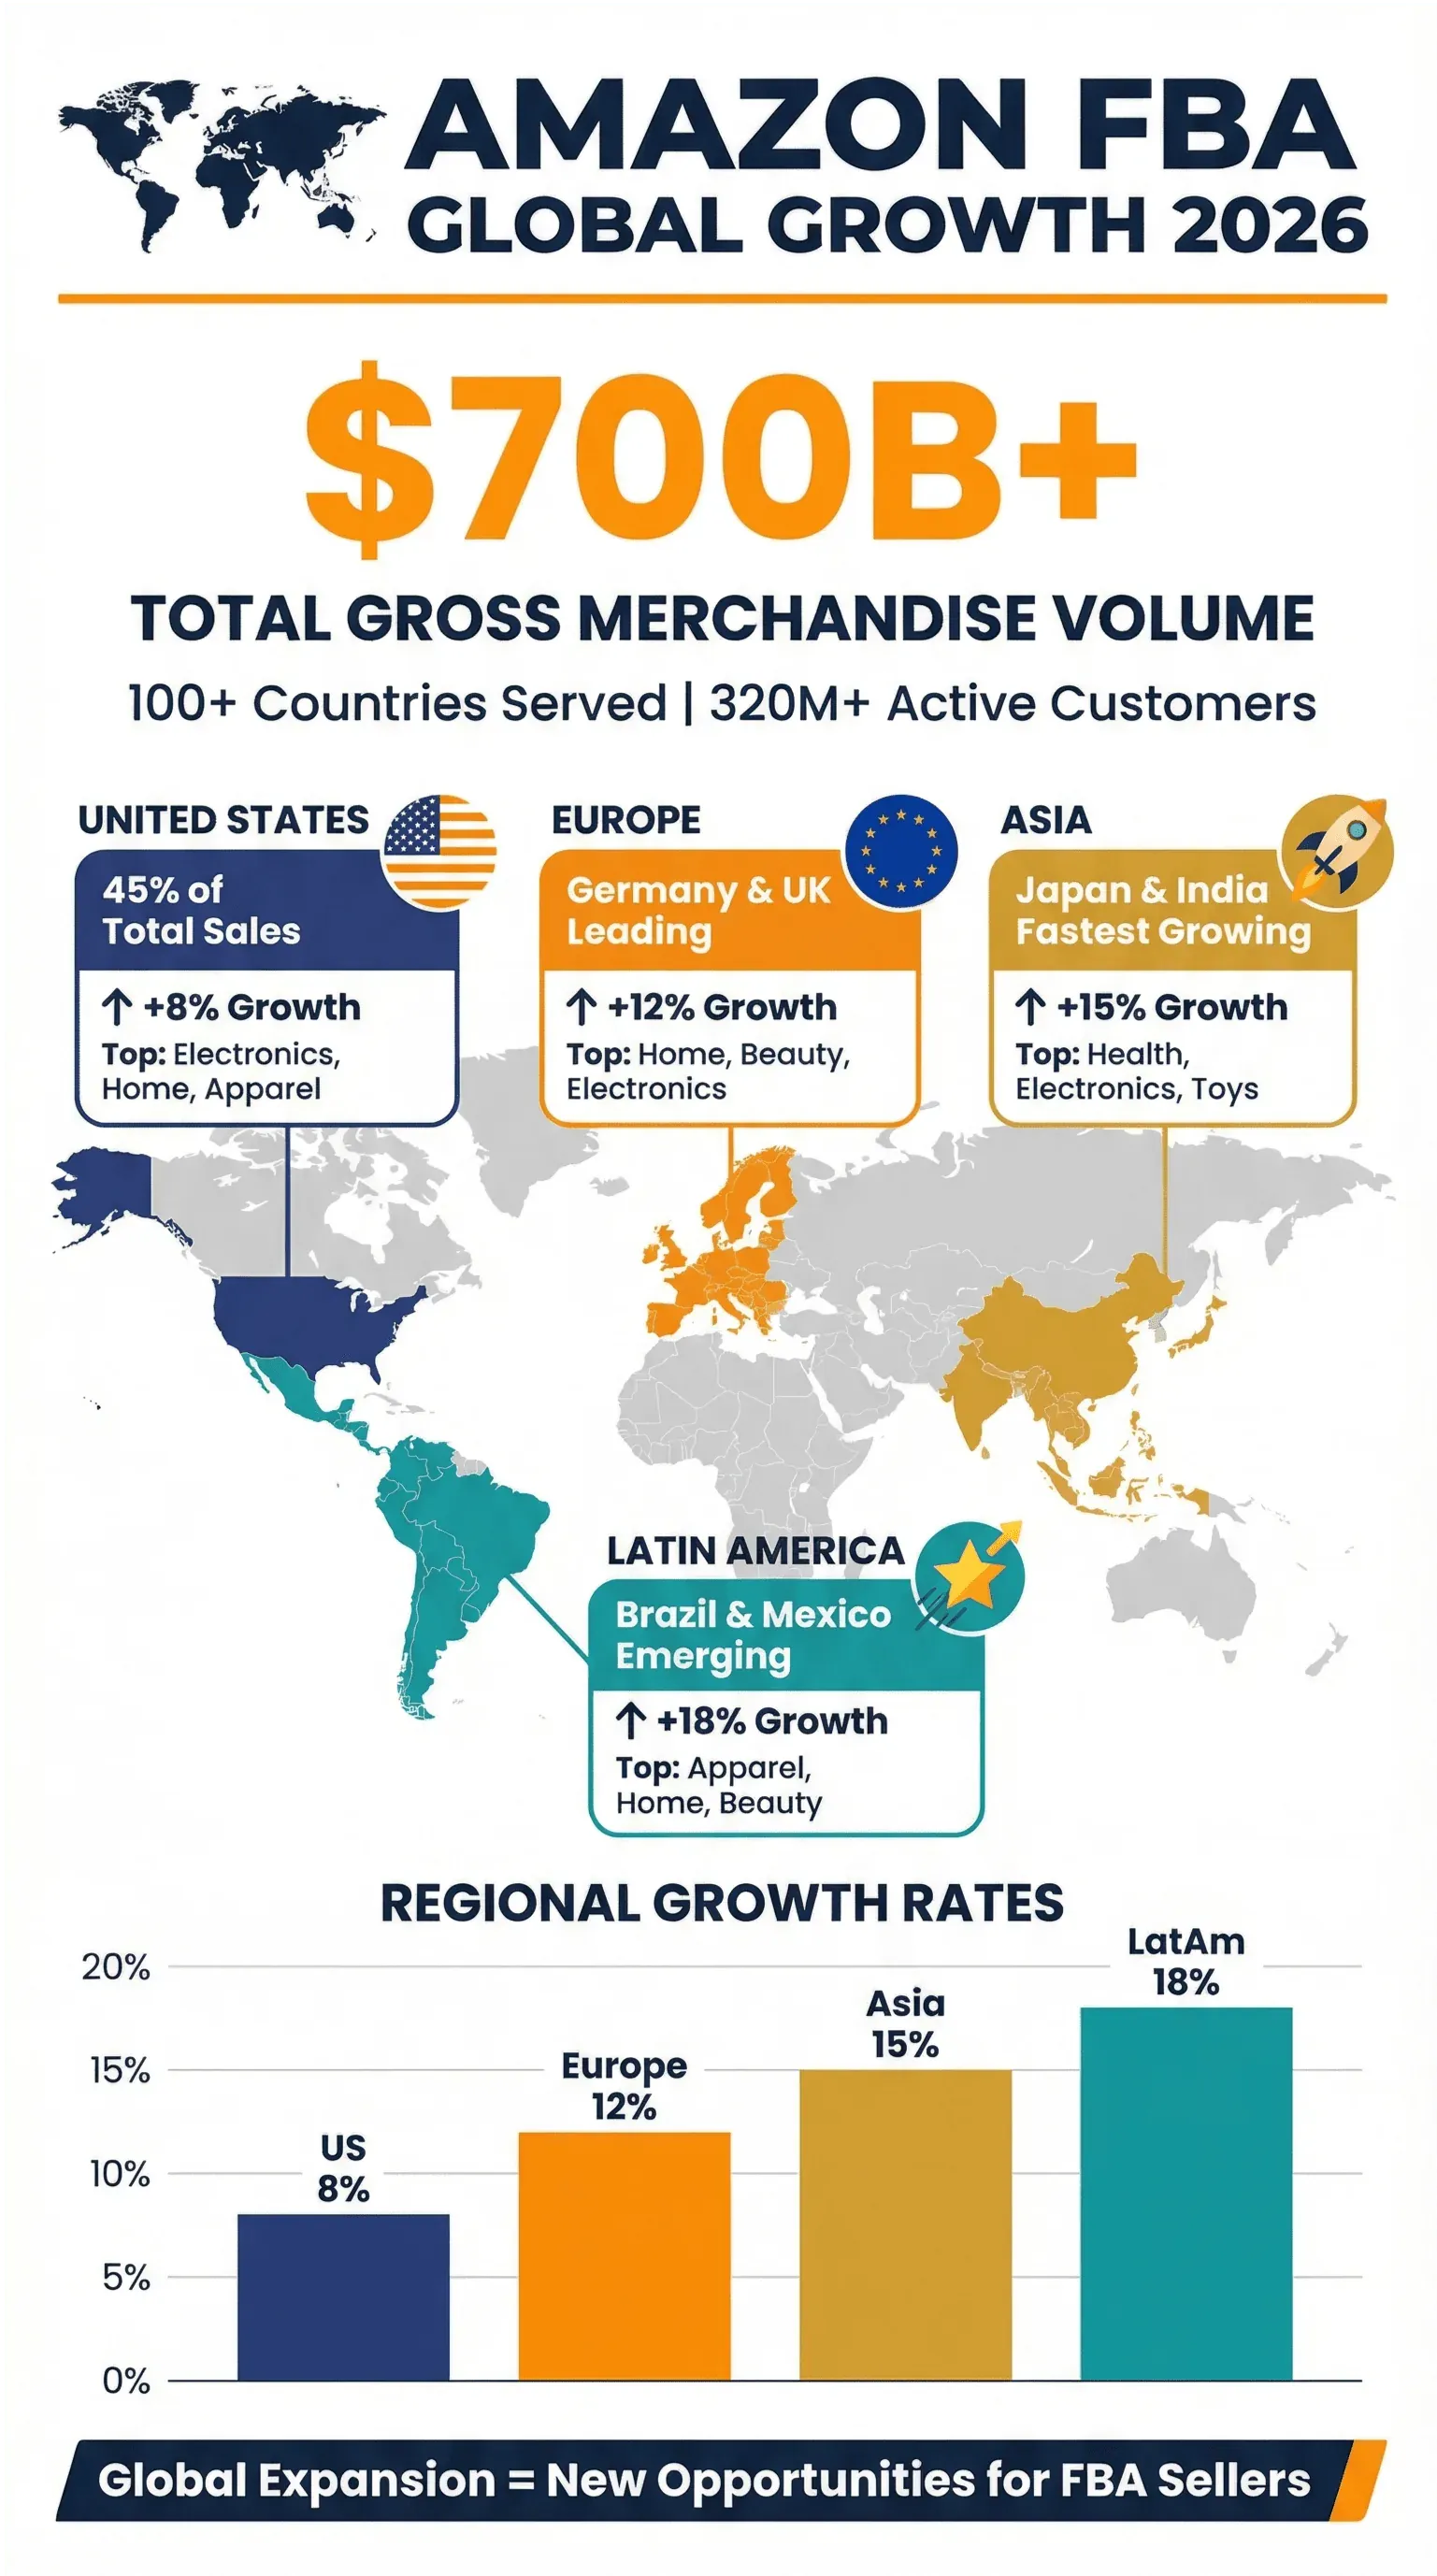 Amazon's growth is not limited to the US. In 2026:
- US: Remains the largest market, accounting for 45% of total sales.
- Europe: Sales grew by 12%, with Germany and the UK leading the region.
- Asia: Japan and India are the fastest-growing markets, with double-digit seller growth.
- Latin America: Brazil and Mexico are emerging hotspots for new FBA sellers.
| Region | Sales Growth (2026) | Top Categories |
|---|---|---|
| US | 8% | Electronics, Home, Apparel |
| Europe | 12% | Home, Beauty, Electronics |
| Asia | 15% | Health, Electronics, Toys |
| LatAm | 18% | Apparel, Home, Beauty |
Global expansion via Amazon FBA offers new opportunities, but also requires understanding local regulations, customer preferences, and logistics.
Key Takeaways: What Amazon FBA Statistics Reveal for 2026
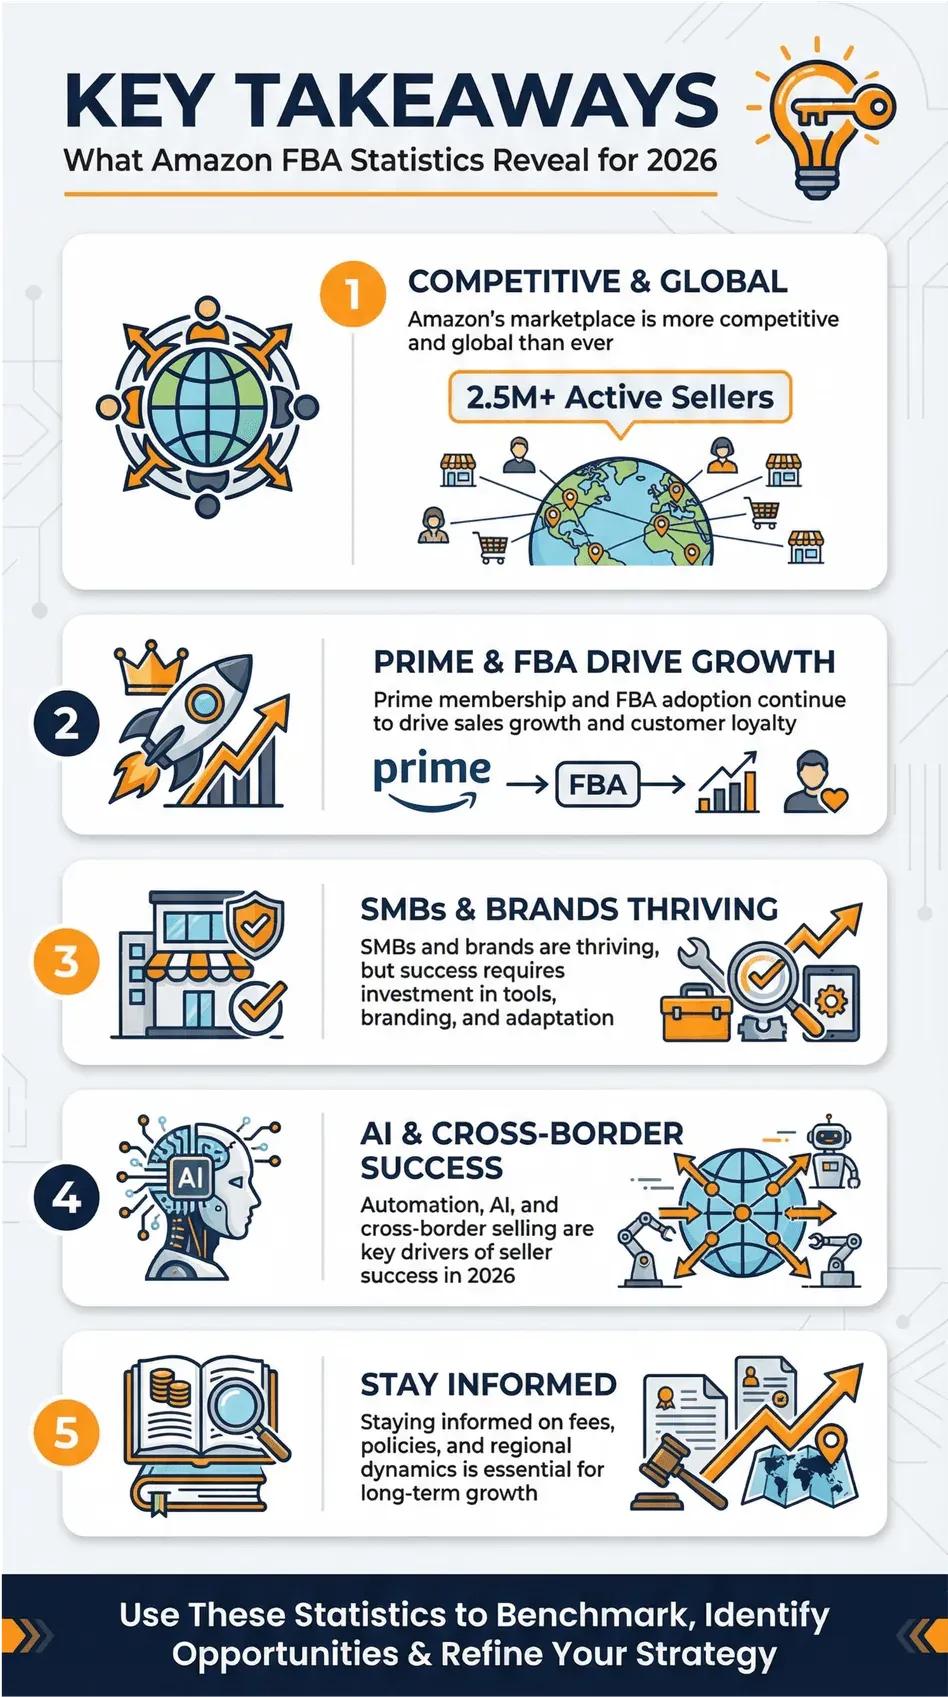
- Amazon's marketplace is more competitive and global than ever, with over 2.5 million active sellers.
- Prime membership and FBA adoption continue to drive sales growth and customer loyalty.
- SMBs and brands are thriving, but success requires investment in tools, branding, and adaptation to new trends.
- Automation, AI, and cross-border selling are key drivers of seller success in 2026.
- Staying informed on fees, policies, and regional dynamics is essential for long-term growth.
Use these Amazon FBA statistics to benchmark your performance, identify new opportunities, and refine your strategy for the year ahead.
Sources & Further Reading
- Amazon's Official Seller Statistics
- Amazon FY2025 Q4 / Annual Results (SEC filing, January 2026)
- Amazon News: Prime Day 2025 Recap
- Amazon News: Prime Day 2026 in June
- Digital Commerce 360: Prime Day 2025 US e-commerce data (Adobe)
- Statista: Amazon Sales and Prime Statistics
- Business of Apps: Amazon Statistics
- Thunderbit Blog: How to Scrape Amazon Products and Reviews
- Thunderbit Blog: What Is Data Scraping and How to Do It
- Thunderbit Blog: The Best Web Scraping Tools & Software
- Amazon Annual Reports
- Marketplace Pulse: Amazon Seller Insights
Try AI Web Scraper for Amazon Data Get Started Free