Picture this: It’s a brisk Saturday morning, and you’re scrolling Zillow with a cup of coffee, toggling between dream homes, rent estimates, and “just curious” listings. You’re not alone—millions of Americans are doing the same, and in 2026, Zillow is more than just a pastime. It’s the pulse of the U.S. real estate market, shaping everything from home prices to rental trends, and even the way we negotiate with our landlords (or, let’s be honest, our spouses).
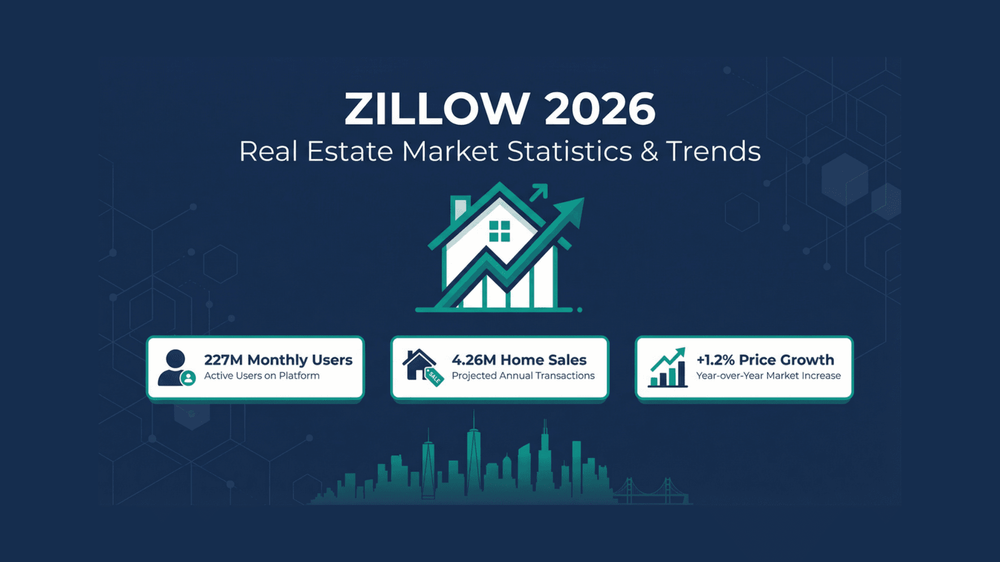
But Zillow isn’t just about window shopping. For buyers, sellers, investors, and real estate pros, Zillow statistics are the compass guiding big decisions. With over 227 million unique monthly users and more than half of all U.S. real estate website visits, Zillow’s data is the industry’s north star. And here’s a stat to wake you up faster than espresso: Zillow forecasts existing home sales will hit 4.26 million in 2026—up 4.3% from 2025 (Zillow Research). That’s a market on the move, even if the days of double-digit price jumps are behind us.
Let’s dive into the numbers, trends, and stories that will define Zillow—and the real estate market—in 2026.
Zillow 2026 at a Glance: Key Real Estate Market Statistics
Here’s your quick-reference dashboard for the year ahead. Whether you’re a seasoned agent, a first-time buyer, or just someone who likes to know what their neighbor’s house is worth, these are the Zillow statistics you need to know for 2026:
| Metric | 2026 Forecast/Recent Value | Change vs. 2025 | Source/Notes |
|---|---|---|---|
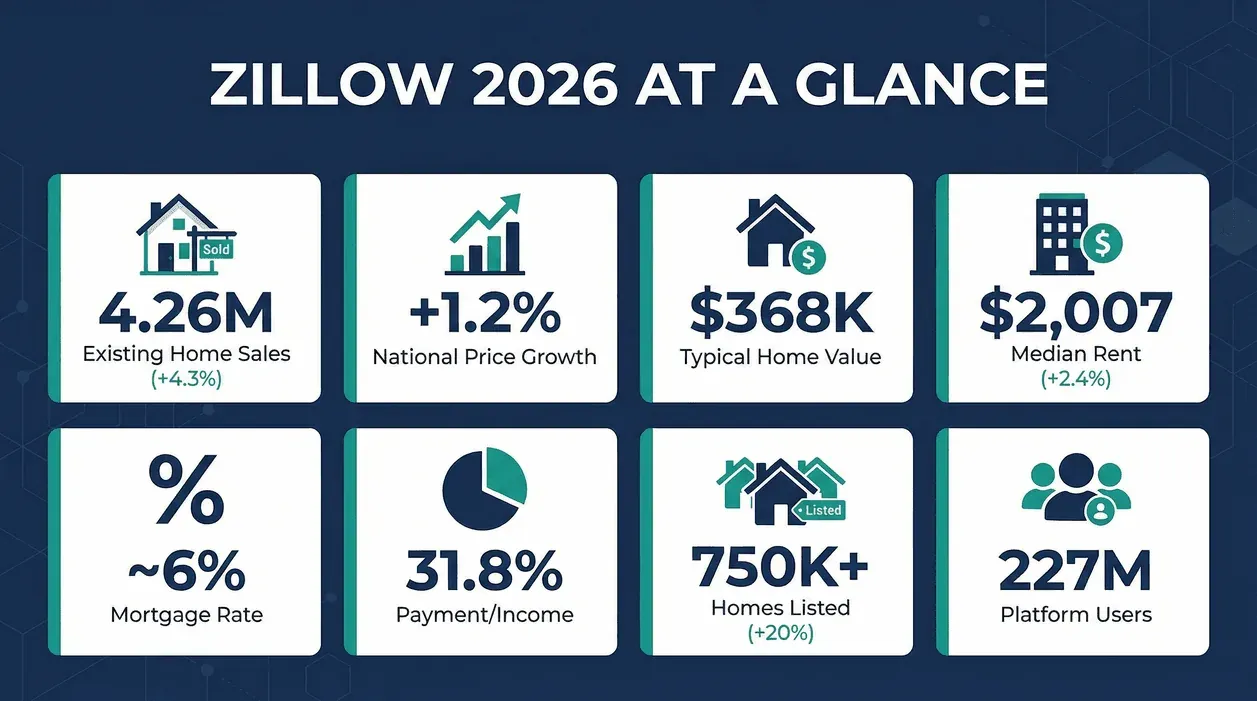
| Existing Home Sales | 4.26 million | +4.3% | Zillow Research |
| National Home Price Growth (Zillow forecast) | ~+1.2% to +2.0% (forecast revised through Q1 2026) | Up from near-zero 2025 | Zillow Research Dec 2025 update |
| Typical U.S. Home Value (ZHVI) | ~$368,000 (mid-2025) | +1.2% forecasted | Thunderbit |
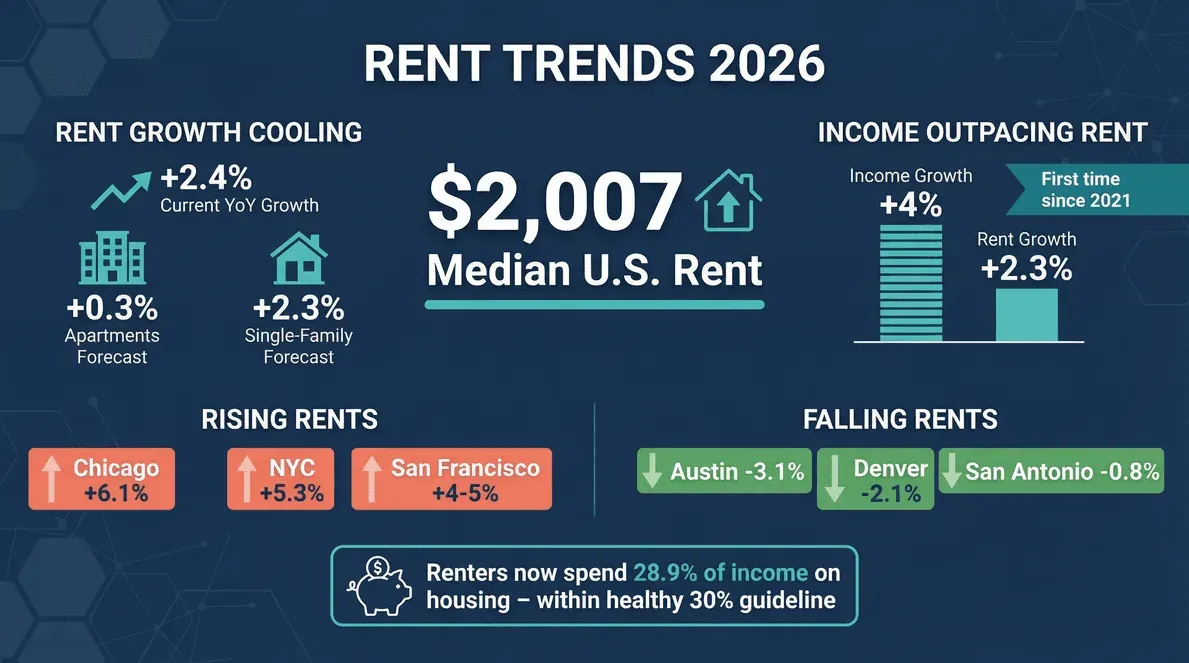
| Median U.S. Rent (ZORI) | ~$2,007/month (Aug 2025) | +2.4% YoY | Zillow Rent Report |
| 2026 Rent Growth Forecast | +0.3% (multifamily), +2.3% (SFR) | Slowing sharply | Zillow Research |
| Mortgage Rate (Year-End 2026) | ~6% | Down from 2023 peak | Zillow Investor Report |
| Typical Mortgage Payment/Income Share | 31.8% | Down from 32.6% | Zillow Investor Report |
| Homes Listed for Sale (National) | ~750,000+ | +20% YoY | Thunderbit |
| Zillow Group Users (Monthly Uniques) | ~220 million (Q1 2026) | Slight YoY softening | Zillow Q1 2026 disclosure |
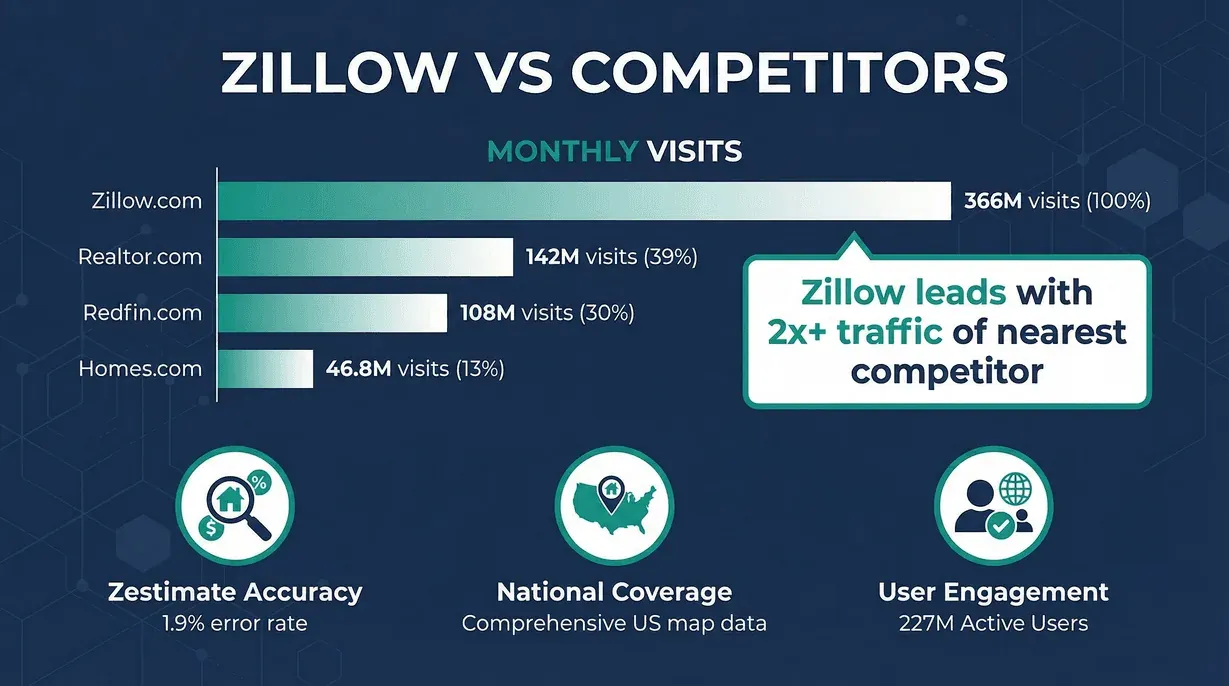
| Zestimate Median Error (On-Market) | ~1.9% | Industry-leading | Thunderbit |
What does this mean? The market is moving out of its 2025 lull, but don’t expect fireworks—think more “steady cruise” than “rocket launch.” Affordability is improving, inventory is up, and Zillow’s rent estimates are finally giving renters a little breathing room.
The Hottest Housing Markets on Zillow for 2026
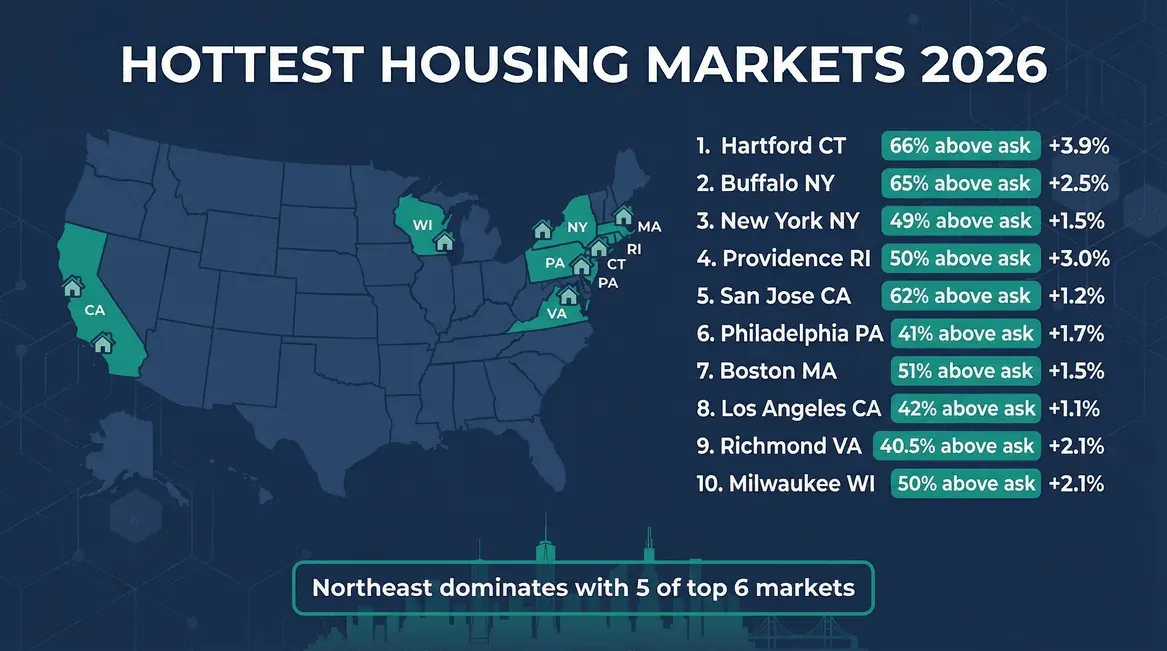
If you’re looking for action, the Northeast and California Bay Area are where the real estate drama is playing out. According to Zillow’s 2026 rankings, these are the top 10 metros where homes are flying off the market, often above asking price:
| Rank | Metro Area | % Homes Sold Above Ask | Inventory vs. Pre-2020 | 2026 Price Growth Forecast |
|---|---|---|---|---|
| 1 | Hartford, CT | 66% | -63% | +3.9% |
| 2 | Buffalo, NY | 65% | -39% | +2.5% |
| 3 | New York, NY | 49% | -48% | +1.5% |
| 4 | Providence, RI | 50% | -55% | +3.0% |
| 5 | San Jose, CA | 62% | -27% | +1.2% |
| 6 | Philadelphia, PA | 41% | -39% | +1.7% |
| 7 | Boston, MA | 51% | -30% | +1.5% |
| 8 | Los Angeles, CA | 42% | -18.5% | +1.1% |
| 9 | Richmond, VA | 40.5% | -34% | +2.1% |
| 10 | Milwaukee, WI | 50% | -26% | +2.1% |
Regional trends: The Northeast absolutely dominates, with five of the top six markets. California’s Bay Area holds strong, and the Midwest sneaks in with Milwaukee. What unites these markets? Tight supply (often 30–60% below pre-pandemic), minimal price cuts, and lots of bidding wars. If you’re a buyer here, bring your A-game—and maybe a love letter to the seller.
Metro-by-Metro Breakdown
Let’s take a quick tour of these hot spots:
- Hartford, CT: Inventory is a rare species—down 63% from pre-pandemic. Two-thirds of homes sell above asking, and prices are forecast to rise 3.9% in 2026.
- Buffalo, NY: Another bidding-war capital, with 65% of homes above ask and a 2.5% price bump on the horizon.
- New York, NY: Inventory is tight, but the city that never sleeps is seeing more modest growth (+1.5%).
- Providence, RI: Half of all homes sell above asking, and prices are set to climb 3%.
- San Jose, CA: Silicon Valley’s housing crunch continues, with 62% above-ask sales and a 1.2% price forecast.
- Philadelphia, PA: The City of Brotherly Love is showing sellers plenty of affection—41% above ask, +1.7% price growth.
- Boston, MA: Classic supply crunch, with 51% above ask and a 1.5% price rise.
- Los Angeles, CA: Still hot, but not as wild as Hartford—42% above ask, +1.1% price growth.
- Richmond, VA: 40.5% above ask, +2.1% price growth, and a market that’s heating up fast.
- Milwaukee, WI: Midwest affordability meets strong demand—50% above ask, +2.1% price growth.
For more details on each market, check out Zillow’s local market pages.
Zillow Rent Estimate Trends: What’s New for 2026?
Renters, landlords, and investors all obsess over the Zillow rent estimate—and for good reason. Zillow’s Rent Zestimates (covering nearly 100 million homes) use a weighted repeat-rent index, which means they track actual rent changes for similar properties over time, not just wishful thinking or outlier listings (Zillow Data).
Why does this matter? Because rent growth has kept cooling into 2026. In Zillow's March 2026 rent report (released April 21, 2026), the typical U.S. asking rent was $1,910, up just 1.8% year-over-year — the slowest annual pace since 2020. Single-family rents grew faster than multifamily (SFR $2,225, +2.5%; multifamily $1,757, +1.3%), but even SFR posted the slowest growth on record in Zillow's data series. Renters are pocketing roughly $193 more per month than a year ago — about $2,318 over the year. For context, the August 2025 report put the median at $2,007 with 2.4% YoY growth, so the deceleration through Q1 is real, not a one-month blip.
Regional Rent Estimate Highlights
Not all cities are created equal. In 2025, the fastest rent hikes were in:
- Chicago: +6.1%
- New York: +5.3%
- San Francisco, Los Angeles, San Diego: +4–5%
Meanwhile, some Sunbelt cities actually saw rents drop:
- Austin: –3.1%
- Denver: –2.1%
- San Antonio: –0.8%
- Phoenix: –0.7%
And in a sign of the times, a majority of listings in cities like DC, Seattle, and Orlando now offer concessions (think: free rent months) to fill vacancies (Zillow October Rent Report).
2026 forecast: Rent inflation is expected to be nearly flat—just +0.3% for apartments and +2.3% for single-family rentals (Zillow 2026 Forecast). After a wild ride (rents are up 36% since pre-pandemic), this slowdown is letting wages catch up.
Housing Prices on Zillow: 2026 Forecasts and Drivers
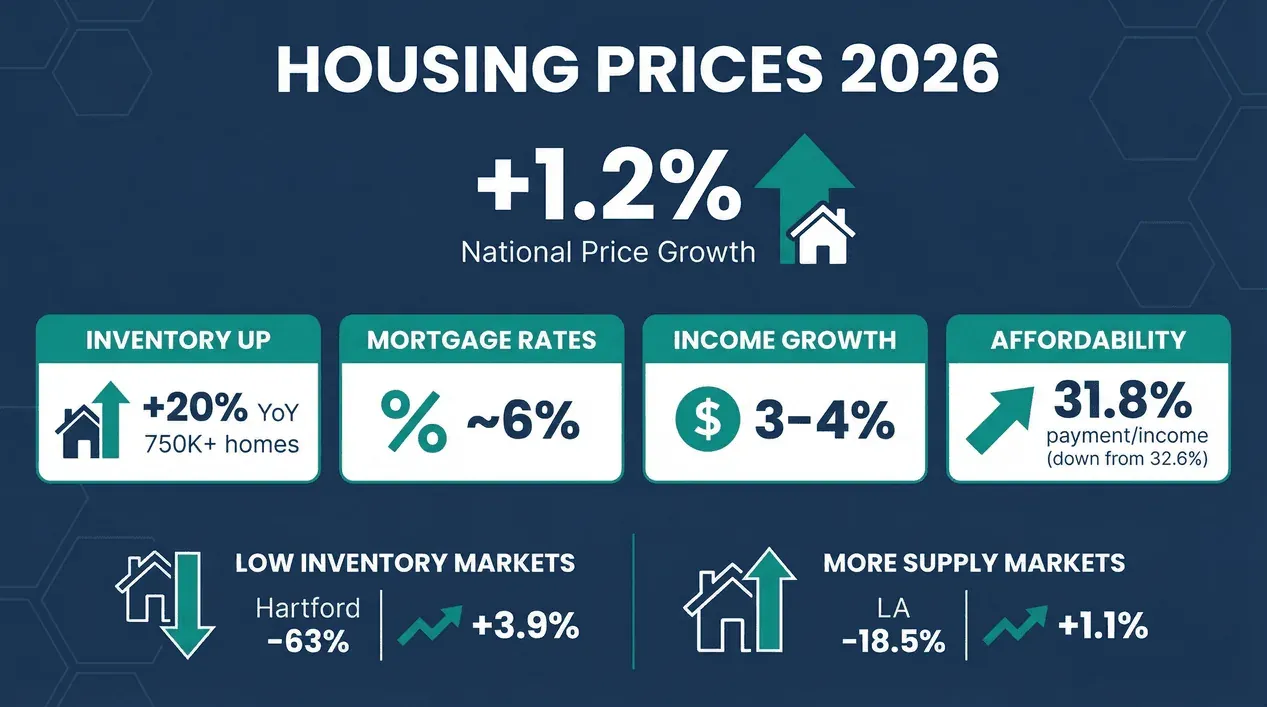
Let's talk about the number everyone wants to know: What will my house be worth next year? Zillow's outlook has shifted as 2026 has unfolded — the December 2025 update put national price growth at roughly +2.0% over the next 12 months, up from the +1.2% forecast cited earlier in the cycle. Either way, the message is the same as it has been all year: modest, well below the double-digit surges of the early 2020s, and well within the band where affordability gains hinge more on income growth than on price moves.
What’s driving this? It’s all about the supply-demand equation:
- Inventory is up: Listings are up 20% year-over-year, with about 750,000+ homes on the market. But we’re still well below pre-pandemic norms.
- Mortgage rates are steady: Expected to hover just above 6%, down from the 2023 peak but still above the “good old days.”
- Incomes are rising: Forecasted to grow 3–4%, which helps buyers stretch a little further.
- Affordability is improving: The typical mortgage payment is projected to take up 31.8% of income by year-end, down from 32.6% (Zillow Investor Report).
Inventory and Price Growth: The Supply-Demand Equation
The hottest markets—like Hartford and Buffalo—have the deepest inventory shortages (up to 63% below pre-pandemic levels) and are seeing the strongest price growth (Zillow Hottest Markets). In contrast, markets with more supply (like Los Angeles) are seeing milder growth. The lesson? When there’s not much to buy, prices go up. When there’s more to choose from, growth cools off.
Zillow’s Role in the 2026 Real Estate Market
Explore Zillow Statistics with Thunderbit Get Started Free
Zillow isn’t just a website—it’s the backbone of how Americans buy, sell, and rent homes. In 2026, its influence is everywhere:
- Platform reach: ~220 million average monthly unique users across Zillow Group properties (Zillow, Trulia, StreetEasy, HotPads) in Q1 2026, per the company's Q1 2026 earnings disclosure — still well more than double the next competitor.
- Market share: Over 50% of all U.S. real estate website visits.
- Premier Agent network: Facilitated 1.4 million buyer-agent matches in 2024.
- Tech tools: From the BuyAbility calculator (which helps buyers figure out what they can afford) to virtual tours and robust search filters, Zillow is setting the pace for digital real estate.
And it’s not just buyers and sellers. Renters are using Zillow’s rent estimates to decide whether to renew or move. Agents are leveraging Zillow’s data to price homes and target marketing. Even investors are glued to ZORI and ZHVI charts.
Mortgage Rates, Affordability, and Buyer Competition
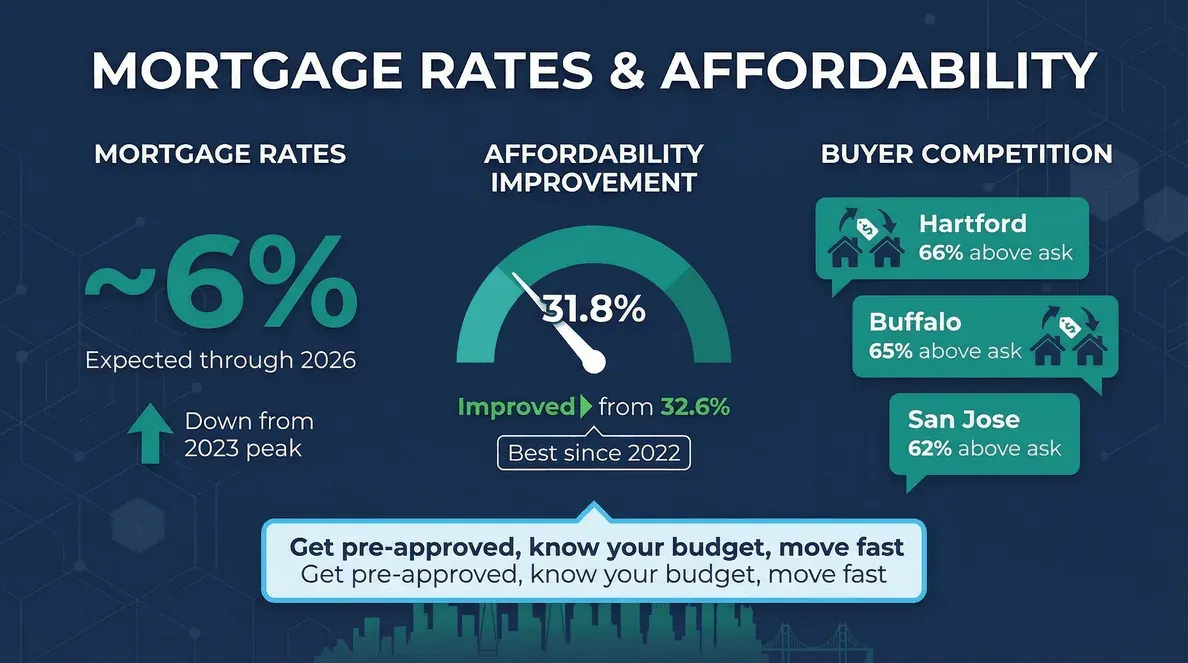
Mortgage rates are the elephant in every open house. Per Freddie Mac's Primary Mortgage Market Survey, the 30-year fixed averaged 6.37% in the week of May 7, 2026 — down from 6.76% a year earlier but still hovering in the low-to-mid 6% range, in line with Zillow's 2026 outlook.
Affordability is improving: Rising incomes and flat-ish prices mean the typical mortgage will take up a smaller share of income—down to 31.8% by year-end (Zillow Investor Report). That’s the best it’s been since 2022.
Buyer competition: The frenzy of 2020–21 is fading, but in hot markets, bidding wars are still common. In Hartford, Buffalo, and San Jose, two-thirds of homes sold above asking in 2025 (Zillow Hottest Markets). Zillow’s advice? Get pre-approved, know your budget, and move fast.
Zillow Statistics for Investors: Opportunities and Risks
If you’re an investor, Zillow’s data is your cheat sheet. Here’s what stands out for 2026:
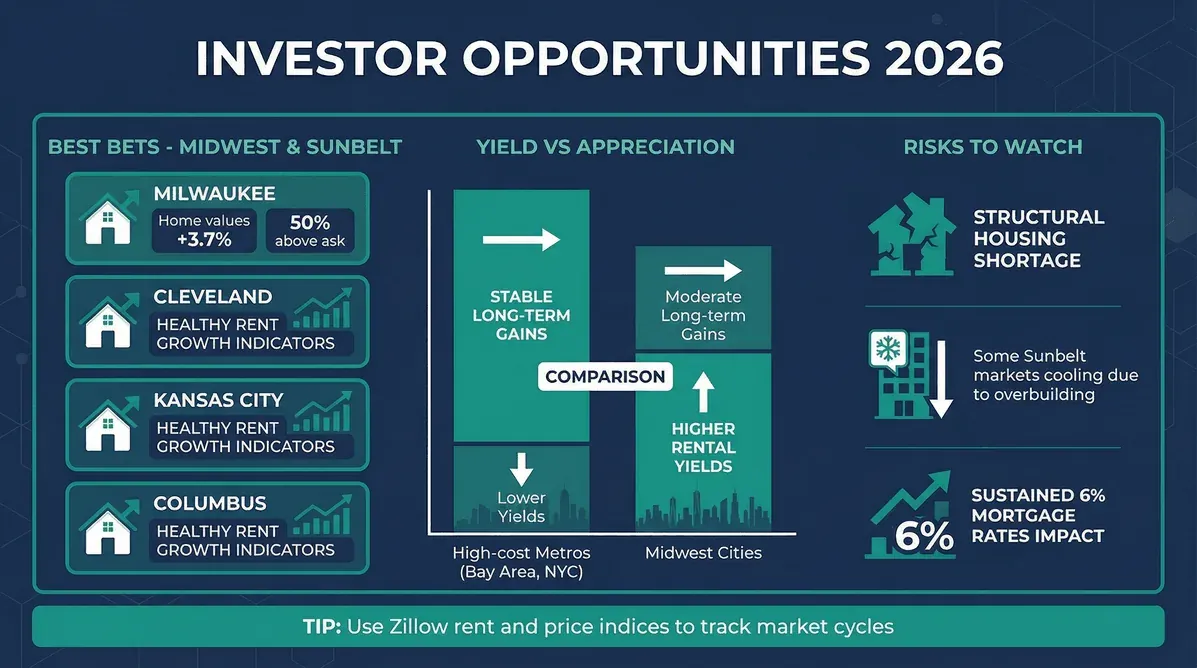
- Best bets: Midwest and some Sunbelt cities (like Milwaukee, Cleveland, Kansas City, Columbus) offer healthy rent growth and affordability (NAR Outlook). Milwaukee, for example, saw home values up 3.7% in 2025 and 50% of homes sold above ask.
- Yield vs. appreciation: High-cost metros (Bay Area, NYC) may offer stable long-term gains but lower rental yields.
- Risks: The U.S. still faces a structural housing shortage (NAR Outlook), which can push prices up unexpectedly. Some Sunbelt markets are cooling due to overbuilding and sustained 6% mortgage rates.
Pro tip: Use Zillow’s rent and price indices to track market cycles and spot opportunities—or warning signs.
Comparing Zillow to Other Real Estate Platforms
| Platform | Avg. Monthly Visits (2024) | Share of Zillow’s Traffic |
|---|---|---|
| Zillow.com | 366 million | 100% |
| Realtor.com | 142 million | ~39% |
| Redfin.com | 108 million | ~30% |
| Homes.com | 46.8 million | ~13% |
(Thunderbit Zillow Statistics)
Zillow isn’t just ahead—it’s lapping the field. Its tools (Zestimate, ZORI, API access), national coverage, and user engagement are unmatched. Other platforms have their strengths (MLS integration, brokerage services), but Zillow is the default for most Americans.
Key Takeaways: Zillow 2026 and the Real Estate Market
- Growth is back, but it’s measured: Expect a 4% bump in home sales and 1–2% price growth (Zillow Research).
- Affordability is improving: Mortgage rates are steady, incomes are rising, and more markets will be “affordable” by year-end (Zillow Investor Report).
- Renters catch a break: Rent growth is flattening, and concessions are up—finally, some relief for tenants (Zillow Rent Report).
- Hot markets stay hot: The Northeast and Bay Area are still the places to watch for bidding wars and price gains (Zillow Hottest Markets).
- Zillow is the market’s compass: With 72% buyer reach and industry-leading data, Zillow’s statistics drive decisions for everyone from first-time buyers to institutional investors (Thunderbit Zillow Statistics).
- Regional shifts matter: Some Sunbelt markets are cooling, while Midwest and Northeast cities are gaining strength. Watch the rent and price trackers to spot the next wave (Zillow October Rent Report).
- Action steps: Use Zillow’s data and tools—like the BuyAbility calculator, rent estimates, and Premier Agent connections—to make informed decisions, whether you’re buying, selling, renting, or investing.
Bonus: How Thunderbit Helps You Stay Ahead
Scrape Zillow Data with Thunderbit Get Started Free
As someone who’s spent years building automation tools for real estate and e-commerce, I know how crucial it is to have the right data at your fingertips. At Thunderbit, we make it easy to scrape Zillow data for your own analysis—whether you’re tracking rent trends, monitoring inventory, or building your next investment model. Our Chrome Extension is designed for business users who want to save time, automate research, and get ahead of the market.
If you’re hungry for more stats, check out our deep dive on Zillow statistics or explore key real estate insights for 2026. And if you’re ready to turn Zillow’s data into your next big move, you know where to find us.
Try Thunderbit for Real Estate Data
Sources:
- Zillow 2026 Housing Market Predictions
- NAR 2026 Real Estate Outlook
- Thunderbit: Inside Zillow Stats
- Zillow August 2025 Rent Report
- Zillow October 2025 Rent Report
- Zillow Hottest Housing Markets 2026
For more on scraping and analyzing real estate data, visit the Thunderbit Blog. And remember: in real estate, the early bird doesn’t just get the worm—they get the best deal on the block.
Try Thunderbit AI Web Scraper for Real Estate Get Started Free