
Picture this: It’s Monday morning, and your team is prepping for the weekly meeting. Someone’s frantically copying numbers from one spreadsheet to another, someone else is digging through last month’s emails for a missing report, and—if you’re like most business teams—at least one person is quietly wondering if any of these numbers actually match. Sound familiar? You’re not alone. In fact, studies show that just searching for scattered data and manually compiling information. That’s a lot of coffee and copy-paste.
But here’s the good news: there’s a better way to get the big picture without all the chaos. Enter data aggregation: the not-so-secret weapon behind faster reporting, sharper insights, and teams that actually agree on what’s happening. As someone who’s spent years building SaaS and automation tools (and, yes, wrangling my fair share of spreadsheets), I can tell you: aggregate data is the difference between “I think” and “I know.” Let’s break down what data aggregation really means, why it matters for your team, and how you can put it to work without losing your mind (or your Monday).
What Is Data Aggregation? (Aggregate Data Definition for Teams)
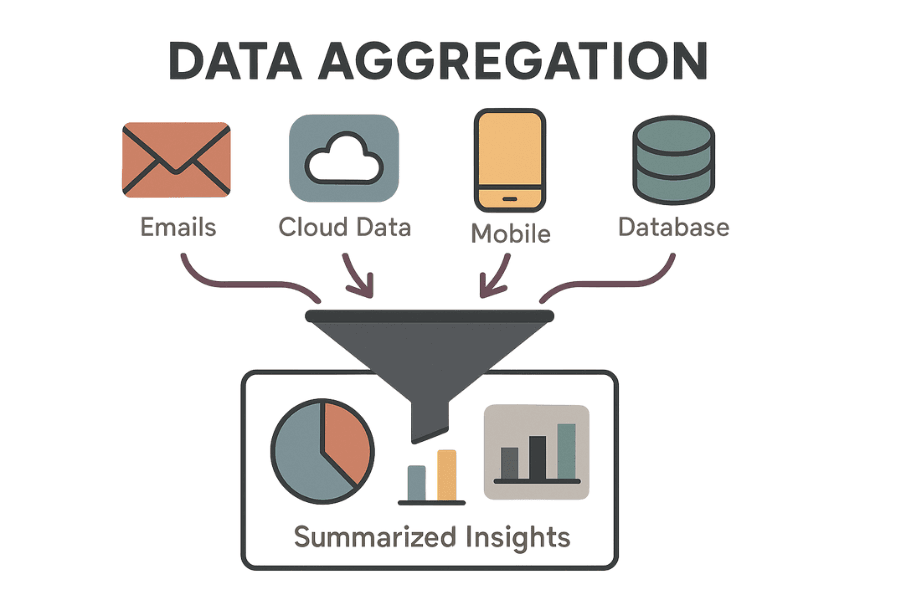
Let’s start simple: What is data aggregation? At its core, data aggregation is the process of collecting information from multiple sources and combining it into a summarized form for analysis (). Instead of drowning in thousands of individual data points, you use aggregation to “see the big picture.” Think of it as rolling up all the nitty-gritty details—like every single sale, click, or customer comment—into totals, averages, or other high-level stats that actually make sense for decision-making.
Aggregate data definition: Aggregate data means you’re looking at the summary, not the raw details. For example, rather than reviewing every customer’s purchase, you might look at total sales by month or average purchase value by region. It’s like condensing a 100-page novel into a one-page summary: you lose some detail, but you gain clarity.
What Is Data Aggregation on Sites?
On websites and apps, data aggregation happens behind the scenes all the time. Whenever you see a dashboard showing “total active users this week” or “average product rating,” that’s aggregate data in action. For business teams, aggregating data from sites might mean pulling together product prices from competitors, summarizing web analytics across multiple domains, or compiling customer reviews into a single score. In short, if you’ve ever used a pivot table in Excel or checked your Google Analytics dashboard, you’ve already experienced the power of aggregation—whether you realized it or not ().
Why Data Aggregation Matters for Businesses and Teams
So, why should you care about aggregation? Because in today’s data-heavy world, it’s the only way to keep your head above water—and actually use your data to drive results.
- Faster, Informed Decision-Making: With aggregate data, teams can spot trends and performance at a glance. No more waiting days for someone to compile a report; up-to-date dashboards mean answers are available on demand. Companies that embrace data aggregation and business intelligence tools see .
- Time and Labor Savings: Aggregation slashes manual work. One SME that switched to automated dashboards saved on reporting alone.
- Improved Accuracy & Consistency: Manual compilation is error-prone. Automated aggregation means fewer mistakes and a single source of truth for everyone ().
- Enhanced Team Collaboration: Shared dashboards break down silos and foster transparency. Everyone works from the same numbers, so there’s less arguing and more action ().
- Big-Picture Insights: Aggregation reveals trends and outliers that raw data can’t. It’s your “bird’s-eye view” for proactive strategy.
Table: Key Benefits of Data Aggregation
| Benefit of Data Aggregation | How It Helps Teams |
|---|---|
| Better Decision-Making | Comprehensive view of operations and performance; enables informed, strategic decisions (Sontai). |
| Time Savings & Efficiency | Reduces manual work; teams spend more time analyzing, less time compiling (Sontai). |
| Greater Accuracy & Consistency | Minimizes human errors; everyone uses the same figures (Formstack). |
| Improved Collaboration | Breaks down data silos; shared dashboards foster trust and alignment (Domo). |
| Insightful Trends & Big-Picture View | Makes trends and outliers visible; supports strategic planning and early identification of issues (Coupler.io). |
10 Real-World Examples: When to Use Data Aggregation
Let’s get practical. Here are 10 scenarios where aggregate data makes life easier—and your team smarter:
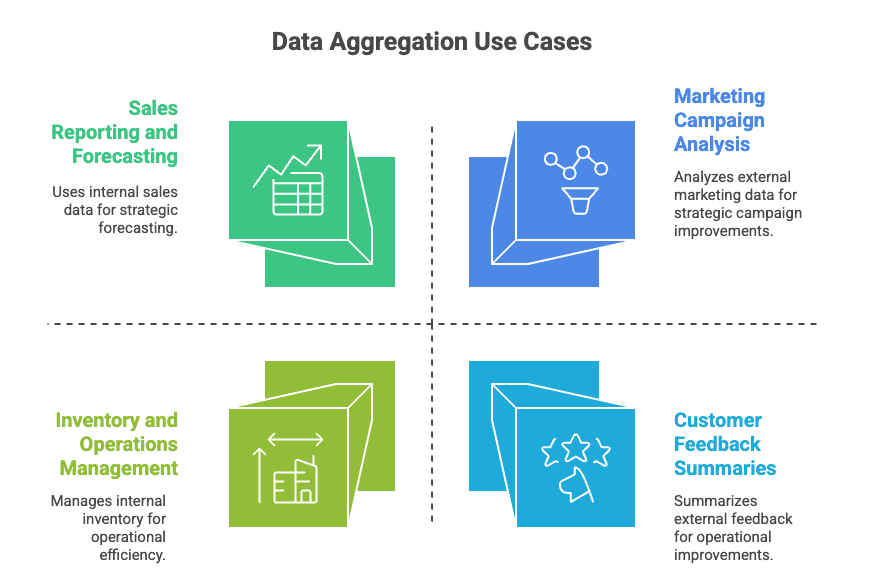
- Sales Reporting and Forecasting: Aggregate daily or weekly sales by region or product. Instead of reviewing every sale, managers see total sales per quarter, average deal size, and top performers. This helps spot trends and forecast accurately.
- Marketing Campaign Analysis: Combine metrics from Facebook, Google, and email campaigns into one report. Aggregation shows which channel delivers the best ROI, so you can shift budget where it counts ().
- Website Analytics and Traffic Monitoring: Aggregate visits by day, week, or source. Instead of sifting through every page view, teams get a clear view of trends and the impact of campaigns ().
- Customer Feedback Summaries: Aggregate survey responses or support tickets to identify common pain points. Instead of reading every comment, teams see overall satisfaction scores and recurring themes ().
- Inventory and Operations Management: Aggregate inventory data from all warehouses to spot low stock or production trends. This helps prevent shortages and optimize resource allocation.
- Financial Reporting and Budgeting: Aggregate expenses and revenue across departments for a company-wide view. Finance teams can quickly spot trends and make informed decisions.
- HR Analytics and Employee Surveys: Aggregate engagement survey results or turnover data by department. HR can identify which teams need more support or where to focus retention efforts.
- Market Research and Competitive Analysis: Aggregate competitor prices, industry sales, or customer interest surveys to guide strategy ().
- Project Management and Performance Tracking: Aggregate project status and milestones across teams for portfolio reviews. This enables quick identification of at-risk projects.
- Product Usage and Business Intelligence: Aggregate user behavior data (logins, feature adoption, retention rates) to inform product decisions and spot anomalies.
Each of these examples shows how aggregation simplifies complex data tasks, turning a mountain of details into actionable insights.
How Data Aggregation Works: Step-by-Step for Teams
Alright, let’s demystify the process. Aggregating data isn’t just for techies or data scientists—it’s a workflow any team can master. Here’s how it usually goes:
1. Collecting and Combining Data
First, gather raw data from all relevant sources: spreadsheets, CRMs, web analytics, customer support systems, or even public websites. The goal is to assemble a complete dataset. Tools like can help by scraping and structuring web data, while platforms like Google Analytics or Salesforce pull from internal systems.
Pro tip: Always pull from authoritative sources and note when the data was last updated. Stale or inconsistent data can throw off your whole analysis ().
2. Cleaning and Filtering Data
Next, clean your data. This means removing duplicates, correcting errors, standardizing formats, and handling missing values (). For example, make sure “US” and “United States” are treated as the same region, and filter out irrelevant or outdated records. Remember: garbage in, garbage out.
3. Summarizing and Presenting Aggregate Data
Now comes the fun part: summarizing. Use aggregation functions (sum, average, count, min, max) to roll up your data by the dimensions that matter—like month, region, or product category. Present the results in tables, charts, or dashboards. Tools like Excel’s PivotTables, Power BI, or Google Data Studio make this step much easier ().
Visualization tip: A line chart of monthly sales or a bar chart of sales by product category can make trends jump out at a glance ().
Types of Data Aggregation: Time, Spatial, and Attribute
Not all aggregation is created equal. Here are the main types, with business-friendly examples:
- Time Aggregation: Grouping data over a time period (e.g., daily, weekly, monthly sales). Perfect for spotting trends and seasonality ().
- Spatial Aggregation: Grouping by location (e.g., sales by country, customers by state). Great for understanding geographic performance ().
- Attribute (Category) Aggregation: Grouping by product, customer segment, campaign channel, etc. Useful for comparing categories or segments ().
Choosing the right type helps your team answer different business questions:
- “How are we doing over time?” → Time aggregation
- “Where are we performing best?” → Spatial aggregation
- “Which product or segment is leading?” → Attribute aggregation
Often, you’ll combine these: e.g., monthly sales by product category by region.
Manual vs. Automated Data Aggregation: What’s Best for Your Team?
Let’s be honest—manual aggregation (think: spreadsheets, copy-paste marathons) can work for small teams or one-off reports. But as your data grows, so does the pain. Here’s how the two approaches stack up:
Table: Manual vs. Automated Aggregation
| Aspect | Manual Aggregation | Automated Aggregation |
|---|---|---|
| Speed | Slow—hours or days to gather and summarize; lag in reporting (Mapex) | Fast—data can be aggregated on schedules or in real-time; dashboards update frequently |
| Accuracy | Prone to errors—copy-paste mistakes, formula errors | High accuracy—automation performs tasks consistently (Formstack) |
| Scalability | Limited—doesn’t scale to large datasets or frequent updates | Scalable—handles large datasets and multiple sources |
| Timeliness | Data often outdated; hard to do “real-time” manually | Timely—supports real-time or daily monitoring |
| Resource Cost | Consumes staff time; hidden labor costs | Upfront tool cost, but saves labor and scales better |
| Ease of Use | Familiar tools, but complex as steps multiply | User-friendly interfaces after setup; many tools built for non-tech users |
| Flexibility | Very flexible for unique, one-off questions | Less flexible on the fly, but great for standard, repeatable needs |
Bottom line: Manual is fine for small, simple needs. But as soon as you’re repeating the same data prep or dealing with multiple sources, it’s time to automate.
Popular Data Aggregation Tools for Business Teams
There’s no shortage of tools to help you aggregate and analyze data. Here are a few that I see teams rely on again and again:
- Microsoft Excel / Google Sheets: The classics. Great for quick aggregation with PivotTables and formulas. Google Sheets adds cloud collaboration for live updates ().
- Google Analytics: Automatically aggregates website and app data—page views, sessions, conversion rates—so marketing teams can see trends without manual work.
- Salesforce: CRM with robust reporting and dashboards. Aggregates sales and customer data for pipeline, deal size, and more ().
- Power BI / Tableau / Looker Studio: Business intelligence tools for flexible aggregation, visualization, and automated dashboards.
- Thunderbit: My personal favorite for web data. Thunderbit is an that lets you scrape and aggregate data from any website in just a couple of clicks—no coding required.
Spotlight: Thunderbit for Easy Web Data Aggregation
Let me geek out for a second. Thunderbit is built for business users who need to aggregate data from the web—think competitor prices, real estate listings, or market research—without writing code or hiring a developer. Here’s why I think it’s a game-changer:
- AI-Powered Field Detection: Just click “AI Suggest Fields” and Thunderbit figures out what data can be scraped from the page.
- 2-Click Scraping: Navigate to your target page, click “AI Suggest Fields,” then “Scrape.” That’s it. Data is structured and ready to export.
- Subpage Scraping: Need more details? Thunderbit can click into each subpage (like individual product listings) and enrich your table with deeper info.
- Instant Templates: For popular sites (Amazon, Zillow, Instagram, Shopify), use pre-built templates for one-click scraping.
- Free Data Export: Export to Excel, Google Sheets, Airtable, Notion, or download as CSV/JSON—no extra charge.
- Automation & Scheduling: Set up scheduled scrapes using plain language (e.g., “every Monday at 9am”).
- User-Friendly: No coding, no setup headaches. If you can browse the web, you can use Thunderbit.
If you’re tired of copy-pasting from websites or wrangling messy CSVs, is worth a try. (And yes, I’m biased—I helped build it, but our users’ say it best.)
Aggregate Data in Action: Team Collaboration and Better Decisions
Here’s where the magic happens (okay, not “magic,” but you get the idea). When teams have access to aggregated data:
- Shared Dashboards = Shared Understanding: Everyone’s looking at the same numbers, so meetings are about solutions—not debating whose spreadsheet is right ().
- Faster, Data-Backed Decisions: No more “I think” vs. “I know.” Teams can answer questions in real time and pivot quickly.
- Cross-Department Collaboration: Sales, marketing, ops, and finance can all see how their efforts connect, leading to more coordinated action.
- Data-Driven Culture: When everyone trusts the data, people are empowered to take initiative, spot issues early, and celebrate wins together.
- Reduced Duplication and Conflict: One source of truth means less time wasted reconciling conflicting numbers.
I’ve seen teams go from endless debates to quick, confident decisions just by sharing a live dashboard. It’s like switching from a game of telephone to a group chat—everyone’s on the same page.
Key Takeaways: Why Aggregate Data Is a Must-Have for Modern Teams
Let’s bring it home:
- Data aggregation is how teams turn chaos into clarity—combining data from many sources into summaries that drive action.
- It saves time, improves accuracy, and boosts collaboration. Teams that aggregate data well make faster, smarter decisions—and usually have fewer headaches.
- Every team can benefit: Whether you’re in sales, marketing, HR, finance, or ops, aggregate data helps you focus on what matters.
- Start small, but start now: Even a simple pivot table or shared dashboard can make a huge difference. As your needs grow, explore tools like , Power BI, or Looker Studio.
- Clean data is key: Good aggregation depends on good data. Invest time in cleaning and standardizing your sources.
- Culture matters: Make aggregate data part of your team’s daily routine. Share dashboards, discuss metrics, and celebrate wins with data.
- Be mindful of privacy: Use aggregation to protect sensitive details, and always aggregate responsibly.
If you’re still spending hours cobbling together reports or arguing over numbers, take it as a sign: it’s time to embrace aggregation. Try aggregating just one recurring report this week—see how much time you save and how much clearer your team’s discussions become.
And if you want to make web data aggregation as easy as ordering takeout, and see what two clicks can do for your workflow.
Here’s to smarter teams, better decisions, and fewer Monday morning headaches. If you want to dig deeper, check out more tips and guides on the . Happy aggregating!
FAQs
1. What is data aggregation, and why is it important for businesses?
Data aggregation is the process of collecting and summarizing data from multiple sources to provide a clearer, high-level view. For businesses, it helps reduce manual reporting time, improve decision-making accuracy, and provide consistent insights across teams.
2. How can data aggregation improve team productivity?
By automating the collection and summarization of data, teams save hours previously spent on manual work. It eliminates errors, reduces confusion, and allows everyone to work from the same dashboard—leading to faster, more confident decisions.
3. What are some real-world use cases for data aggregation?
Examples include sales forecasting, marketing performance reports, website traffic analysis, customer feedback summaries, and financial reporting. Aggregated data helps teams identify trends, allocate resources, and monitor performance at scale.
4. What’s the difference between manual and automated data aggregation?
Manual aggregation involves copy-pasting and spreadsheets, which is slow and error-prone. Automated aggregation uses tools to pull, clean, and summarize data in real time—saving time, improving accuracy, and scaling easily with growing data needs.
5. What tools can teams use to aggregate data effectively?
Popular tools include Excel, Google Sheets, Google Analytics, Salesforce, Power BI, Tableau, and Looker Studio. For web data specifically, Thunderbit is an AI-powered tool that allows teams to scrape and aggregate website data without coding.