
Picture this: It’s 2026, and you’re scrolling through your favorite real estate app, eyeing that dream home, or maybe you’re a seasoned agent prepping for your next big listing presentation. The market feels different—there’s a buzz of opportunity, but also a sense that the rules are changing. Whether you’re an agent, broker, investor, or homebuyer, understanding the latest real estate statistics isn’t just helpful—it’s essential for making smart moves in a landscape that’s shifting faster than a bidding war on a Saturday morning.
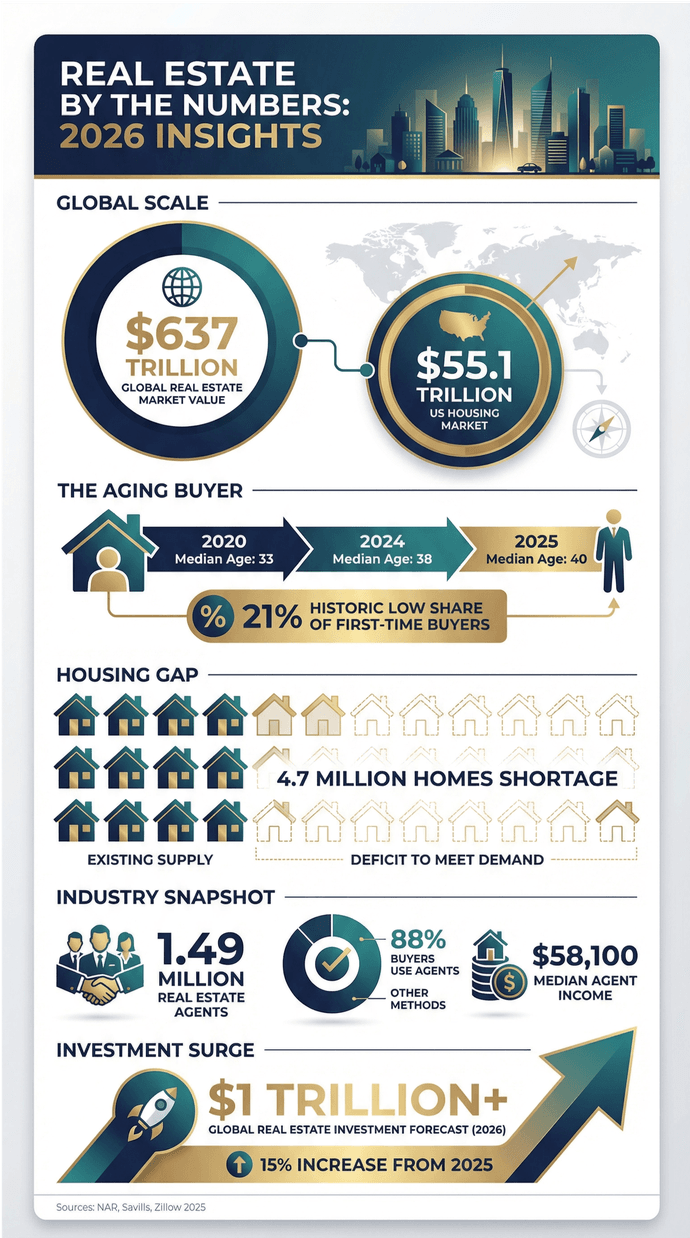
The real estate world has always been a numbers game, but lately, the numbers themselves are wild. The global real estate market is now valued at over , the U.S. housing market alone has hit , and the average age of a first-time buyer is climbing. Meanwhile, tech is transforming how deals get done, and new commission rules are shaking up the industry. If you’re curious about who’s thriving, what’s trending, and where the next big opportunity lies, you’re in the right place. Let’s dig into 45 of the most eye-opening real estate insights for 2026—backed by the latest data, and with a few stories and laughs along the way (because let’s face it, we could all use a little humor after that last round of paperwork).
Real Estate Agent Statistics: 2026 at a Glance
Let’s start with a quick snapshot of the real estate agent landscape as we head into 2026. These numbers tell the story of an industry that’s massive, competitive, and evolving—sometimes all before your morning coffee kicks in.
| Statistic | 2026 Data/Insight |
|---|---|
| U.S. Licensed Agents | Over 3 million (with 1.5M+ Realtors®) |
| Global Real Estate Professionals | Estimated 6 million+ |
| Median Age of Realtors | 55 years old (down from 60 a year ago) |
| Gender Split | 65% women |
| Ethnic Diversity | 79% White, 10% Hispanic/Latino, 6% Black, 4% Asian (more diversity among new agents) |
| Median Years Experience | 10 years |
| Median Transactions (2023) | 10 closed deals (down from 12) |
| Median Gross Income (2023) | $55,800 (down slightly from $56,400) |
| Median Income (16+ years experience) | $92,500 |
| Brokerage Firms in U.S. | 360,000+ |
| Independent Contractors | 88% of agents are independent contractors |
| CRM Usage | 65–75% of agents use CRM tools |
| E-signature Adoption | 79%) of Realtors use e-signature platforms |
These stats show a profession that’s big, diverse, and—let’s be honest—sometimes a little chaotic. But that’s what keeps it interesting, right?
The Real Estate Market in 2026: Key Trends
If you’ve been in real estate for more than five minutes, you know the only constant is change. Heading into 2026, here’s what’s shaping the market:
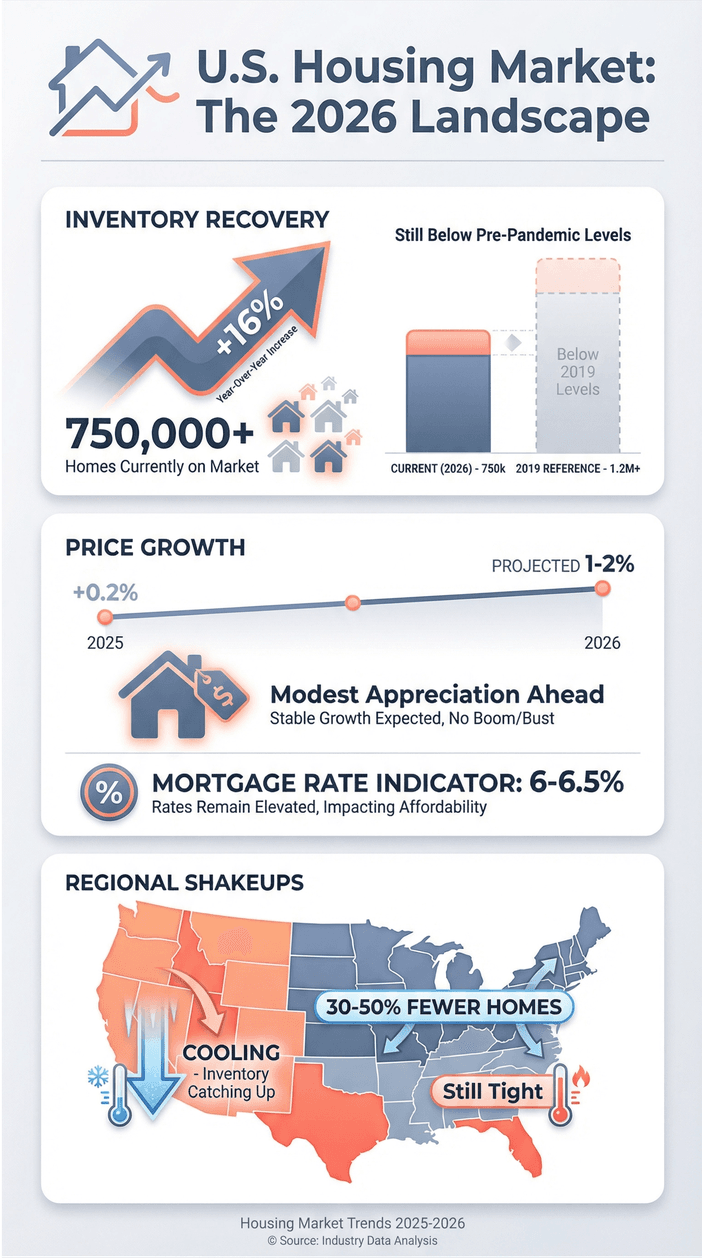
- Inventory Is (Finally) Rising: After years of scraping the bottom of the barrel, U.S. housing inventory is up , but still below pre-pandemic levels. There are now about 750,000+ homes on the market nationally—still not enough to throw a housewarming party for every buyer, but at least you don’t have to arm-wrestle for every listing.
- Price Growth Is Modest: The national median home price was basically flat in 2025 (), and 2026 is projected to see . Affordability is the big hurdle—mortgage rates are still hovering around 6–6.5%, and first-time buyers are feeling the squeeze.
- Regional Shakeups: Sun Belt and Mountain West markets (think Texas, Florida, Utah) are cooling a bit as inventory catches up, while Midwest and Northeast cities still have than before the pandemic.
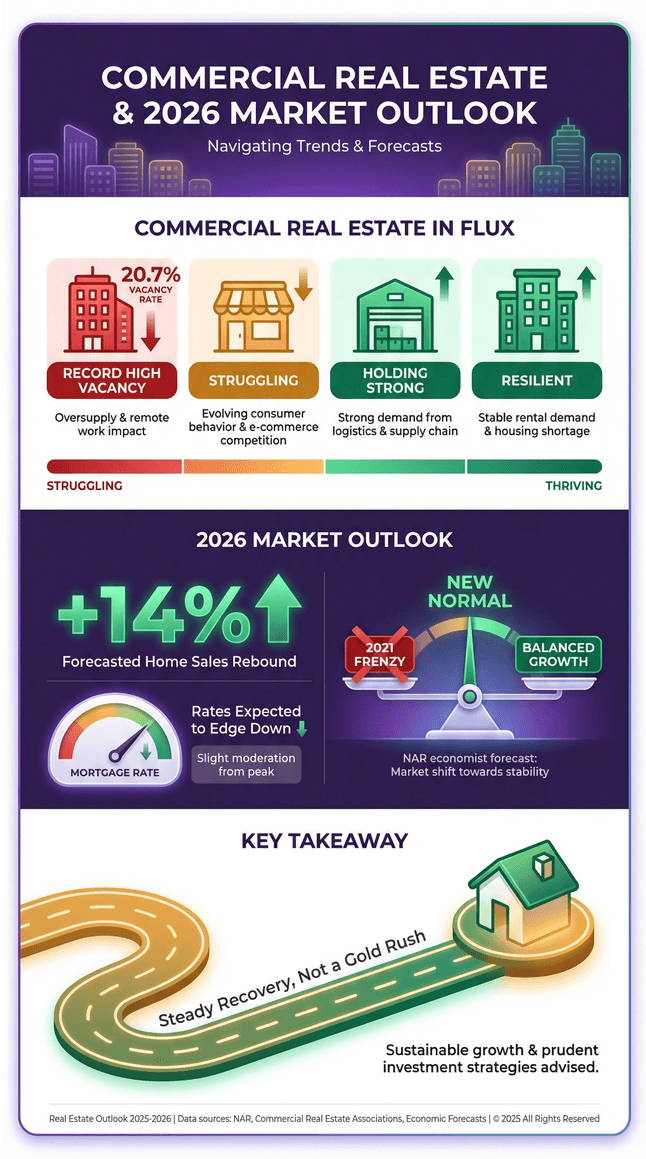
- Commercial Real Estate Is in Flux: Office vacancy rates hit a record , especially in big cities. Industrial and multifamily properties are holding strong, but retail and office? Let’s just say, if those walls could talk, they’d be asking for a new lease on life.
- Market Outlook: NAR’s chief economist is forecasting a , with mortgage rates expected to edge down slightly. But don’t expect a return to the 2021 frenzy—think “new normal,” not “new gold rush.”
 For agents, this means more opportunities, but also more competition and a need to be hyper-local and data-driven. The days of “list it and forget it” are over.
Who Are Today’s Real Estate Agents?
The face of real estate is changing, but some things stay the same (like the love of a good open house snack table). Here’s what the agent community looks like in 2026:
- Age & Gender: The , with 65% women. Real estate remains a popular second career, but younger, tech-savvy agents are starting to make their mark.
- Ethnic Diversity: Still predominantly White (79%), but among agents with two years or less experience, . That’s a promising sign for the future.
- Education: About , and 13% hold a graduate degree. Most agents come from other industries—finance, education, sales—before jumping into real estate.
- Experience: The median tenure is , but there’s a split: lots of newbies (thanks, 2020–2021 boom) and a solid core of veterans (16% have 25+ years in the business).
- Specialties: Most agents focus on residential, but property management, relocation, and commercial are common secondary specialties. Niche markets (luxury, green homes, senior downsizing) are growing.
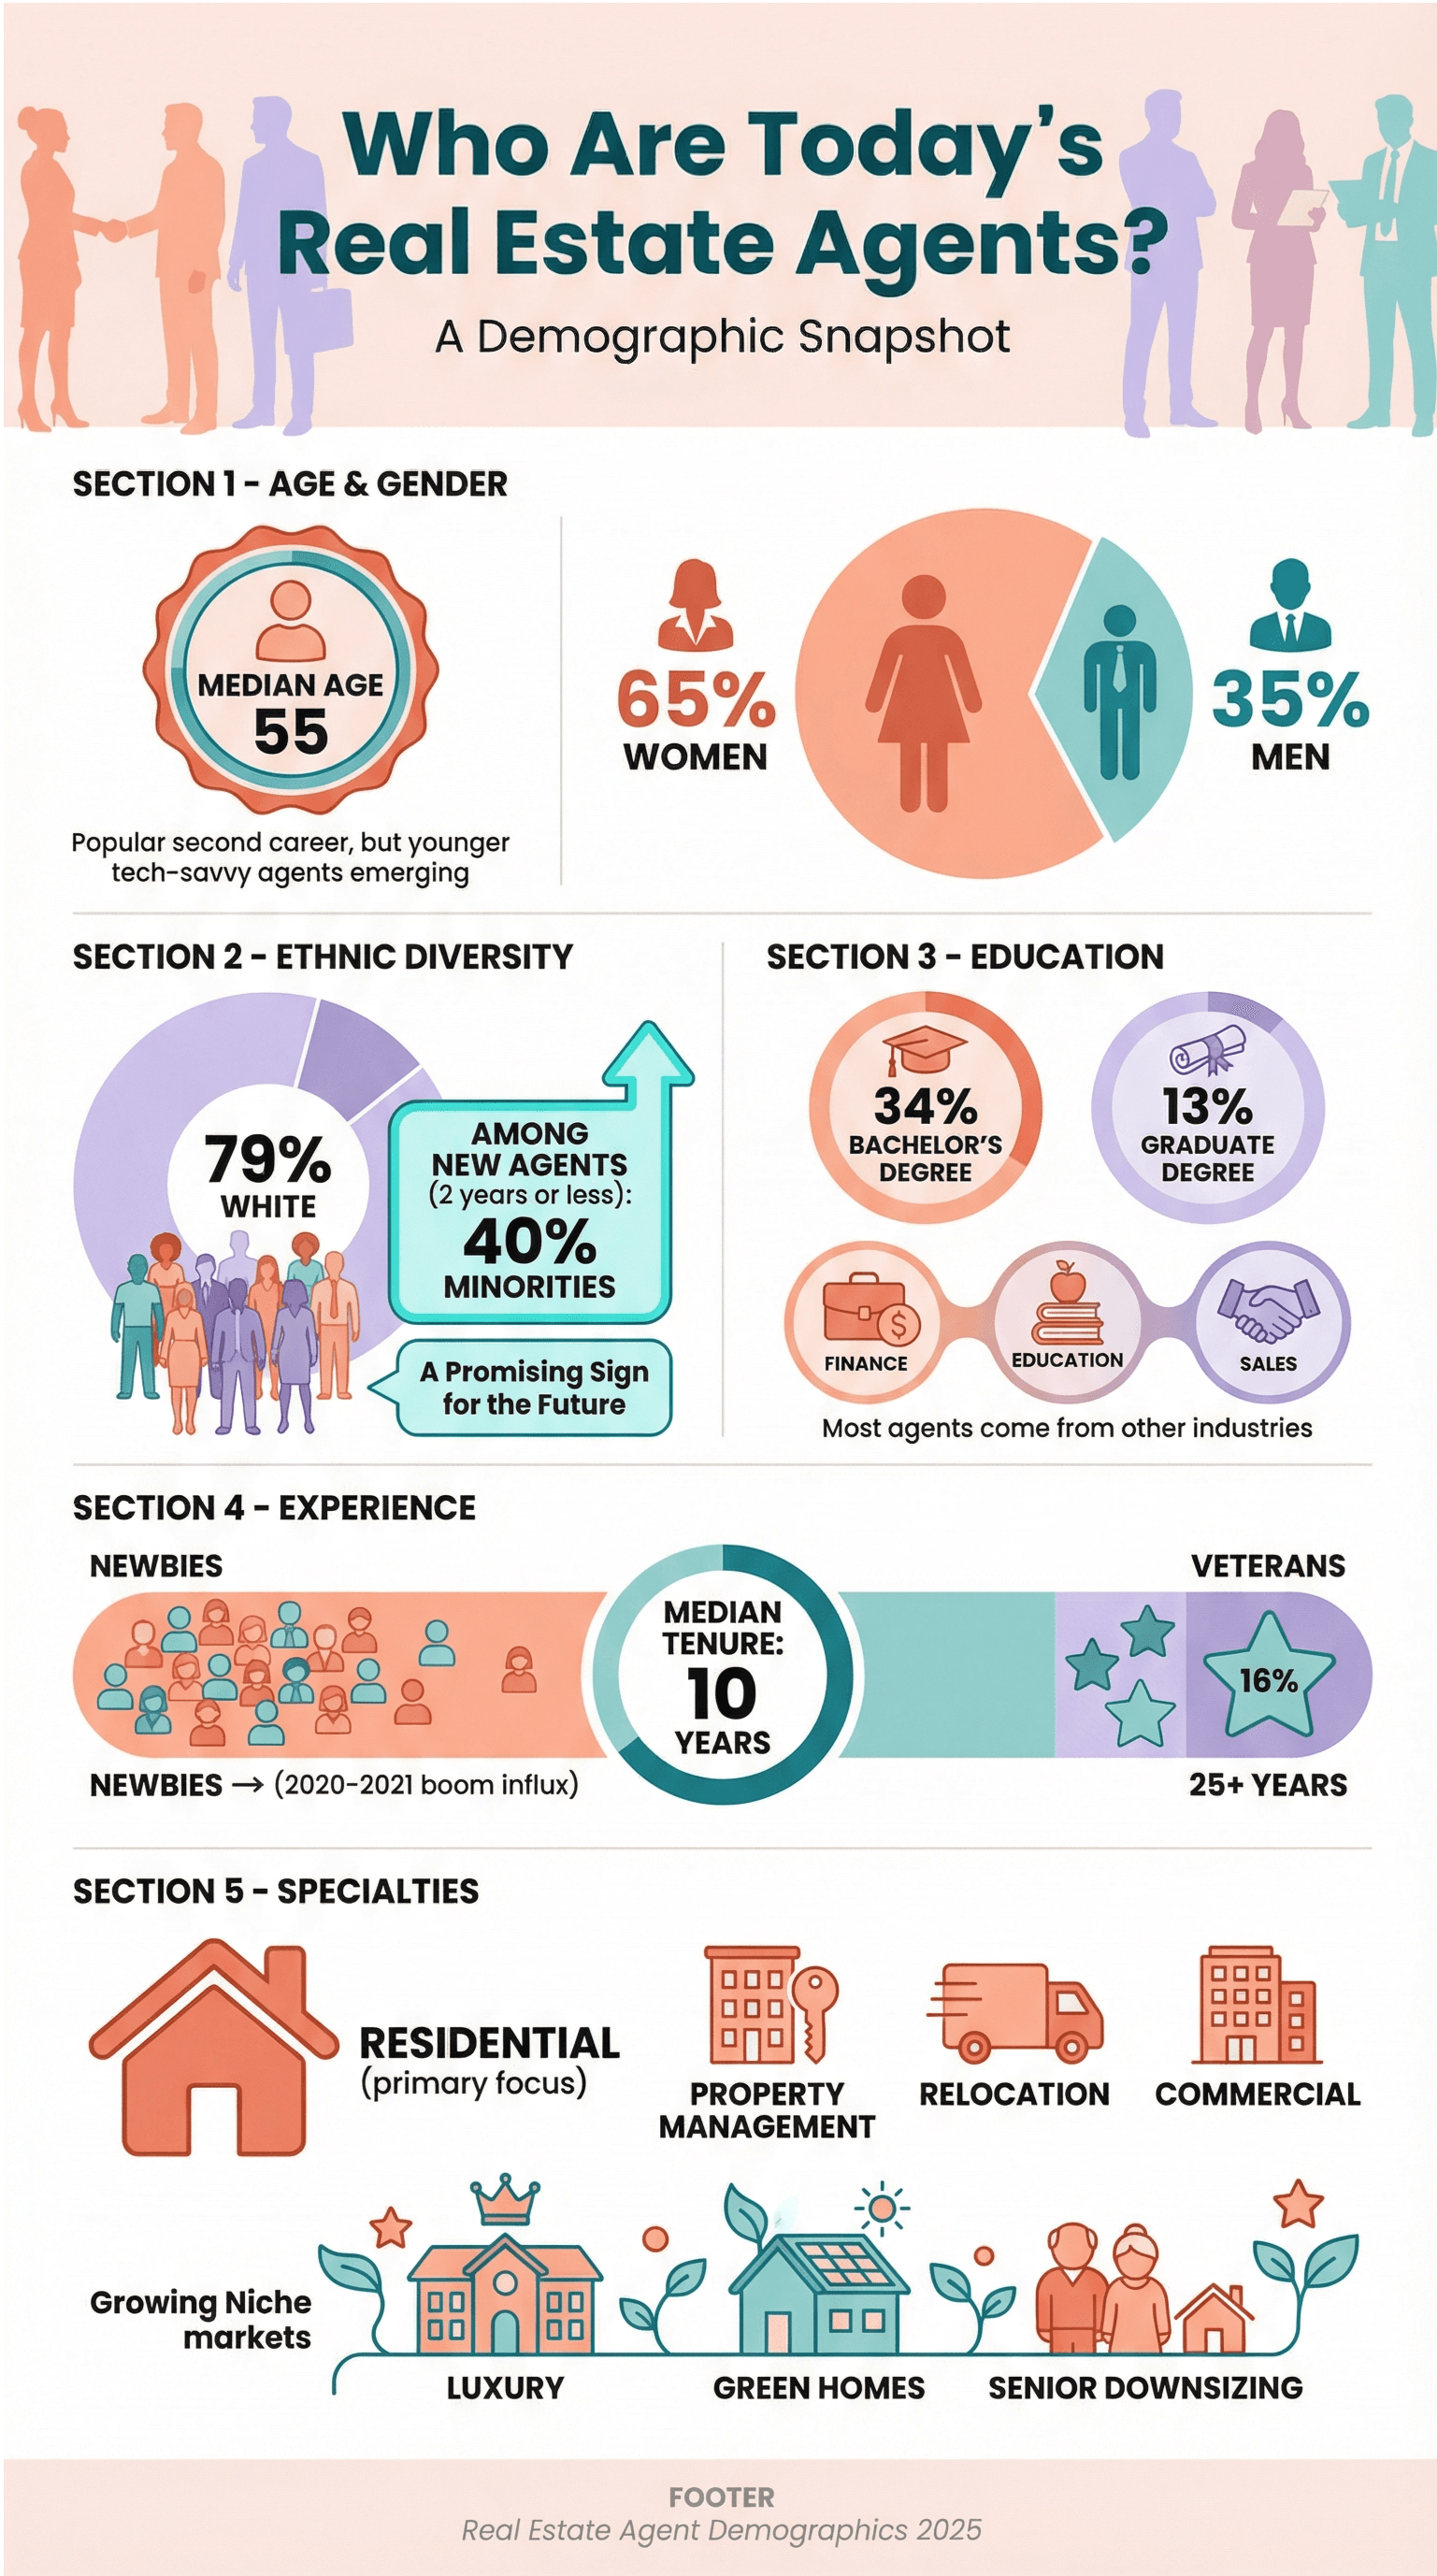 The upshot? The “typical” agent is still a 55-year-old White woman, but the next generation is younger, more diverse, and more tech-forward.
Real Estate Agent Earnings and Income Insights
Let’s talk money—because, let’s face it, nobody gets into real estate for the free yard signs.
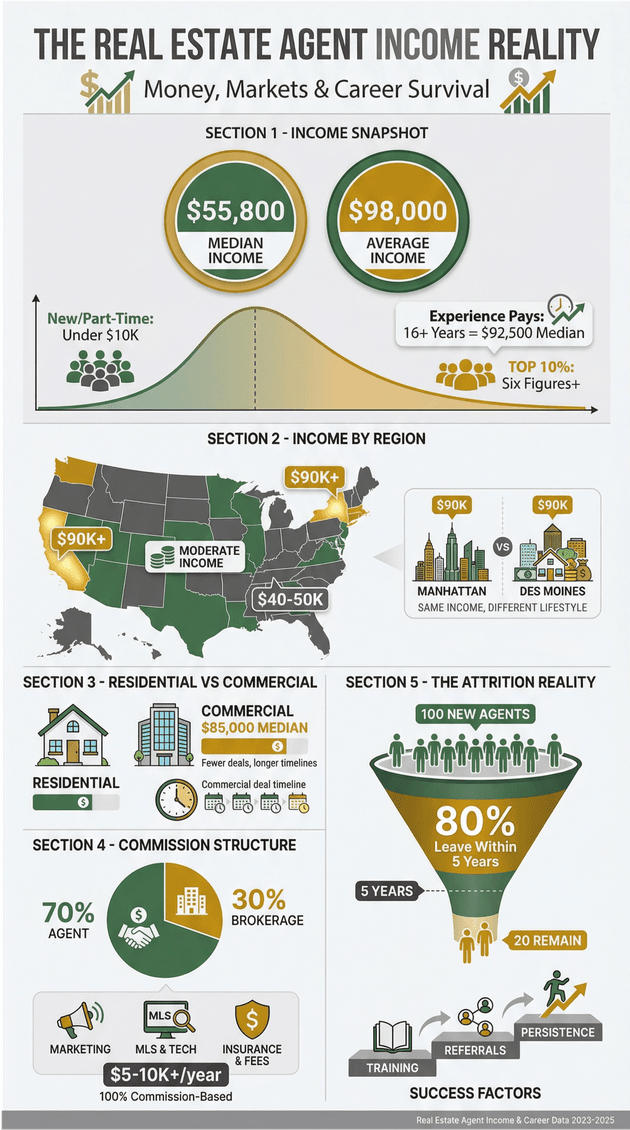
- Median Income: for Realtors in 2023, down slightly from the year before. For agents with 16+ years’ experience, the median jumps to .
- Average Income: Hovers around , but the distribution is lopsided—the top 10% of agents earn six figures or more, while many new or part-time agents make under $10,000.
- Income by Region: Agents in high-cost states (NY, CA, MA) often earn $90k+, while rural or lower-priced markets average $40–50k. Cost of living matters—a $90k income in Manhattan isn’t quite the same as $90k in Des Moines.
- Residential vs. Commercial: Commercial agents typically earn more (median ~$85,000), but deals are fewer and take longer to close.
- Commission Structure: Most agents are 100% commission-based, with typical splits around 70/30 (agent/brokerage). Expenses (marketing, MLS fees, insurance) can eat up $5–10k+ per year.
- Attrition: The churn is real—about 80% of new agents leave within five years. Those who stick it out, invest in training, and build a referral base tend to thrive.
 Bottom line: Real estate income is a rollercoaster. If you’re in it for the long haul, focus on training, mentorship, and building a strong network.
Technology and the Modern Real Estate Agent
If you’re still printing out MapQuest directions to showings, it’s time for an upgrade. Technology is now the backbone of a successful real estate business.
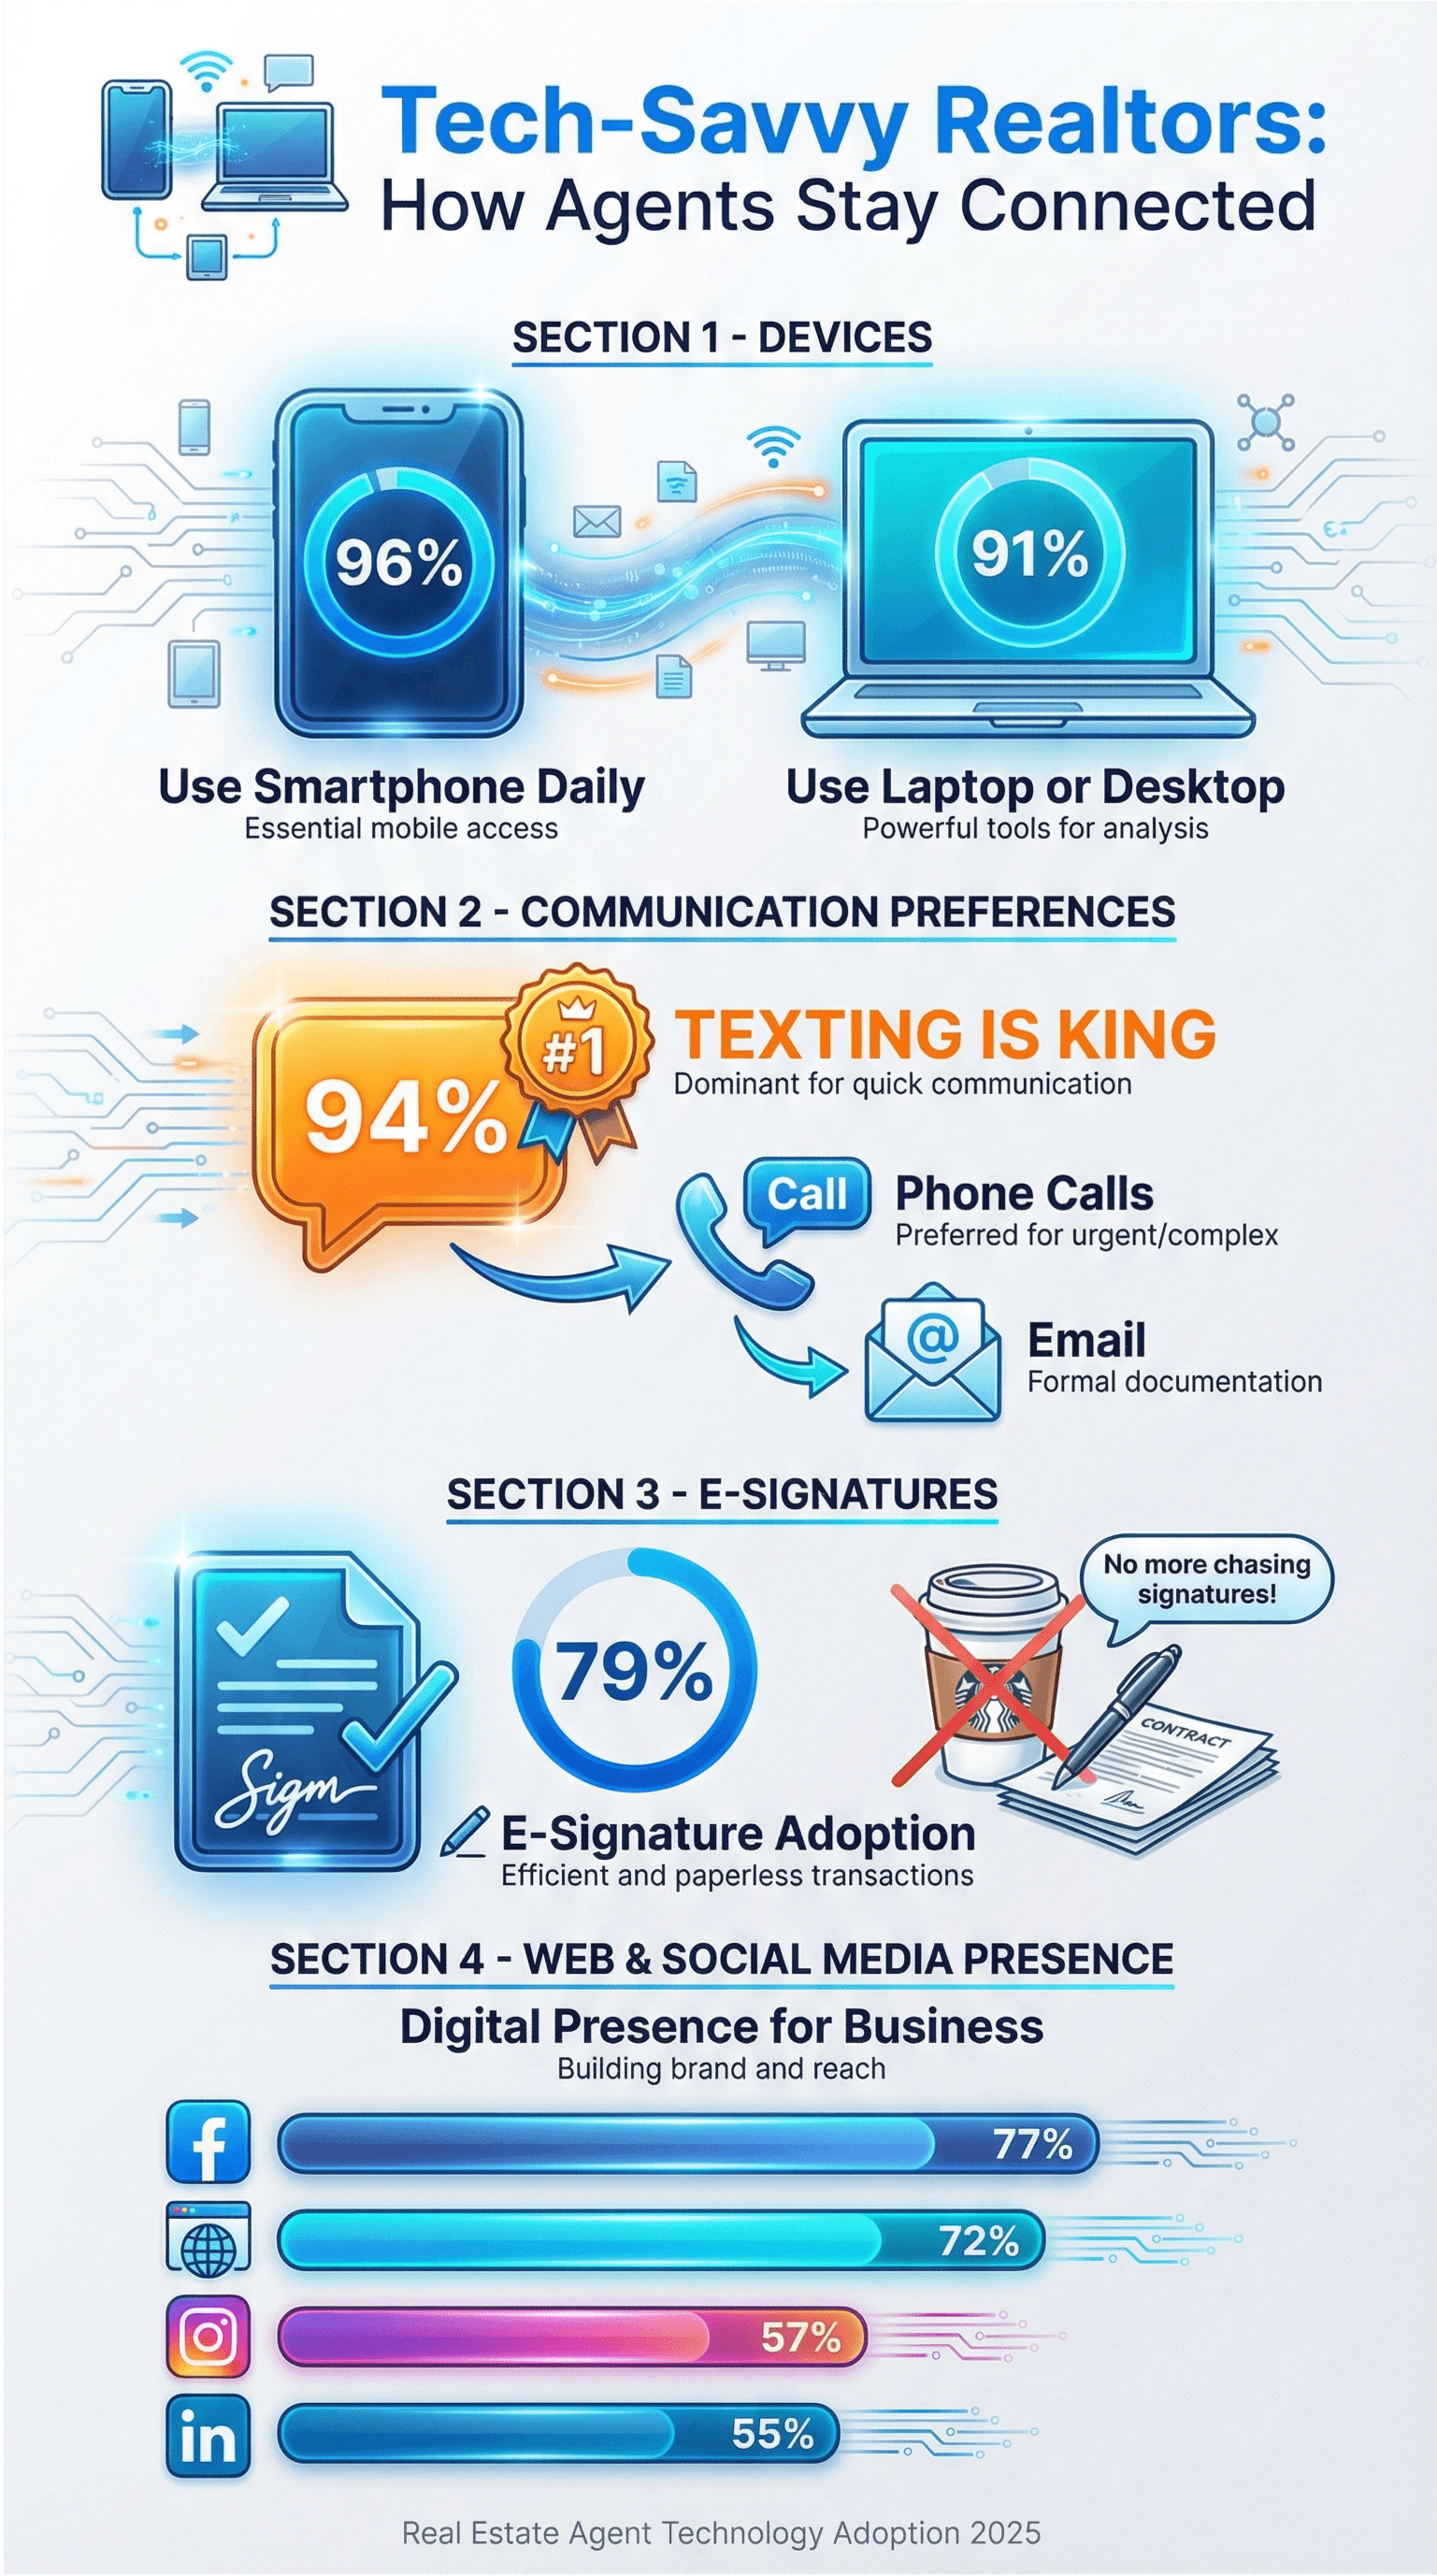
- Smartphones & Laptops: ), and 91% use a laptop or desktop.
- Texting Is King: ), followed by phone calls and email.
- E-signatures: )—no more chasing signatures at Starbucks.
- Web & Social Media: ), 77% use Facebook, 57% use Instagram, and 55% use LinkedIn for business.
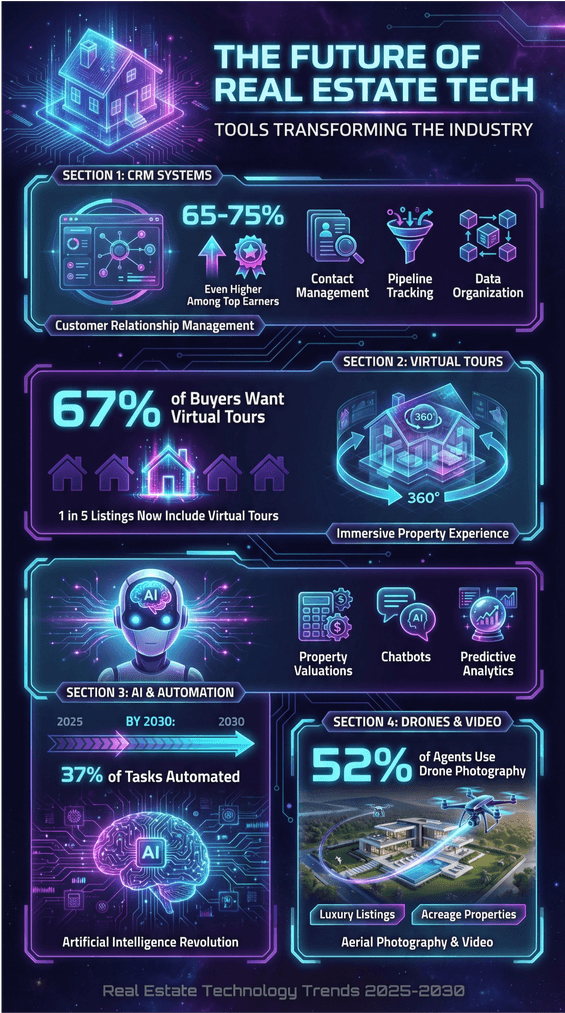
- CRM Systems: , and among high earners, it’s even higher.
- Virtual Tours: ), and 1 in 5 listings now includes one.
- AI & Automation: AI is starting to handle everything from property valuations to chatbots and predictive analytics. By 2030, .
- Drones & Video: ), especially for luxury or acreage listings.
 The takeaway? Tech isn’t replacing agents, but it’s making the best agents even better. If you’re not embracing new tools, you’re leaving business on the table (and probably missing out on some great memes, too).
If you want to automate your research, streamline lead generation, or just keep up with the latest listings, is an AI-powered web scraper that can help you extract property data, contact info, and more in just a few clicks. Try it out and see how much time you can save.
Real Estate Agent Lead Generation: What’s Working in 2026?
No leads, no deals. Here’s what’s filling agent pipelines in 2026:
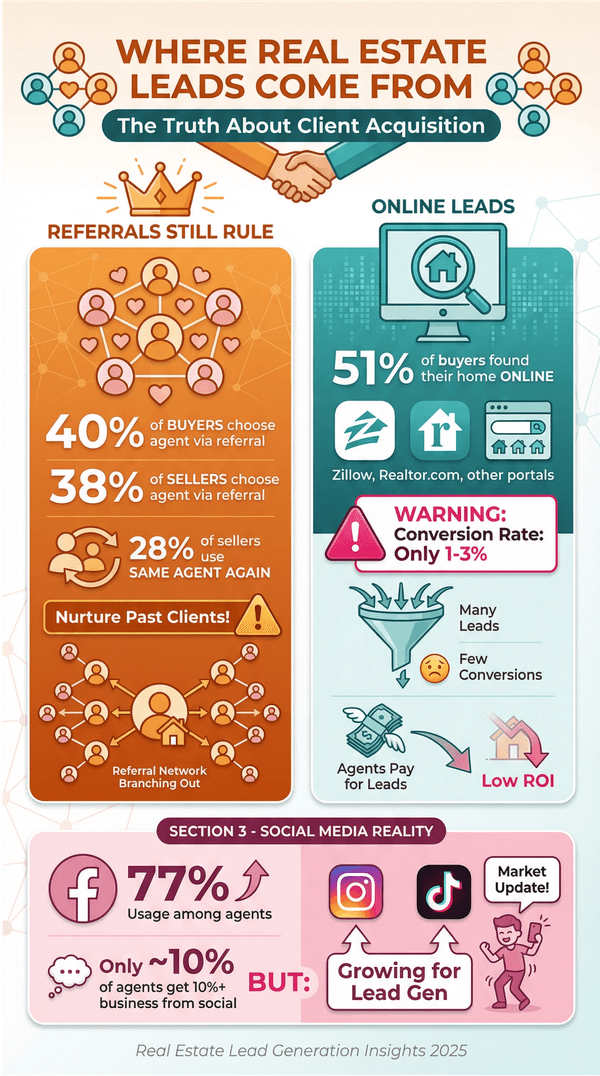
- Referrals Still Rule: and choose their agent via referral. Another 28% of sellers use the same agent again. If you’re not nurturing your past clients, you’re missing out.
- Online Leads: . Agents pay for leads on Zillow, Realtor.com, and others, but conversion rates are low (1–3%).
- Social Media: 77% of agents use Facebook, but only about 10% get 10% or more of their business from social. Still, platforms like Instagram and TikTok are growing for lead gen—especially if you can dance and do a market update at the same time.
- Open Houses & Networking: Old-school, but still effective—especially when paired with Facebook Live or virtual open houses.
- AI Lead Nurturing: Automated text/email drips keep prospects warm. Home valuation landing pages are popular for capturing seller leads.
- Agent-to-Agent Referrals: National networks and social groups are fueling more cross-market deals.
The most effective strategy? The one you actually work consistently. Referrals and repeat clients have the highest conversion rates, but a balanced approach is key.
The Role of Real Estate Agents in Home Buying and Selling
With all the online tools out there, do people still need agents? The answer: a resounding yes.
- Agent Usage: and use an agent. FSBOs are down to just 6% of sales.
- Why Sellers Use Agents: Agents market, negotiate, and handle paperwork. The typical FSBO home sells for than agent-assisted sales.
- Why Buyers Use Agents: Agents help find homes, schedule tours, negotiate, and coordinate with lenders and inspectors. .
- Transaction Management: Agents are the project managers—herding cats (and sometimes clients) to get to closing.
- Emotional Support: Buying or selling is stressful. Agents are part therapist, part negotiator, part local tour guide.
 The role is evolving—agents are now consultants and strategists, not just gatekeepers of listings.
Real Estate Agent Challenges in 2026
It’s not all commission checks and closing gifts. Here’s what’s keeping agents up at night:
- Low Inventory & Fierce Competition: More agents chasing fewer listings. It’s a “hunger games” scenario in some markets.
- Market Volatility: Income swings with the market. NAR membership dropped as some agents left the business.
- Commission Lawsuits: A against NAR is changing how commissions are structured. Agents may have to justify their value more than ever.
- Tech Disruption: Competing with algorithms, iBuyers, and discount brokerages. Agents must prove their worth beyond what a website can offer.
- Regulatory Hurdles: New rules, fair housing requirements, and data privacy laws keep everyone on their toes.
- Client Expectations: Today’s clients expect instant responses and expert advice—sometimes at 9pm on a Sunday.
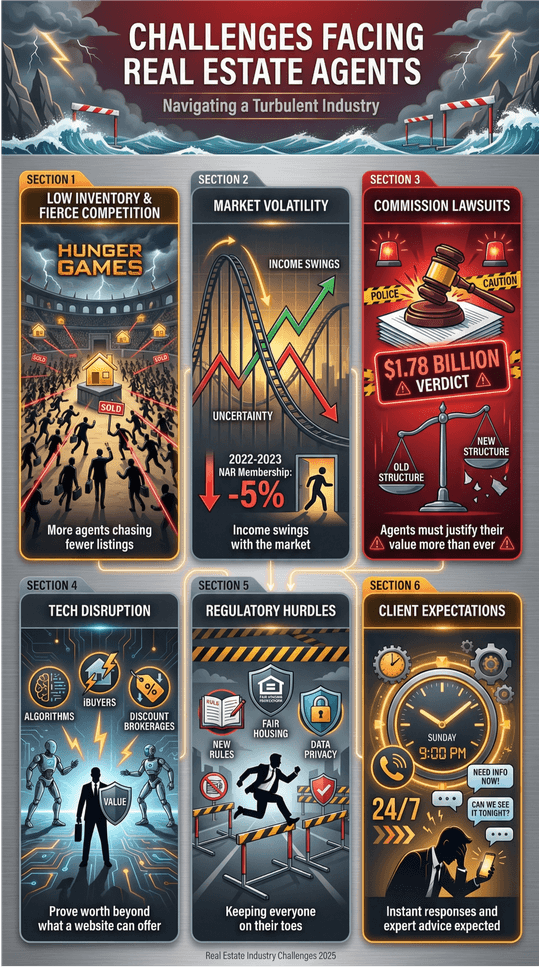 The agents who thrive are those who adapt, manage their finances, and keep learning.
Diversity and Inclusion in Real Estate
The industry is making progress, but there’s still work to do:
- Gender: , and women are increasingly moving into leadership roles.
- Ethnic Diversity: 79% White, but among new agents, . Industry groups like NAHREP and NAREB are working to boost minority representation.
- Initiatives: NAR’s “Leading with Diversity” and other mentorship programs are helping, but high entry costs and subtle barriers remain.
- Inclusive Marketing: More diverse faces in ads and office cultures. Groups like the LGBTQ+ Real Estate Alliance are making the industry more welcoming.
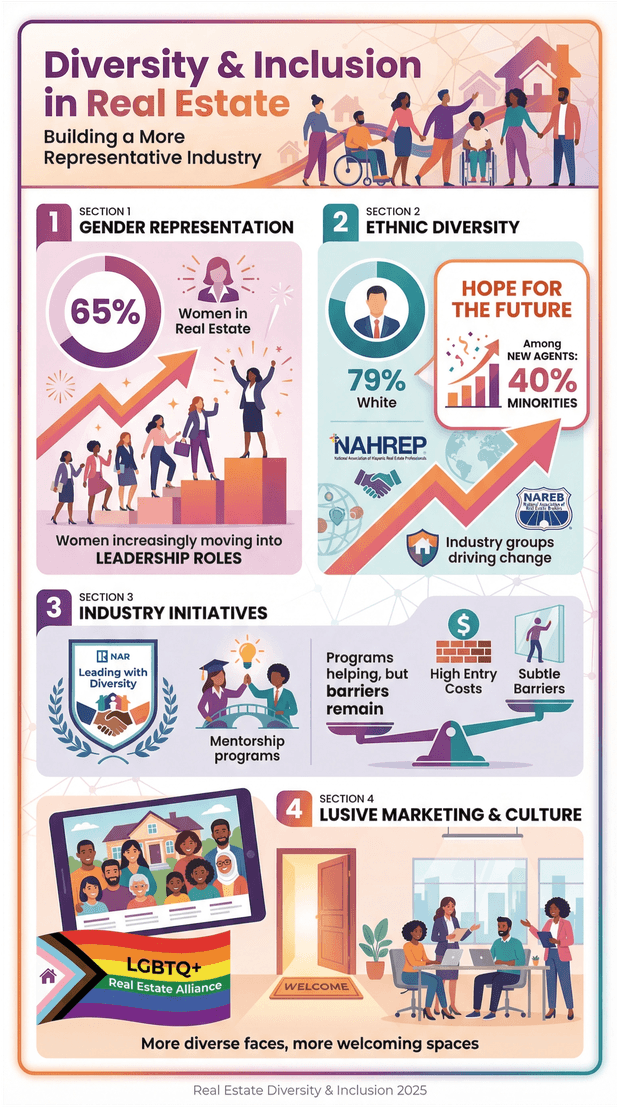 A more diverse agent force isn’t just the right thing to do—it’s good business as America’s homebuyer demographics shift.
Real Estate Agent Education and Training
You don’t need a PhD, but you do need to keep learning:
- Licensing: State requirements vary—California requires , Florida 63, New York 75, Texas 180.
- Continuing Education: Ongoing CE is mandatory—, with fair housing and ethics required in many states.
- Designations: GRI, ABR, CRS, SRES, and others help agents specialize and stand out.
- Broker License: 22% of NAR members are brokers, requiring additional education and experience.
- Mentorship: Most new agents join teams or seek mentors. Real-world training is crucial—passing the test is just the start.
- Ongoing Learning: Top agents invest in coaching, webinars, and advanced designations to stay sharp.
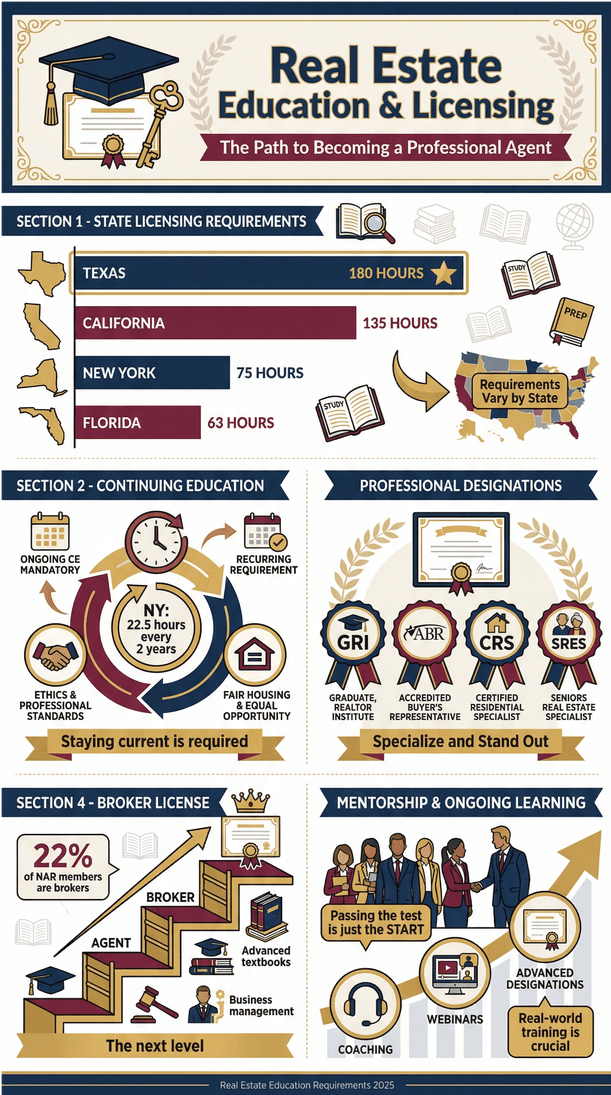 The best agents are lifelong learners—because the market never stops changing.
The Future of the Real Estate Agent Profession
So, what’s next? Here’s where the industry is heading:
- Advisor, Not Just Salesperson: Agents are becoming consultants—helping clients manage real estate as a lifelong investment, not just a one-time transaction.
- Tech-Enabled, Lean Operations: Cloud-based brokerages, AI assistants, and automation will handle more of the busywork. Agents will focus on what tech can’t do: building relationships and negotiating.
- Fewer Agents, More Professionalism: Expect a smaller, more skilled workforce as commission structures change and entry requirements potentially rise.
- Specialization: Agents will carve out niches—luxury, green homes, relocation, etc.—and teams will become even more common.
- Human Touch Remains Essential: Emotional intelligence, local expertise, and personal service will always be in demand.
- New Revenue Streams: Flat fees, consulting, property management, and other services will supplement traditional commissions.
- Globalization: Agents will work with more out-of-state and international clients, requiring broader knowledge and networks.
In short, the profession is evolving, but the core value—helping people navigate complex, emotional transactions—remains.
Key Takeaways for Real Estate Agents and Industry Stakeholders
Let’s wrap up with the big lessons from these 45 insights:
- The Market Is Huge—And Growing: Real estate is the world’s largest asset class. There’s plenty of opportunity, even if the short-term cycles get bumpy.
- Agent Ranks Are Competitive: With 3 million licensed agents in the U.S., standing out takes training, tech, and tenacity.
- Adapt or Get Left Behind: Embrace technology, keep learning, and be the local economist for your clients.
- Lead Generation Is a Mix: Referrals are gold, but online and social media are growing. Diversify your approach.
- Clients Still Want Agents: 88% of buyers and 90% of sellers use agents—just be ready to prove your value.
- Prepare for Change: Commission structures, tech disruption, and regulatory shifts are coming. Stay agile.
- Diversity Is the Future: The next generation of agents is more diverse—embrace inclusion for business growth.
- Education Never Stops: Invest in your skills, designations, and knowledge to stay ahead.
- Play the Long Game: Real estate rewards those who build relationships and think in decades, not just deals.
 For industry leaders, the message is clear: support your agents with training, technology, and inclusion initiatives. For agents, keep your eyes on the data, your heart in the community, and your mind open to change.
Sources:
All statistics are drawn from the latest research by the , , , , , and more. For a full list of sources and further reading, see the links embedded throughout this post.
If you’re looking to level up your data game, automate your research, or just want to see how AI can help you keep up with the ever-changing real estate landscape, check out —our AI-powered web scraper and productivity tool for sales, marketing, and real estate teams. And for more industry insights, don’t miss the .
Here’s to smarter decisions, stronger client relationships, and a little less stress in 2026. Now, if only AI could help with those open house cookies…