
Picture this: It’s Monday morning, you’re sipping your coffee, and your inbox is already overflowing with campaign reports, budget requests, and a dozen “urgent” Slack pings. You know digital marketing is moving faster than ever, but how do you cut through the noise and actually make decisions that move the needle? Here’s the secret: data. Not just any data—the right digital marketing statistics that show where the industry is headed and what’s working right now.
Let’s be real: in 2026, digital marketing isn’t just a piece of the puzzle—it is the puzzle. With global digital ad spend projected to hit a jaw-dropping , and marketers seeing an average of $5 in revenue for every $1 spent, the stakes (and opportunities) have never been higher. As Dan Zarrella put it, “Marketing without data is like driving with your eyes closed.” So buckle up—here are the 40 digital marketing stats you need to steer your campaigns to success in 2026.
Quick-Glance: Top 10 Digital Marketing Statistics for 2026
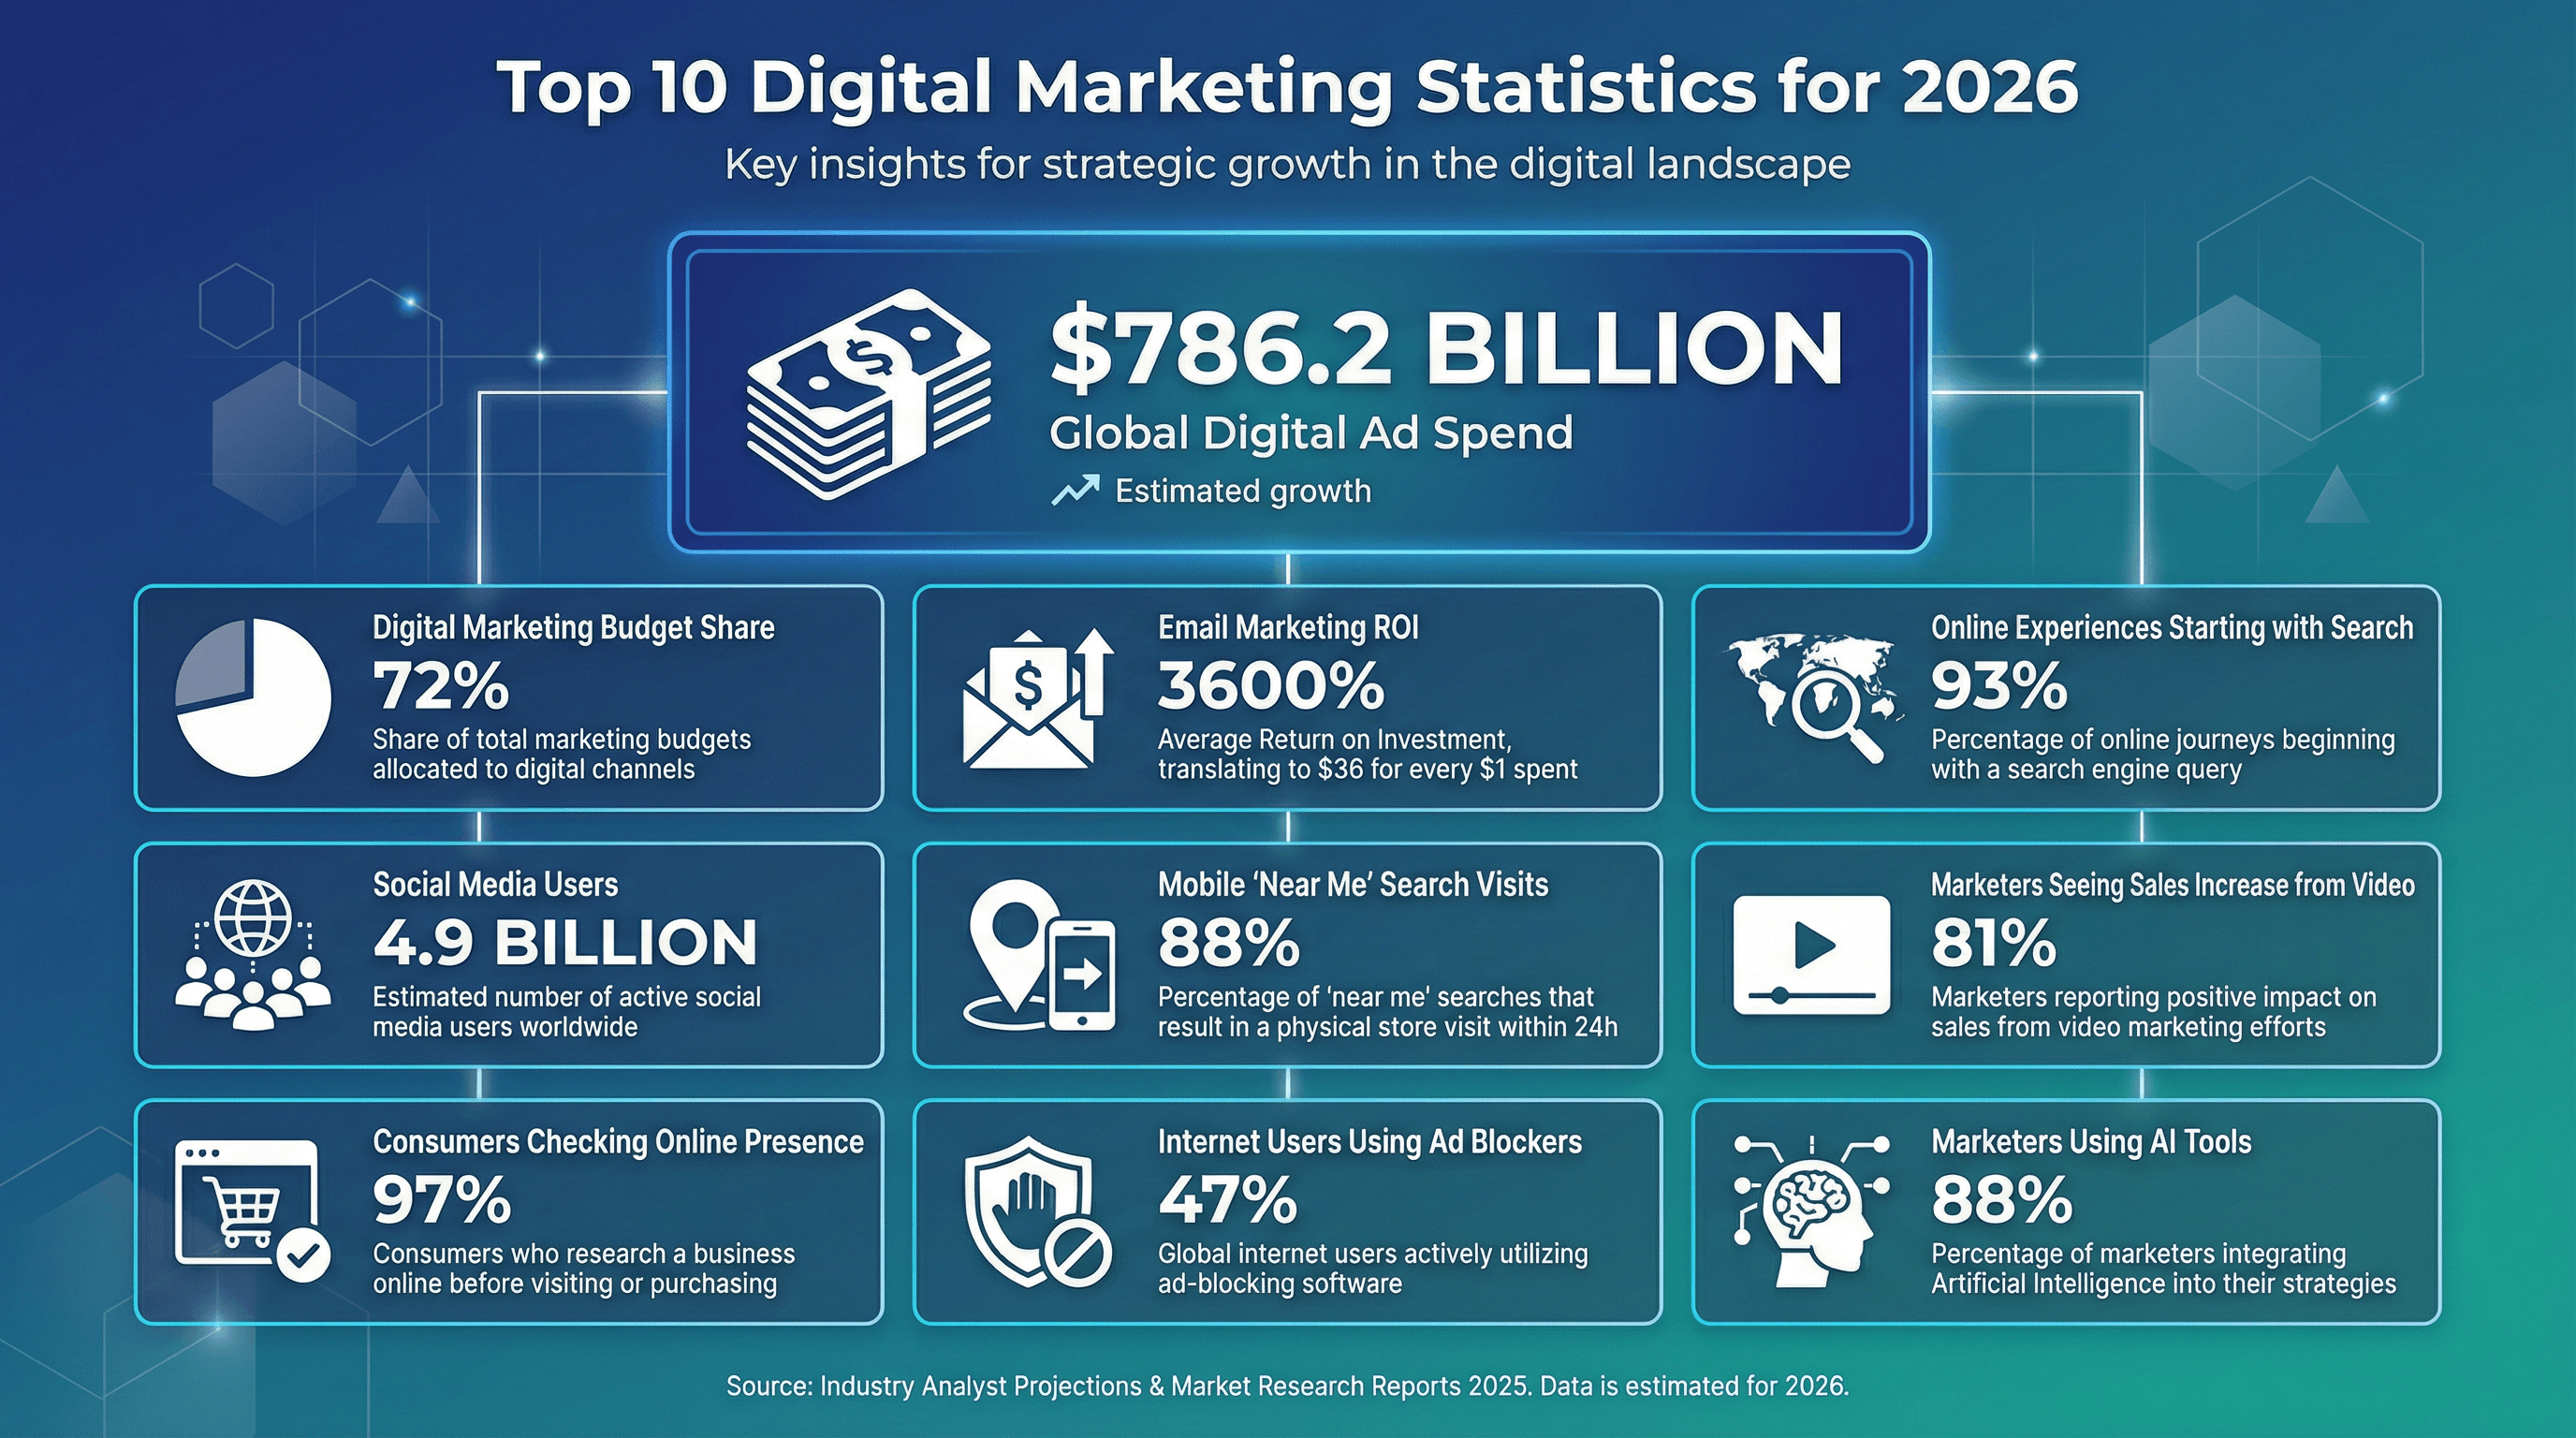 If you only have time to skim one section before your next Zoom call, make it this one. These are the headline numbers shaping digital marketing in 2026:
| Statistic | 2026 Value |
|---|---|
| Projected global digital ad & marketing industry size | $786.2 billion |
| Share of marketing budgets for digital | 72% |
| Email marketing ROI | 3600% ($36 per $1 spent) |
| Online experiences starting with search | 93% |
| Social media users (2023) | 4.9 billion |
| Mobile “near me” search store visits | 88% within 24 hours |
| Marketers seeing sales increase from video | 81% |
| Consumers checking online presence before buying | 97% |
| Internet users using ad blockers | 47% |
| Marketers using AI tools | 88% |
These aren’t just numbers—they’re your roadmap for smarter, more profitable campaigns.
Digital Marketing Growth Statistics: The Big Picture
 Digital marketing isn’t just growing—it’s taking over. If you’re still splitting your budget 50/50 between digital and traditional, you might want to check your calendar (and maybe your pulse).
Global Digital Marketing Spend and Growth
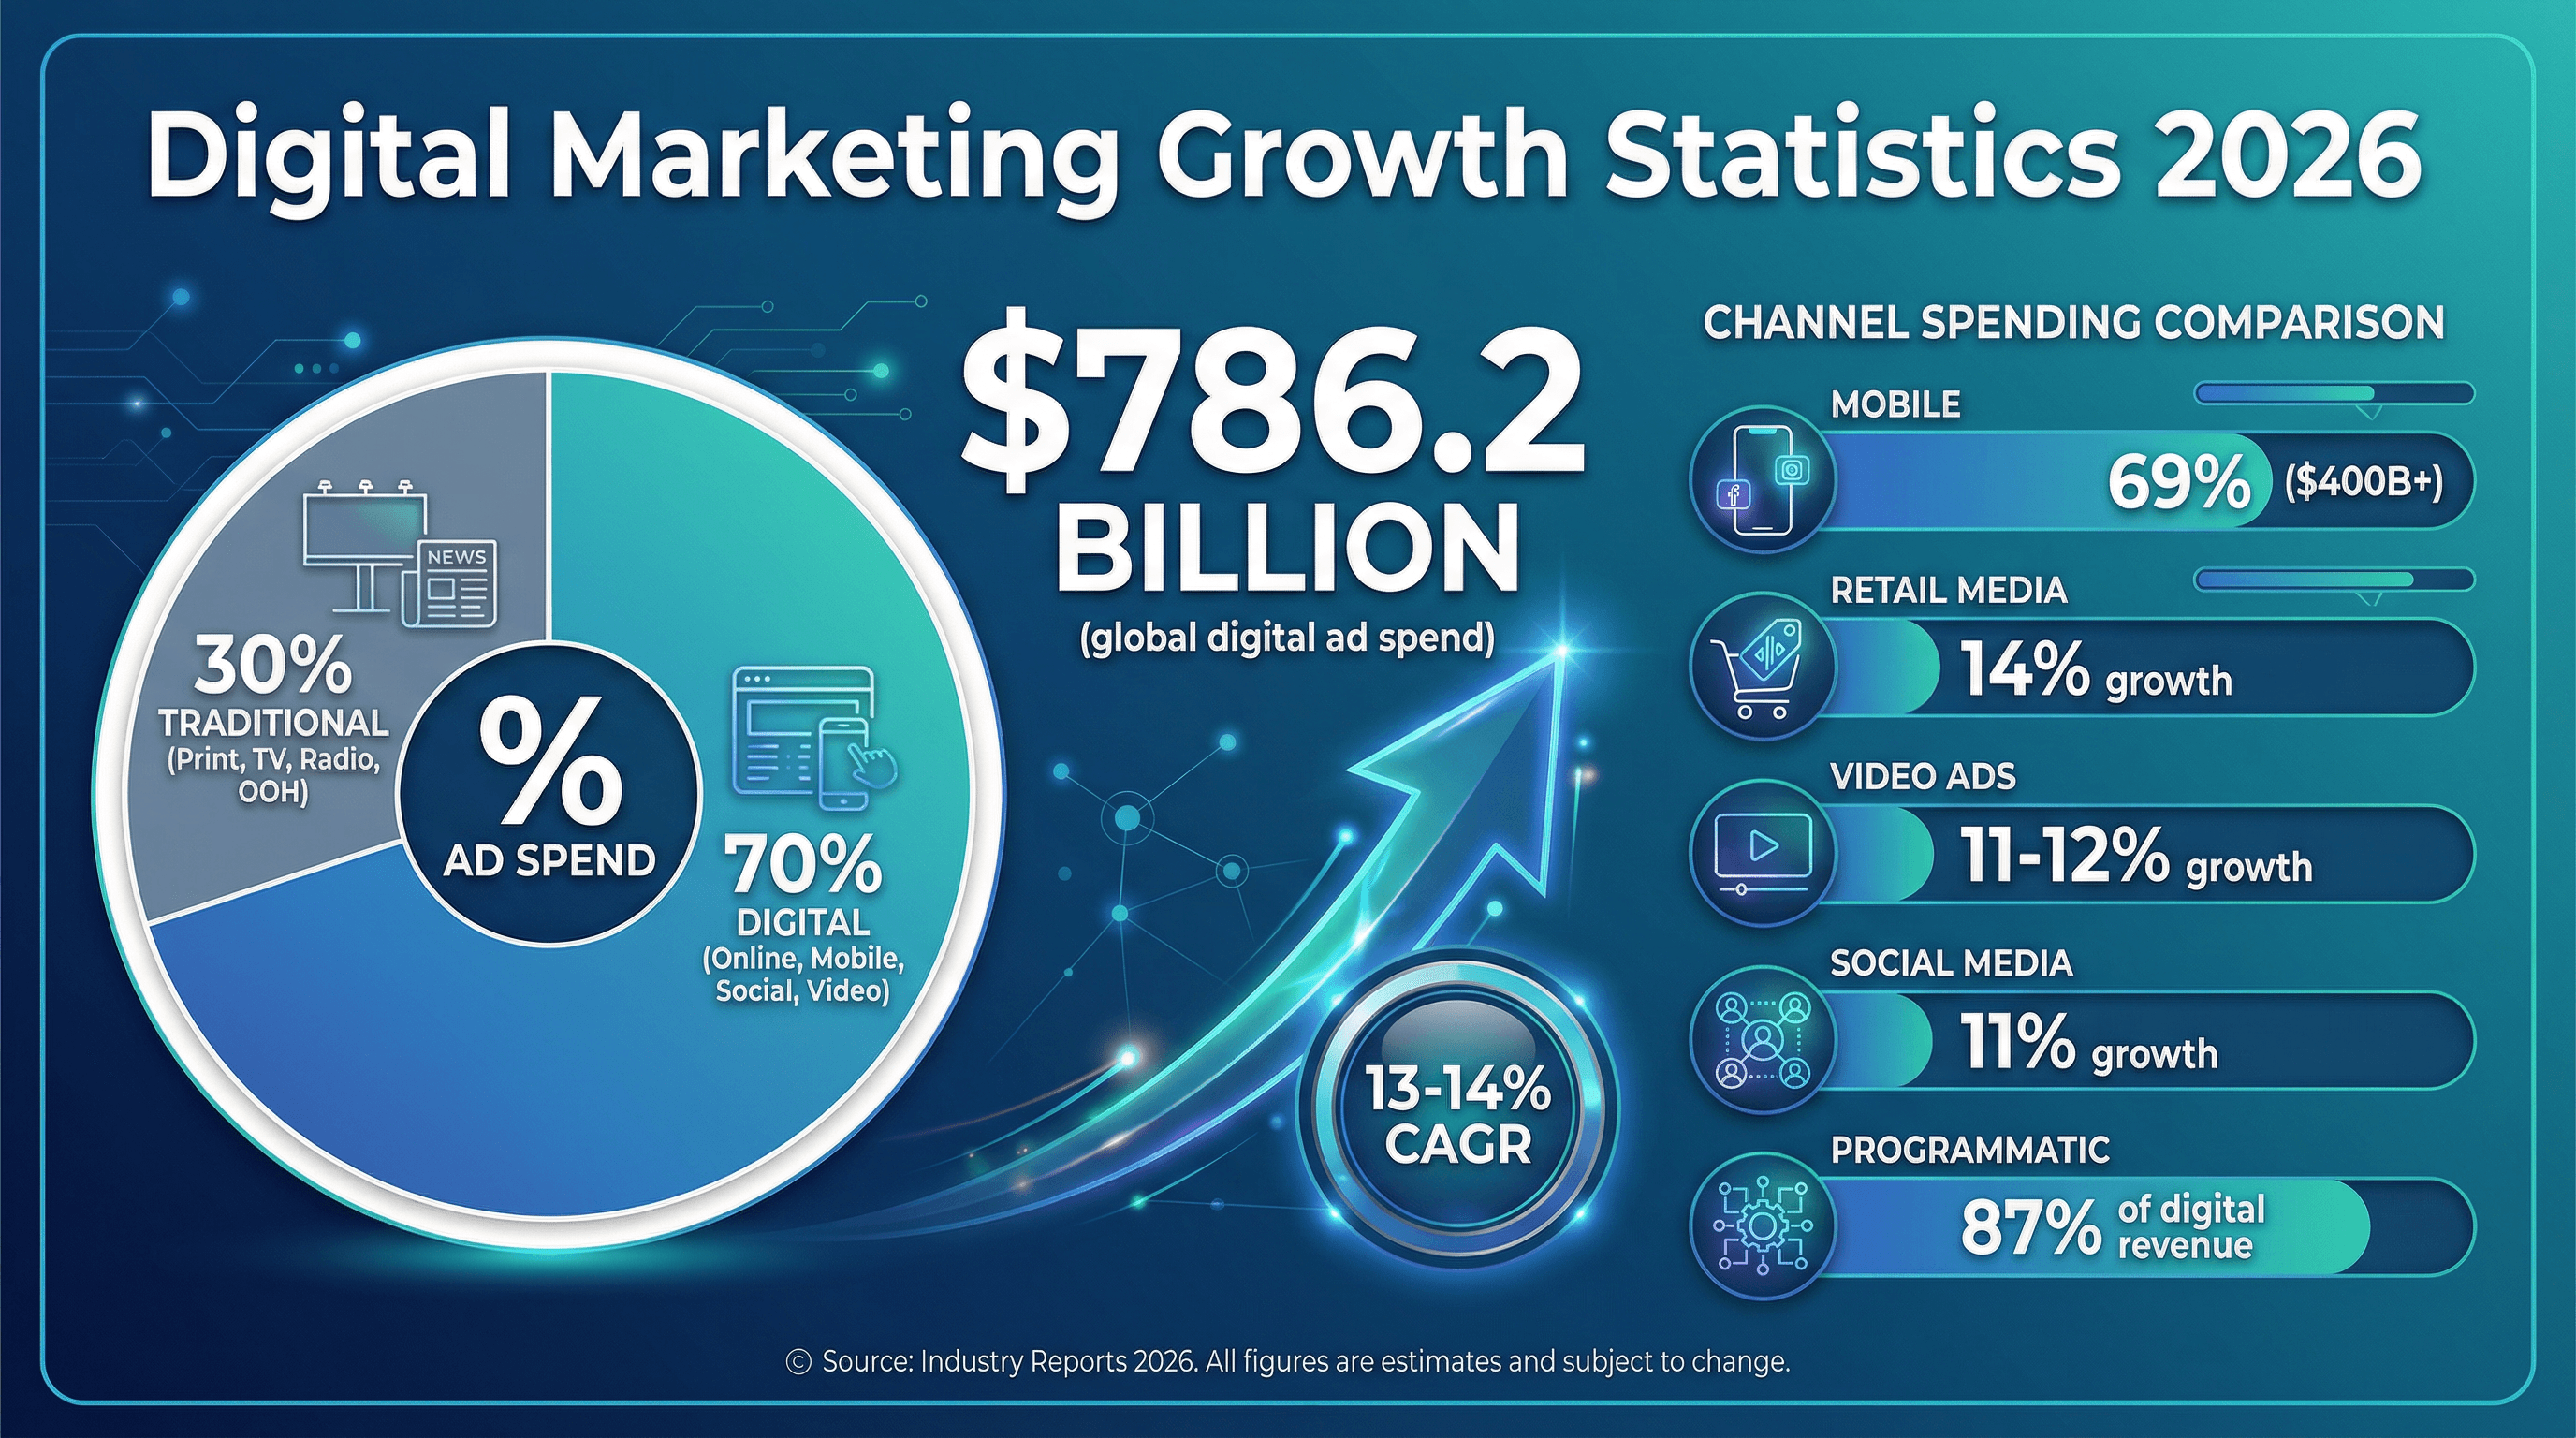
- Digital ad spend is set to hit , more than double its size in 2020.
- The industry is growing at a , outpacing the global economy and traditional ad channels.
- Nearly 70% of total global ad spend will go to digital channels in 2026.
- The Asia-Pacific region is the fastest-growing, with markets like India and China seeing double-digit annual growth.
Digital Marketing Channel Trends
- Mobile advertising dominates, accounting for over $400 billion in spend in 2023 and projected to reach 69% of all digital ad spending by 2026.
- Retail media (ads on e-commerce platforms) is the fastest-growing segment, with ~14% growth expected in 2026.
- Online video advertising is growing at 11–12% annually, fueled by platforms like YouTube and TikTok.
- Social media advertising is close behind, growing at 11% year-over-year.
- Programmatic advertising will account for by 2026.
Takeaway: Digital is the new default. If your campaigns aren’t mobile-first, video-powered, and programmatically optimized, you’re leaving serious money on the table.
Digital Marketing ROI Statistics: Proving the Value
 Let’s talk about everyone’s favorite acronym: ROI. In 2026, digital marketing isn’t just measurable—it’s delivering returns that would make even the most skeptical CFO crack a smile.
ROI Benchmarks by Channel
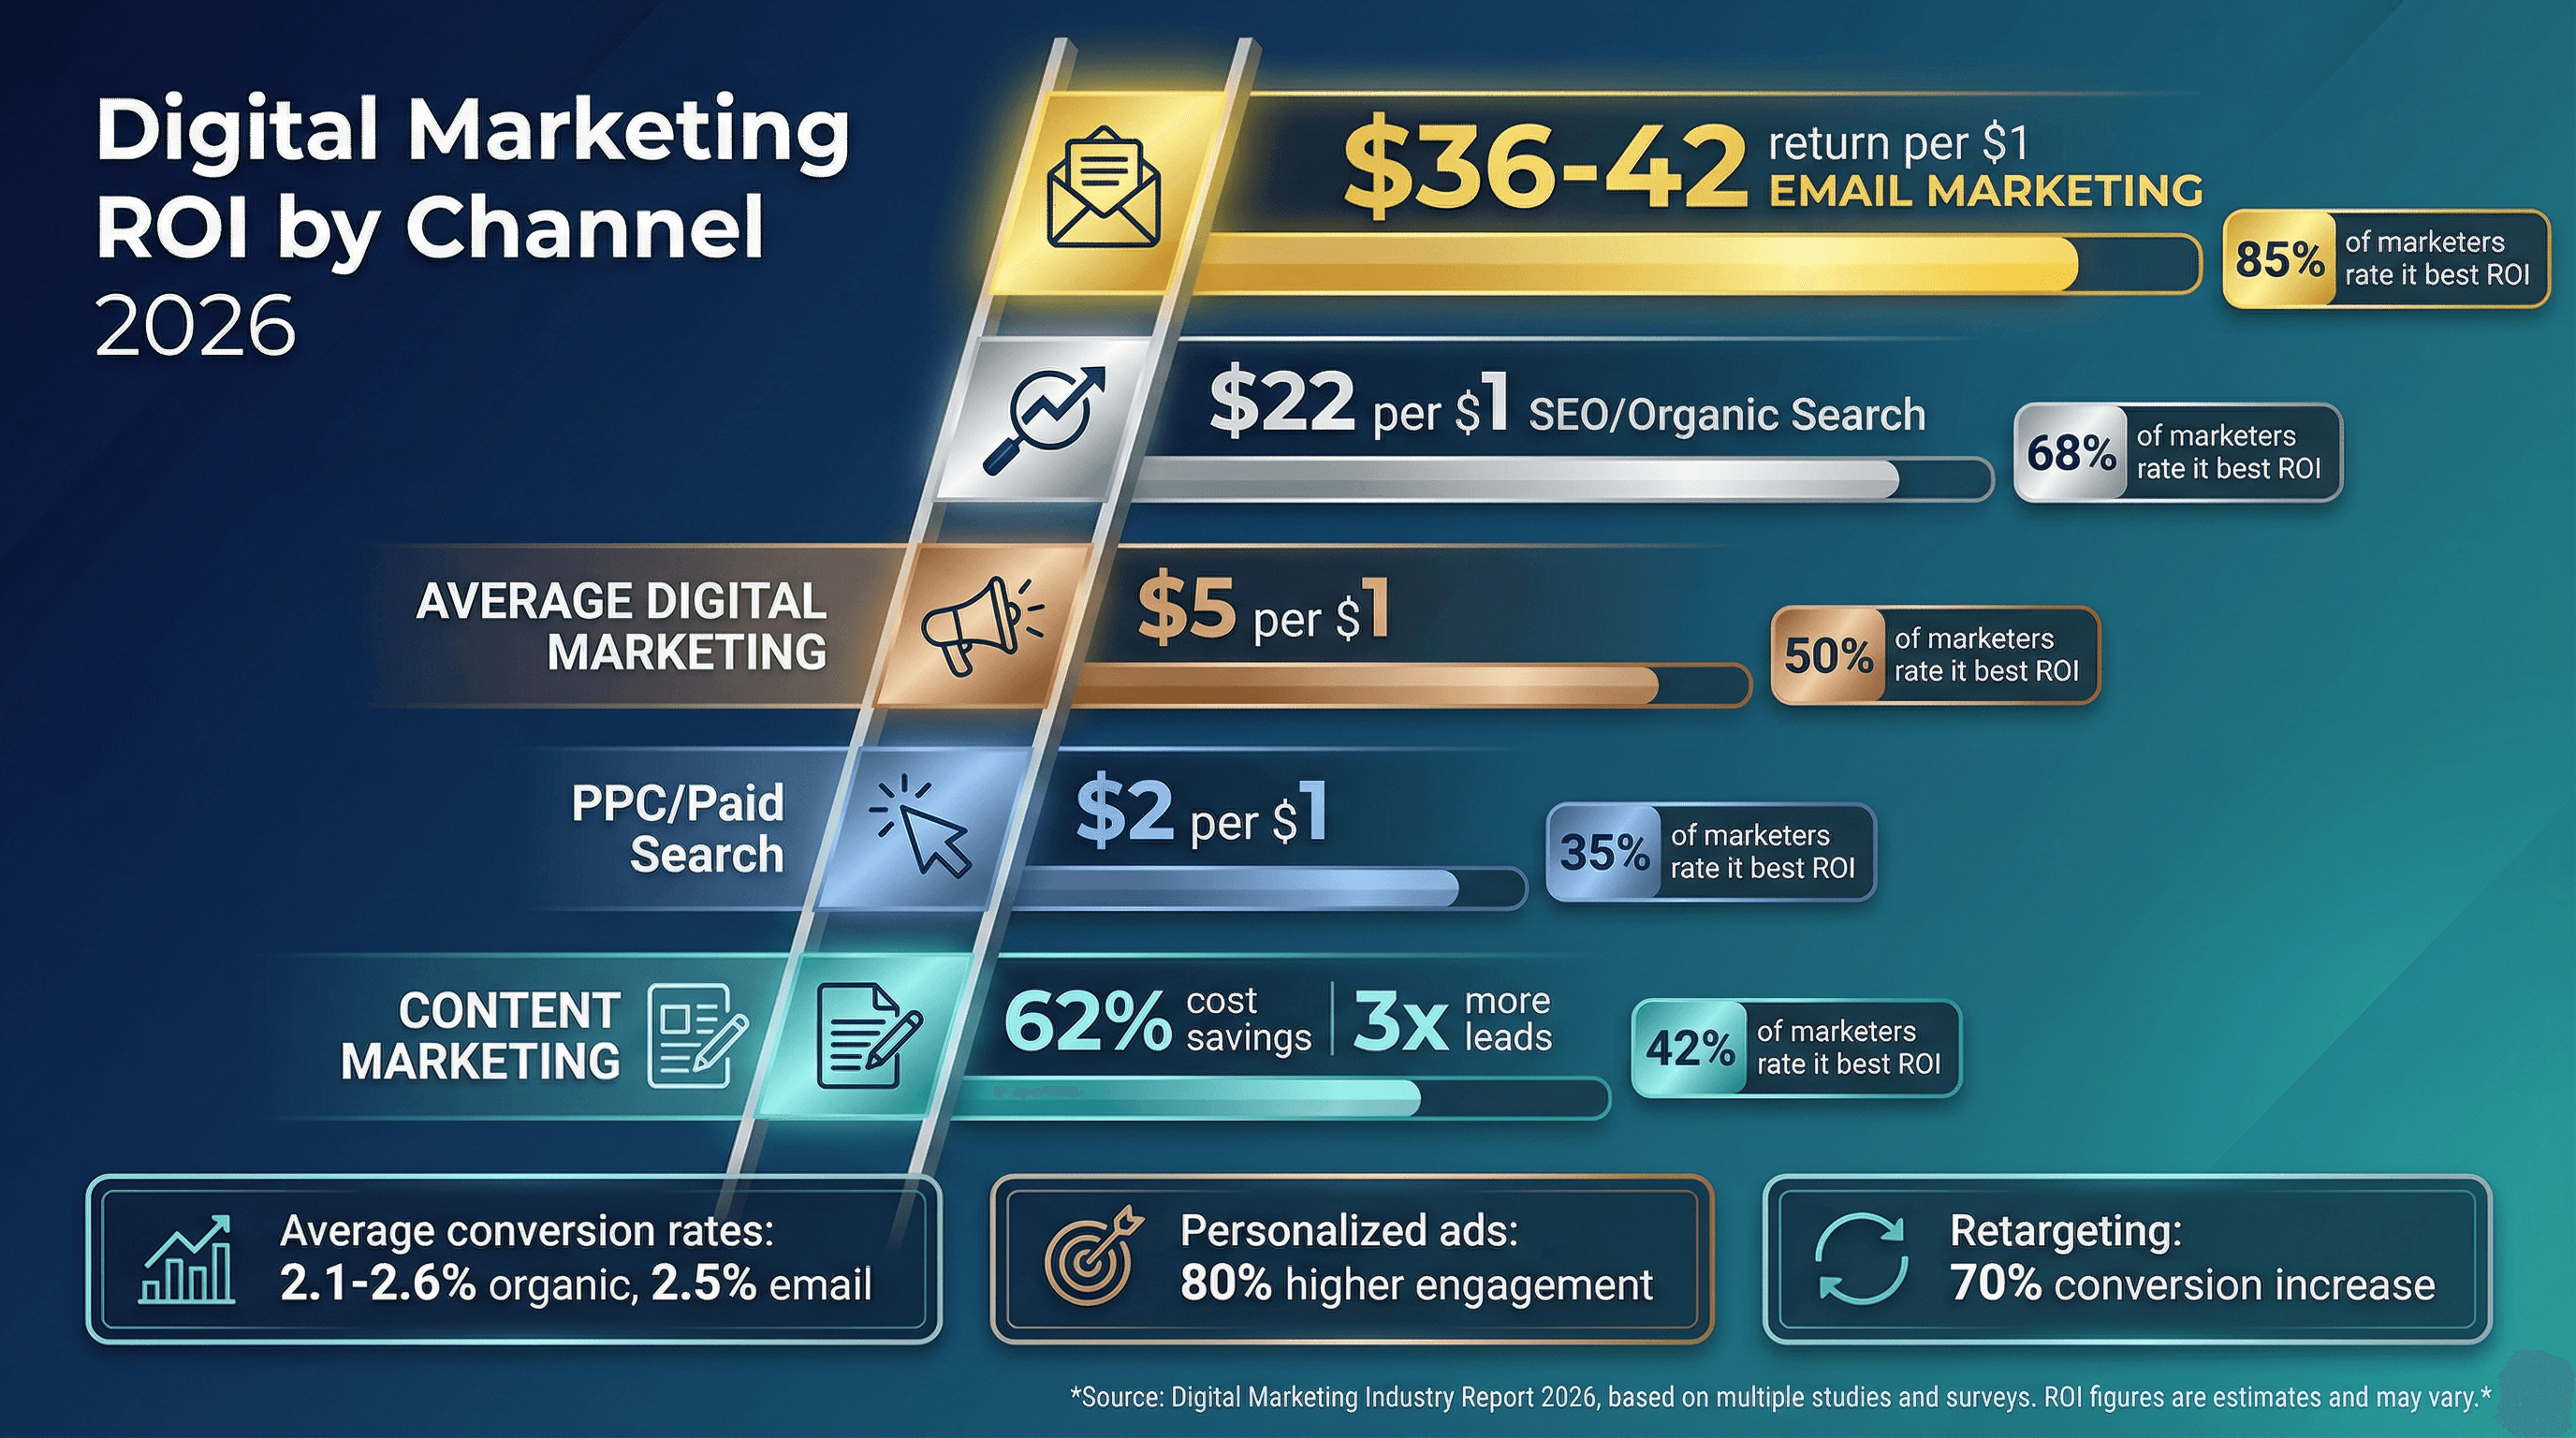
- Average digital marketing ROI: About 5:1 ($5 in revenue for every $1 spent).
- Email marketing: The undisputed ROI champion, delivering .
- SEO (organic search): Roughly ; 49% of marketers say it provides the best ROI.
- PPC (paid search): More modest, averaging about $2 in revenue per $1 spent.
- Content marketing: Costs 62% less than traditional marketing and generates 3× as many leads.
Conversion and Engagement Metrics
- Average website conversion rates: 2.1–2.6% for organic search, 2.5% for email, 1.2–1.5% for paid search, and under 1% for social media and display ads.
- Top organic Google result: Gets about 27% CTR; 75% of users never scroll past page one.
- Personalized ads: Drive 80% higher engagement rates than generic ads.
- Retargeting ads: Can increase conversion rates by up to 70%.
Takeaway: Email and SEO are your ROI workhorses. But even “low ROI” channels can play a key role in the customer journey—just make sure you’re measuring and optimizing every step.
Search Engine Dominance: SEO and Paid Search Stats
 Despite the rise of social, apps, and voice assistants, search engines remain the backbone of digital marketing. If you’re not visible in search, you’re basically invisible—period.
Organic Search and SEO Effectiveness
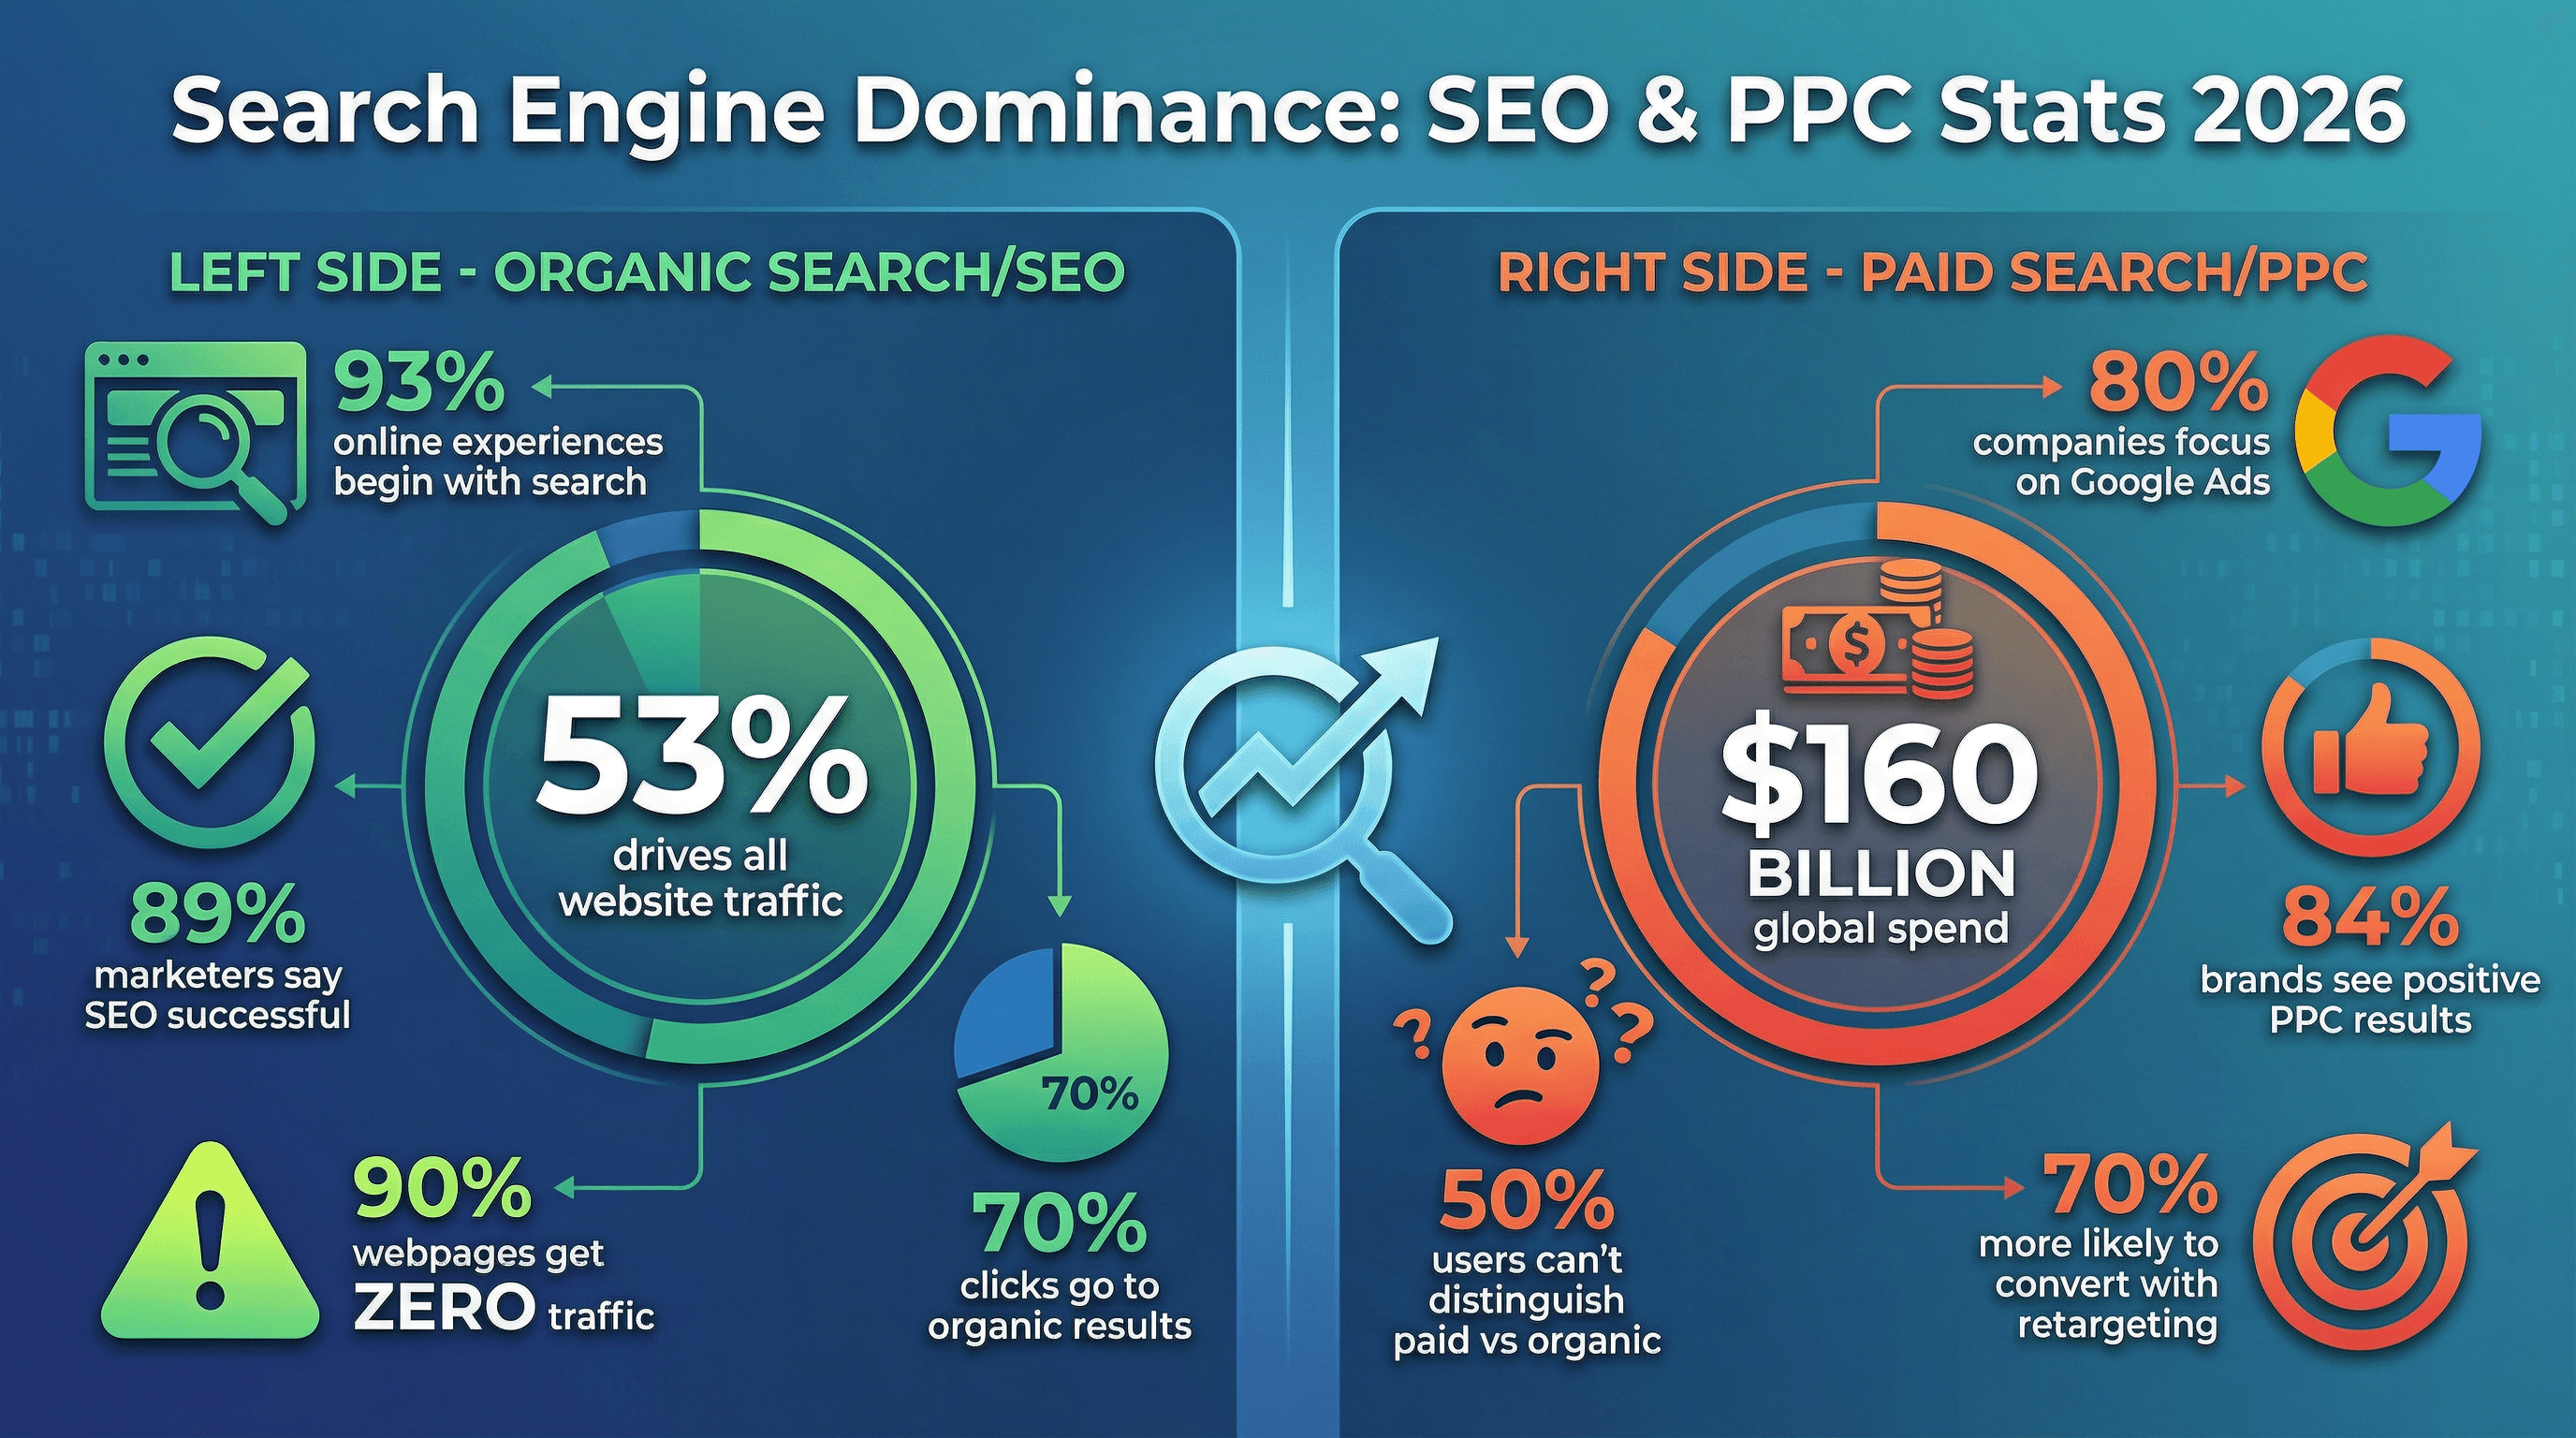
- SEO drives 53% of all website traffic—more than half of visitors arrive via unpaid search results.
- 93% of all online experiences begin with a search query.
- 89% of marketers say SEO is successful in achieving their objectives.
- 70% of all clicks in Google search go to organic results.
- 90% of webpages get zero organic traffic from Google—content and optimization are non-negotiable.
Paid Search and User Perceptions
- 80% of companies focus on Google Ads for their PPC campaigns.
- Paid search spend: Over $160 billion globally in 2024, and rising.
- 84% of brands see positive results from PPC.
- 50% of users can’t distinguish a paid search ad from an organic result.
- Retargeting on search: Customers are 70% more likely to convert when retargeted.
Takeaway: SEO and PPC work best together. Dominate both paid and organic results for your most important keywords, and you’ll own the customer journey from search to sale.
Social Media Marketing: Reach, Engagement, and Ad Spend
 Social media isn’t just for memes and cat videos anymore. It’s where brands are built, communities are nurtured, and sales are made—often in the same scroll.
Social Media Usage and Audience Growth
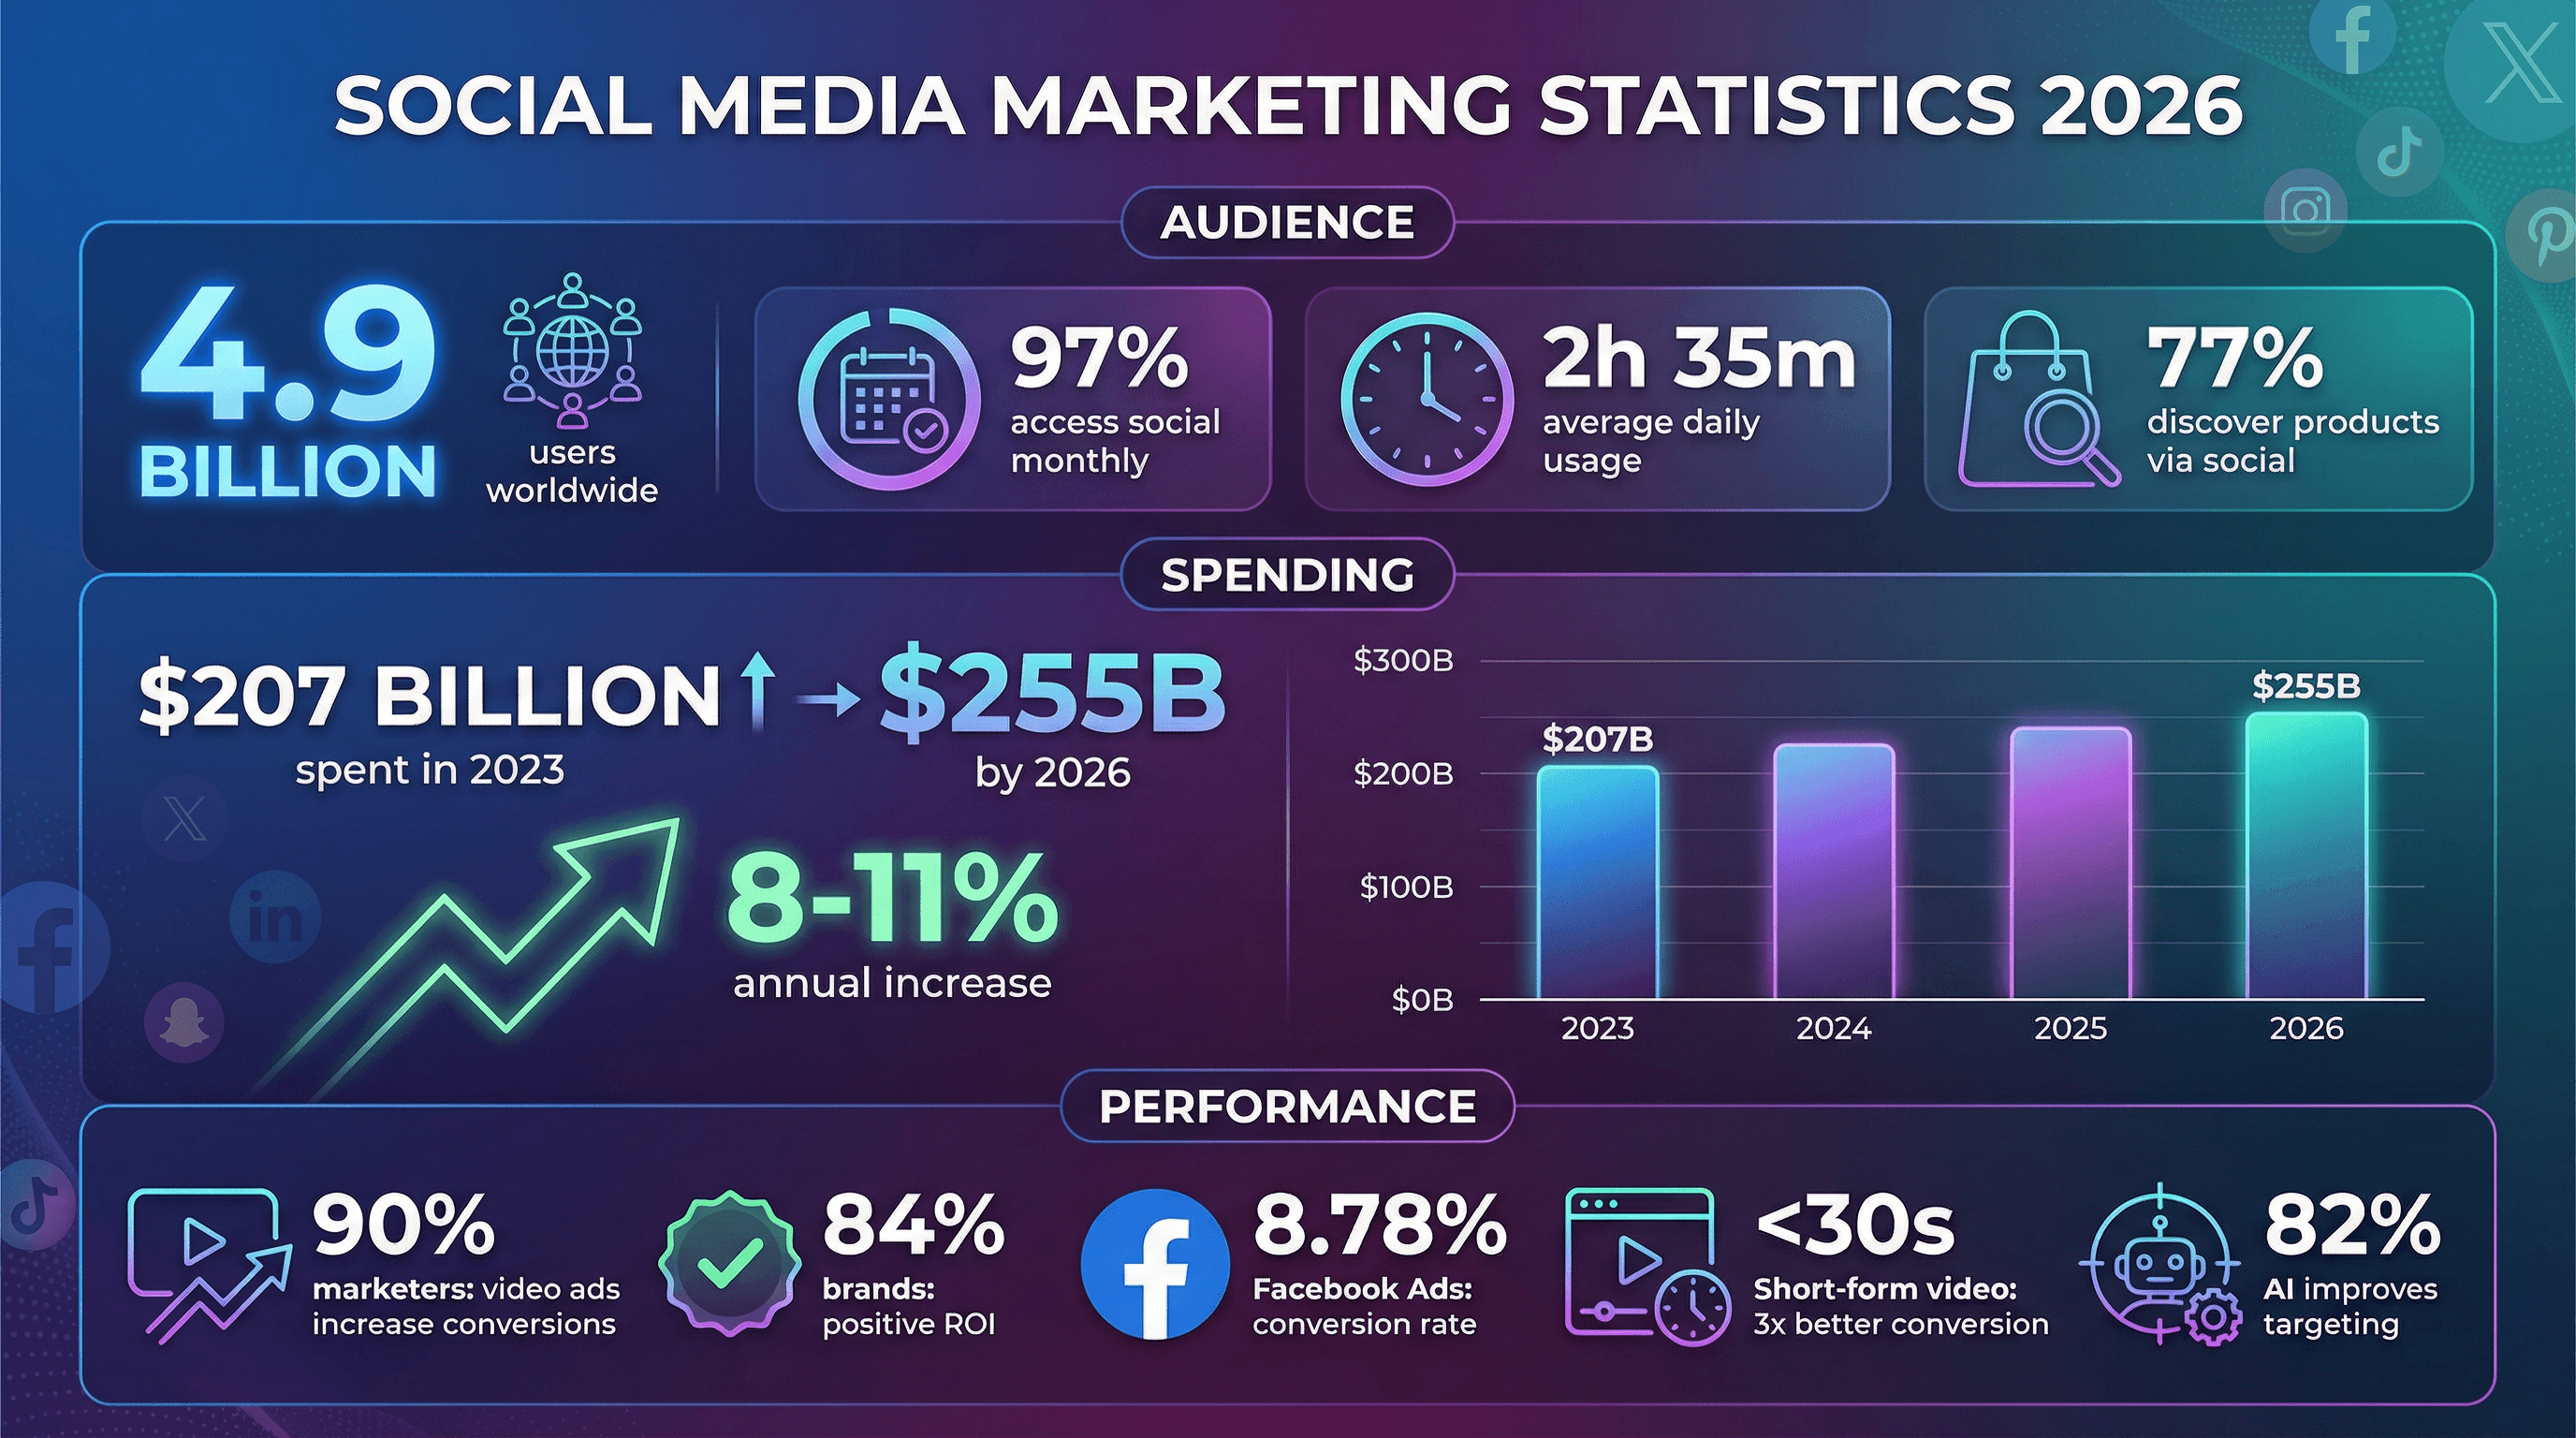
- 4.9 billion social media users worldwide as of 2023, projected to surpass 5 billion by 2025.
- 97% of online consumers access social media at least once a month.
- Average adult spends 2 hours 35 minutes per day on social media.
- For ages 18–44, social is the preferred platform for discovering new products.
- 40% of B2B marketers cite LinkedIn as their top source of high-quality leads.
- 77% of consumers discover new products through social ads or posts.
Social Media Advertising Spend and ROI
-
$207 billion spent on paid social media advertising in 2023, projected to exceed $255 billion by 2026.
-
Social ad investment is growing at 8–11% annually.
-
90% of marketers say video ads on social have increased their conversions.
-
84% of brands report positive ROI from social media marketing.
-
Facebook Ads average conversion rate: 8.78%.
-
Short-form video ads (<30s) convert 3× better than longer videos.
-
90% of marketers say first-party data improves ad performance.
-
82% of marketers say AI tools have improved their ad targeting accuracy.
Takeaway: Social media is a must-have, not a nice-to-have. Prioritize video, leverage first-party data, and blend organic and paid strategies for maximum impact.
Local Digital Marketing: Hyper-Targeted Stats
 Not every campaign needs to reach the whole world—sometimes, you just need to reach the folks down the street. Local digital marketing is your secret weapon for driving foot traffic and in-person sales.
Local Search and Mobile Behavior
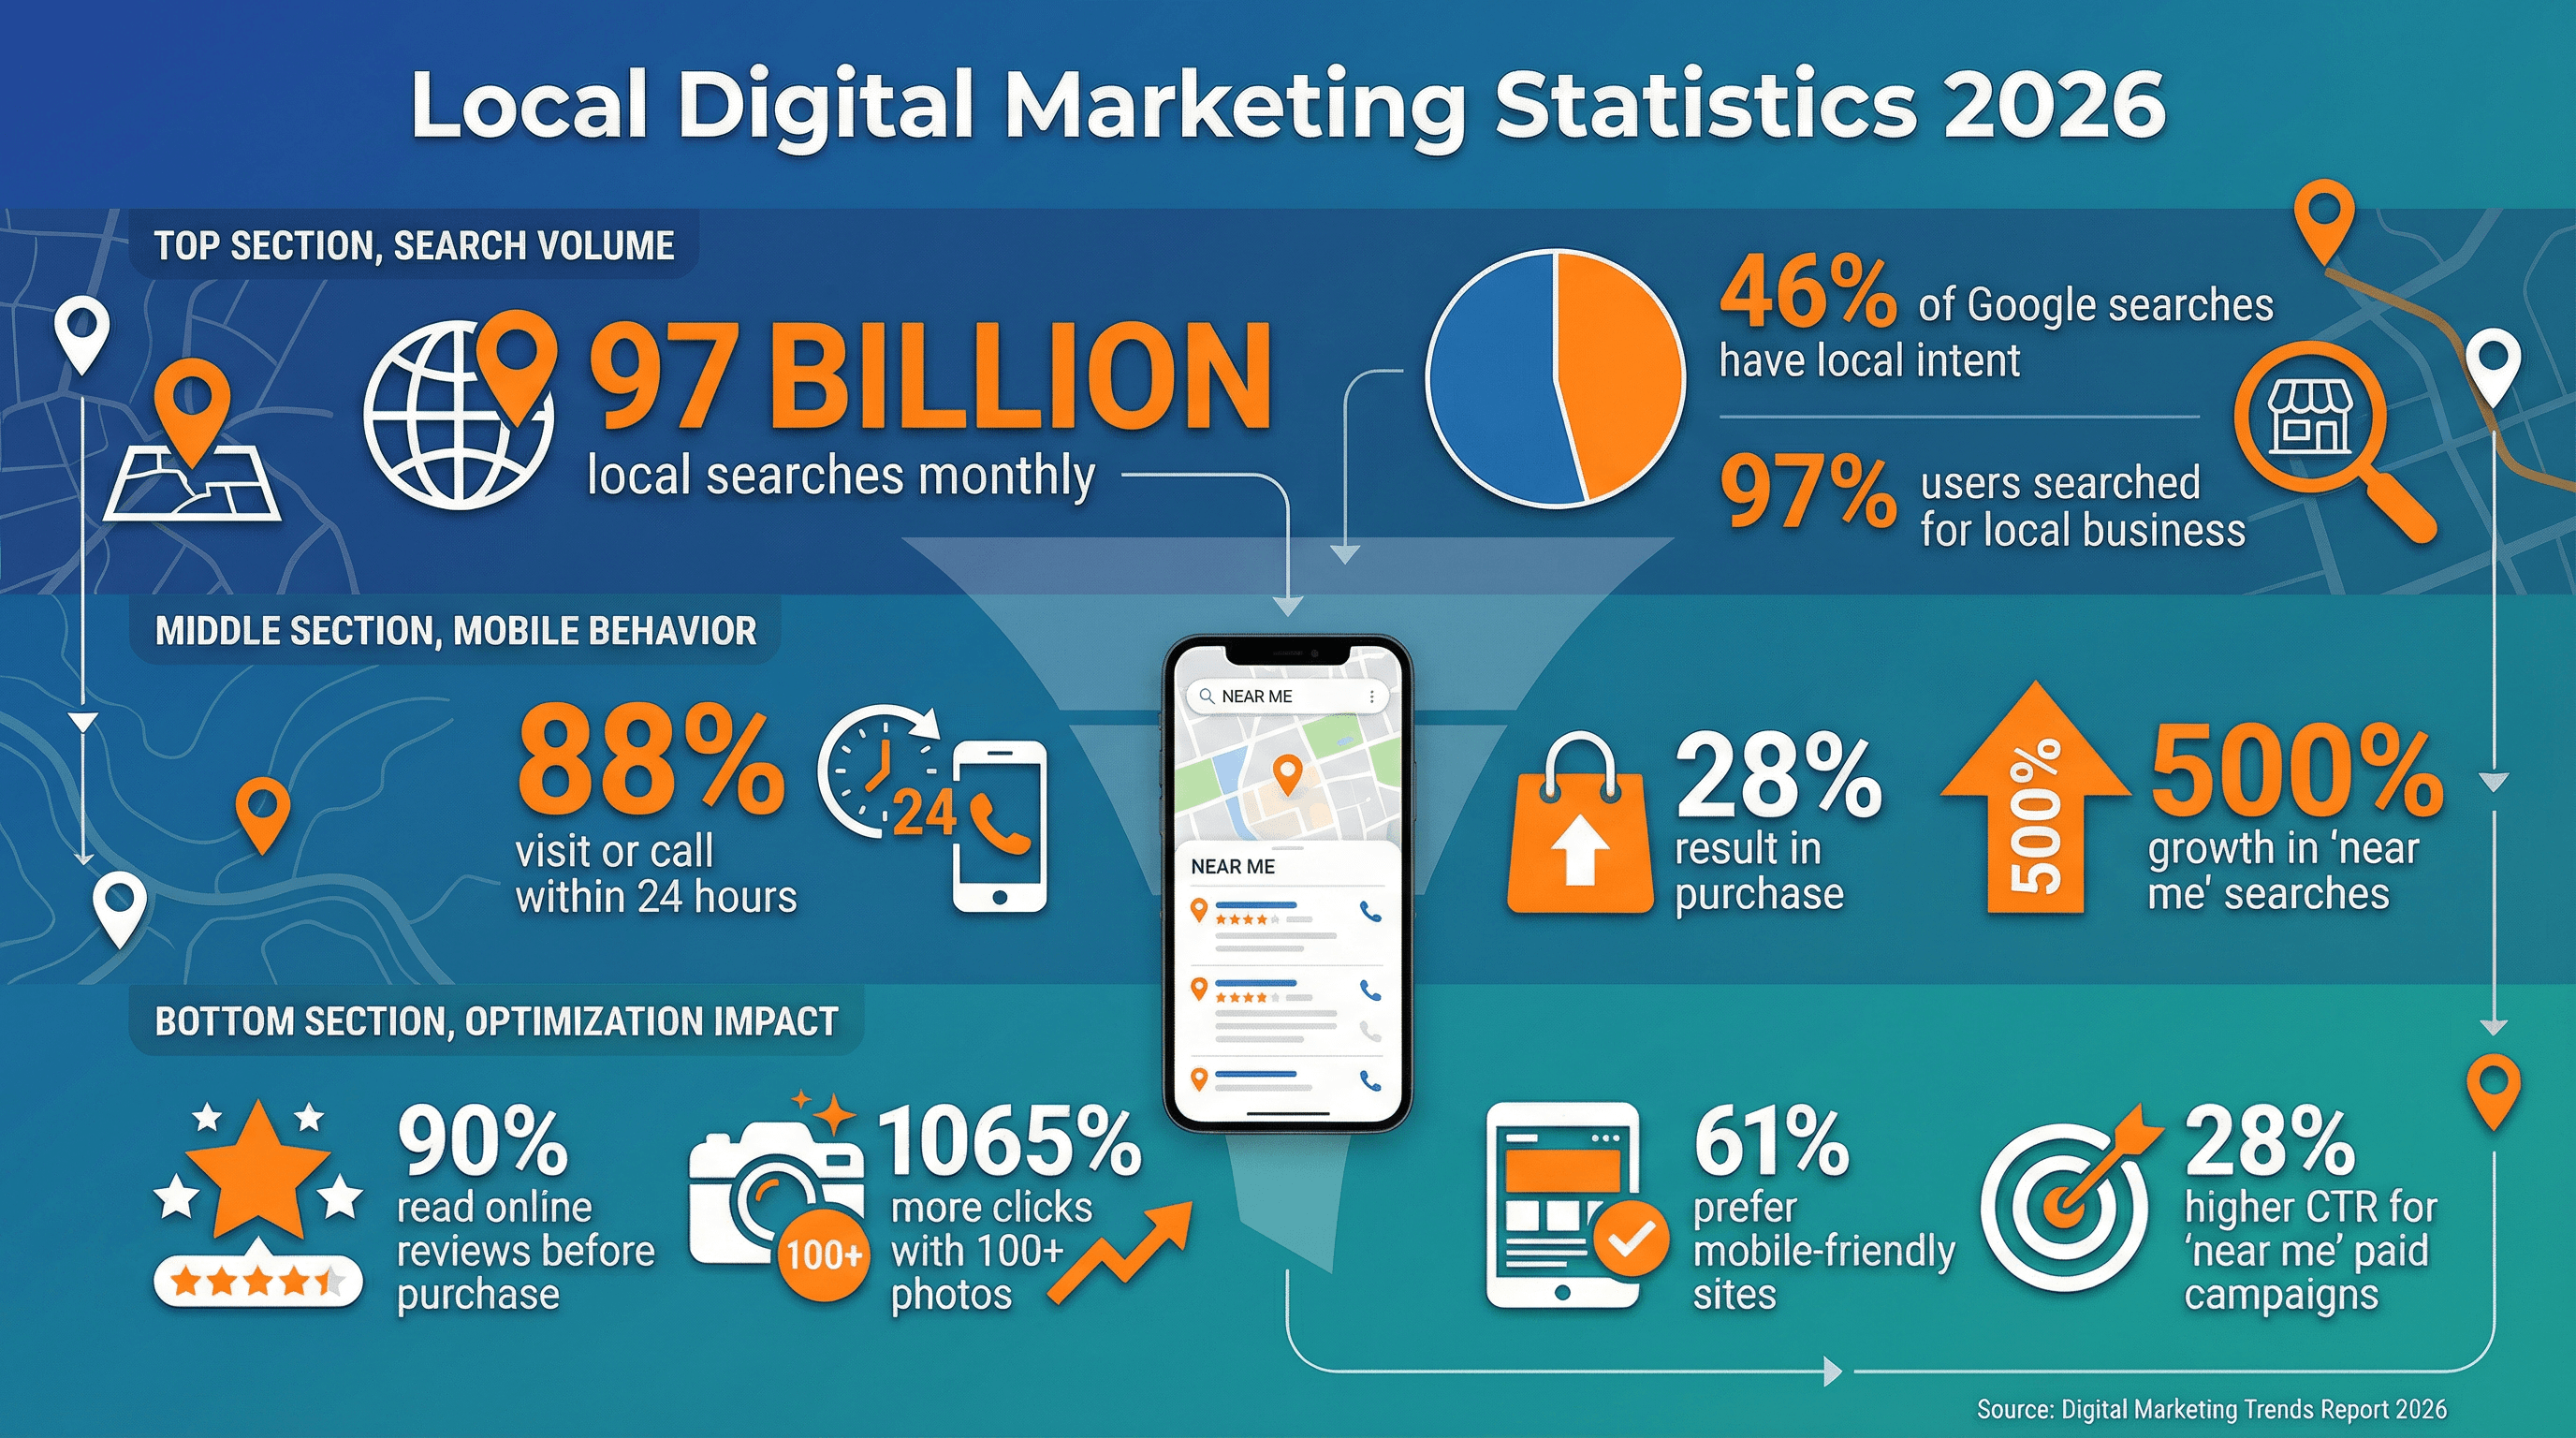
- 97 billion local searches are conducted online each month.
- 46% of all Google searches have local intent.
- 97% of users have searched online for a local business.
- 88% of mobile users who search for a local business visit or call within 24 hours.
- 28% of local searches result in a purchase.
- “Near me” searches have grown by over 500% in recent years.
- Over 90% of people read online reviews before making a local purchase decision.
- Google Business Profile listings with 100+ photos receive 1065% more clicks than those with only a few.
- 61% of mobile searchers are more likely to contact a local business with a mobile-friendly site.
- “Near me” paid search campaigns see up to 28% higher CTR than non-localized campaigns.
Takeaway: Local SEO and mobile optimization aren’t just for small businesses—they’re for any brand that wants to win “I need it now” customers.
Video and Content Marketing: Engagement and Results
 If content is king, video is the king’s favorite child. In 2026, brands are acting more like media companies, and the stats show why.
Video Marketing Impact
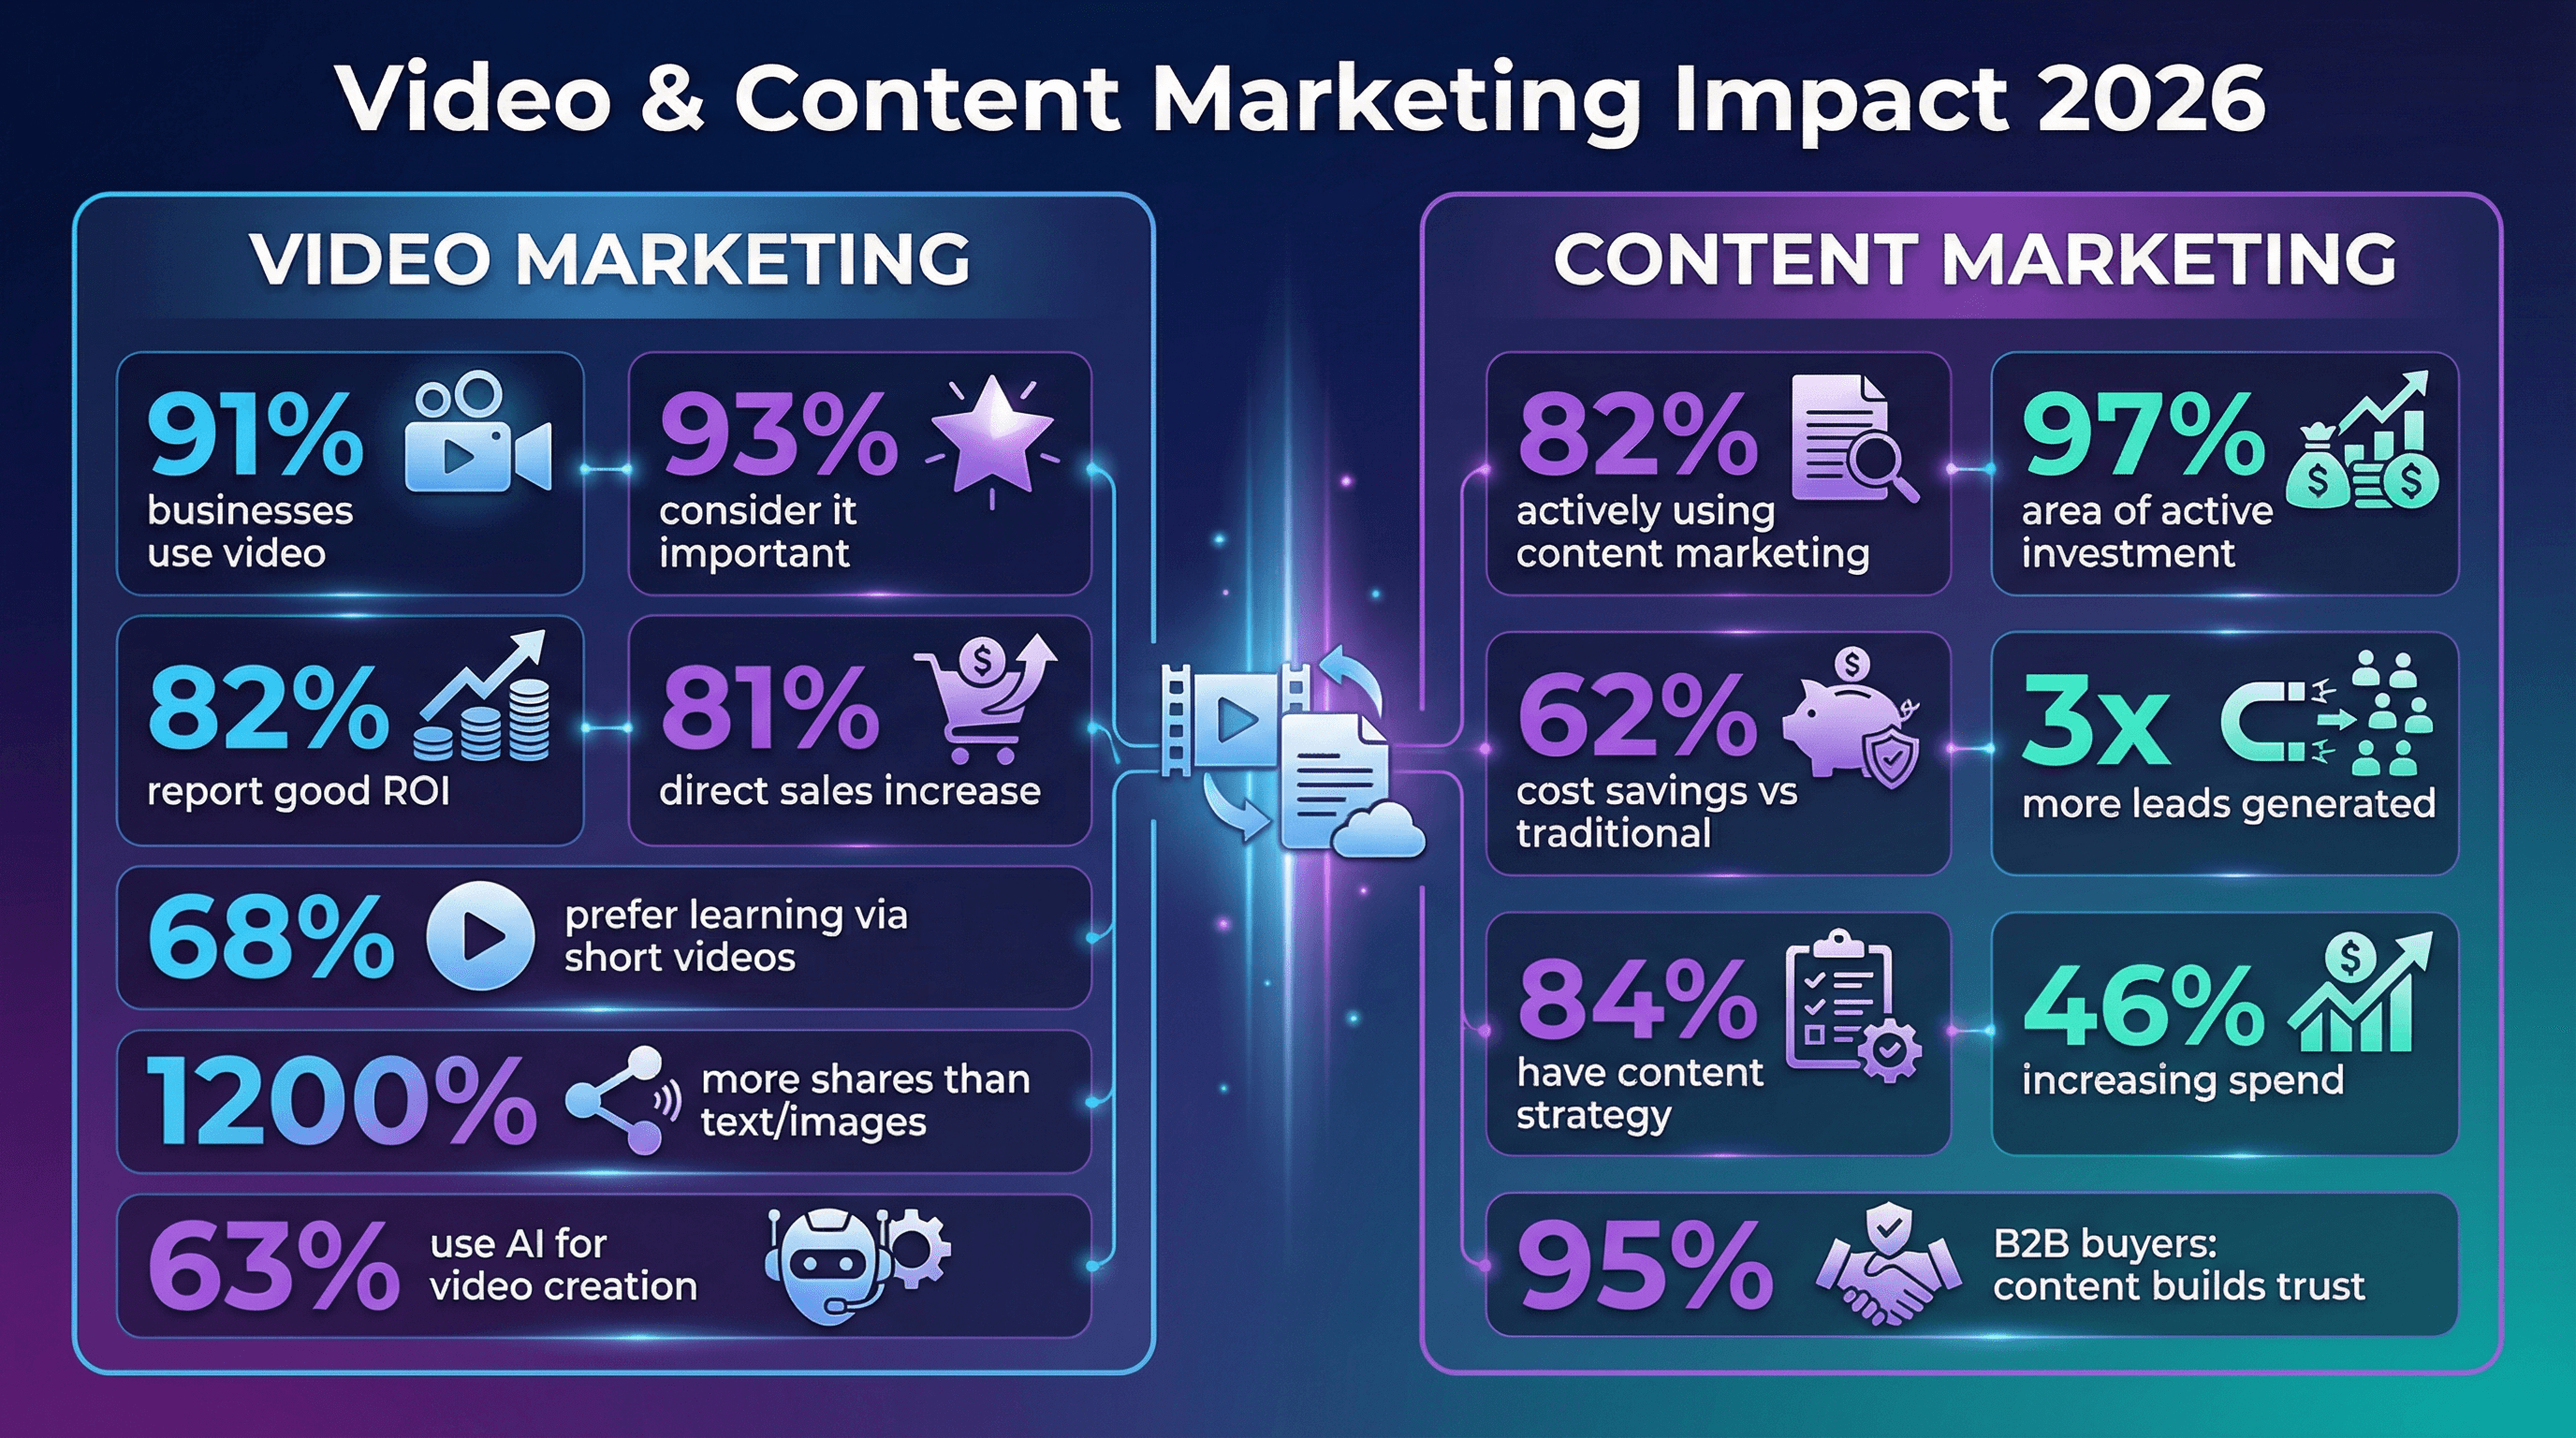
- 91% of businesses use video as a marketing tool in 2025–2026.
- 93% of marketers consider video an important part of their strategy.
- 82% of marketers say video marketing has given them a good ROI.
- 81% report video content directly increased sales.
- 68% of people prefer learning about new products via short videos.
- Videos generate 1200% more shares on social media than text and image posts combined.
- 63% of video marketers have used AI tools to create or edit videos in 2025.
Content Marketing Strategy and Results
- 82% of companies are actively using content marketing.
- 97% of marketers say content marketing is an area of active investment.
- Content marketing costs 62% less than outbound marketing and generates 3× as many leads.
- 84% of organizations have a content marketing strategy in place.
- 46% of businesses plan to increase content creation spend year over year.
- 95% of B2B buyers say content helps them evaluate a company as trustworthy.
Takeaway: Invest in content and video for long-term, compounding returns. Repurpose across formats, measure what matters, and use AI to scale your efforts.
Email Marketing and Automation: Still Going Strong
 Email might not be the shiniest channel, but it’s the one that keeps on delivering—especially when paired with automation and personalization.
Email Marketing Reach and Effectiveness
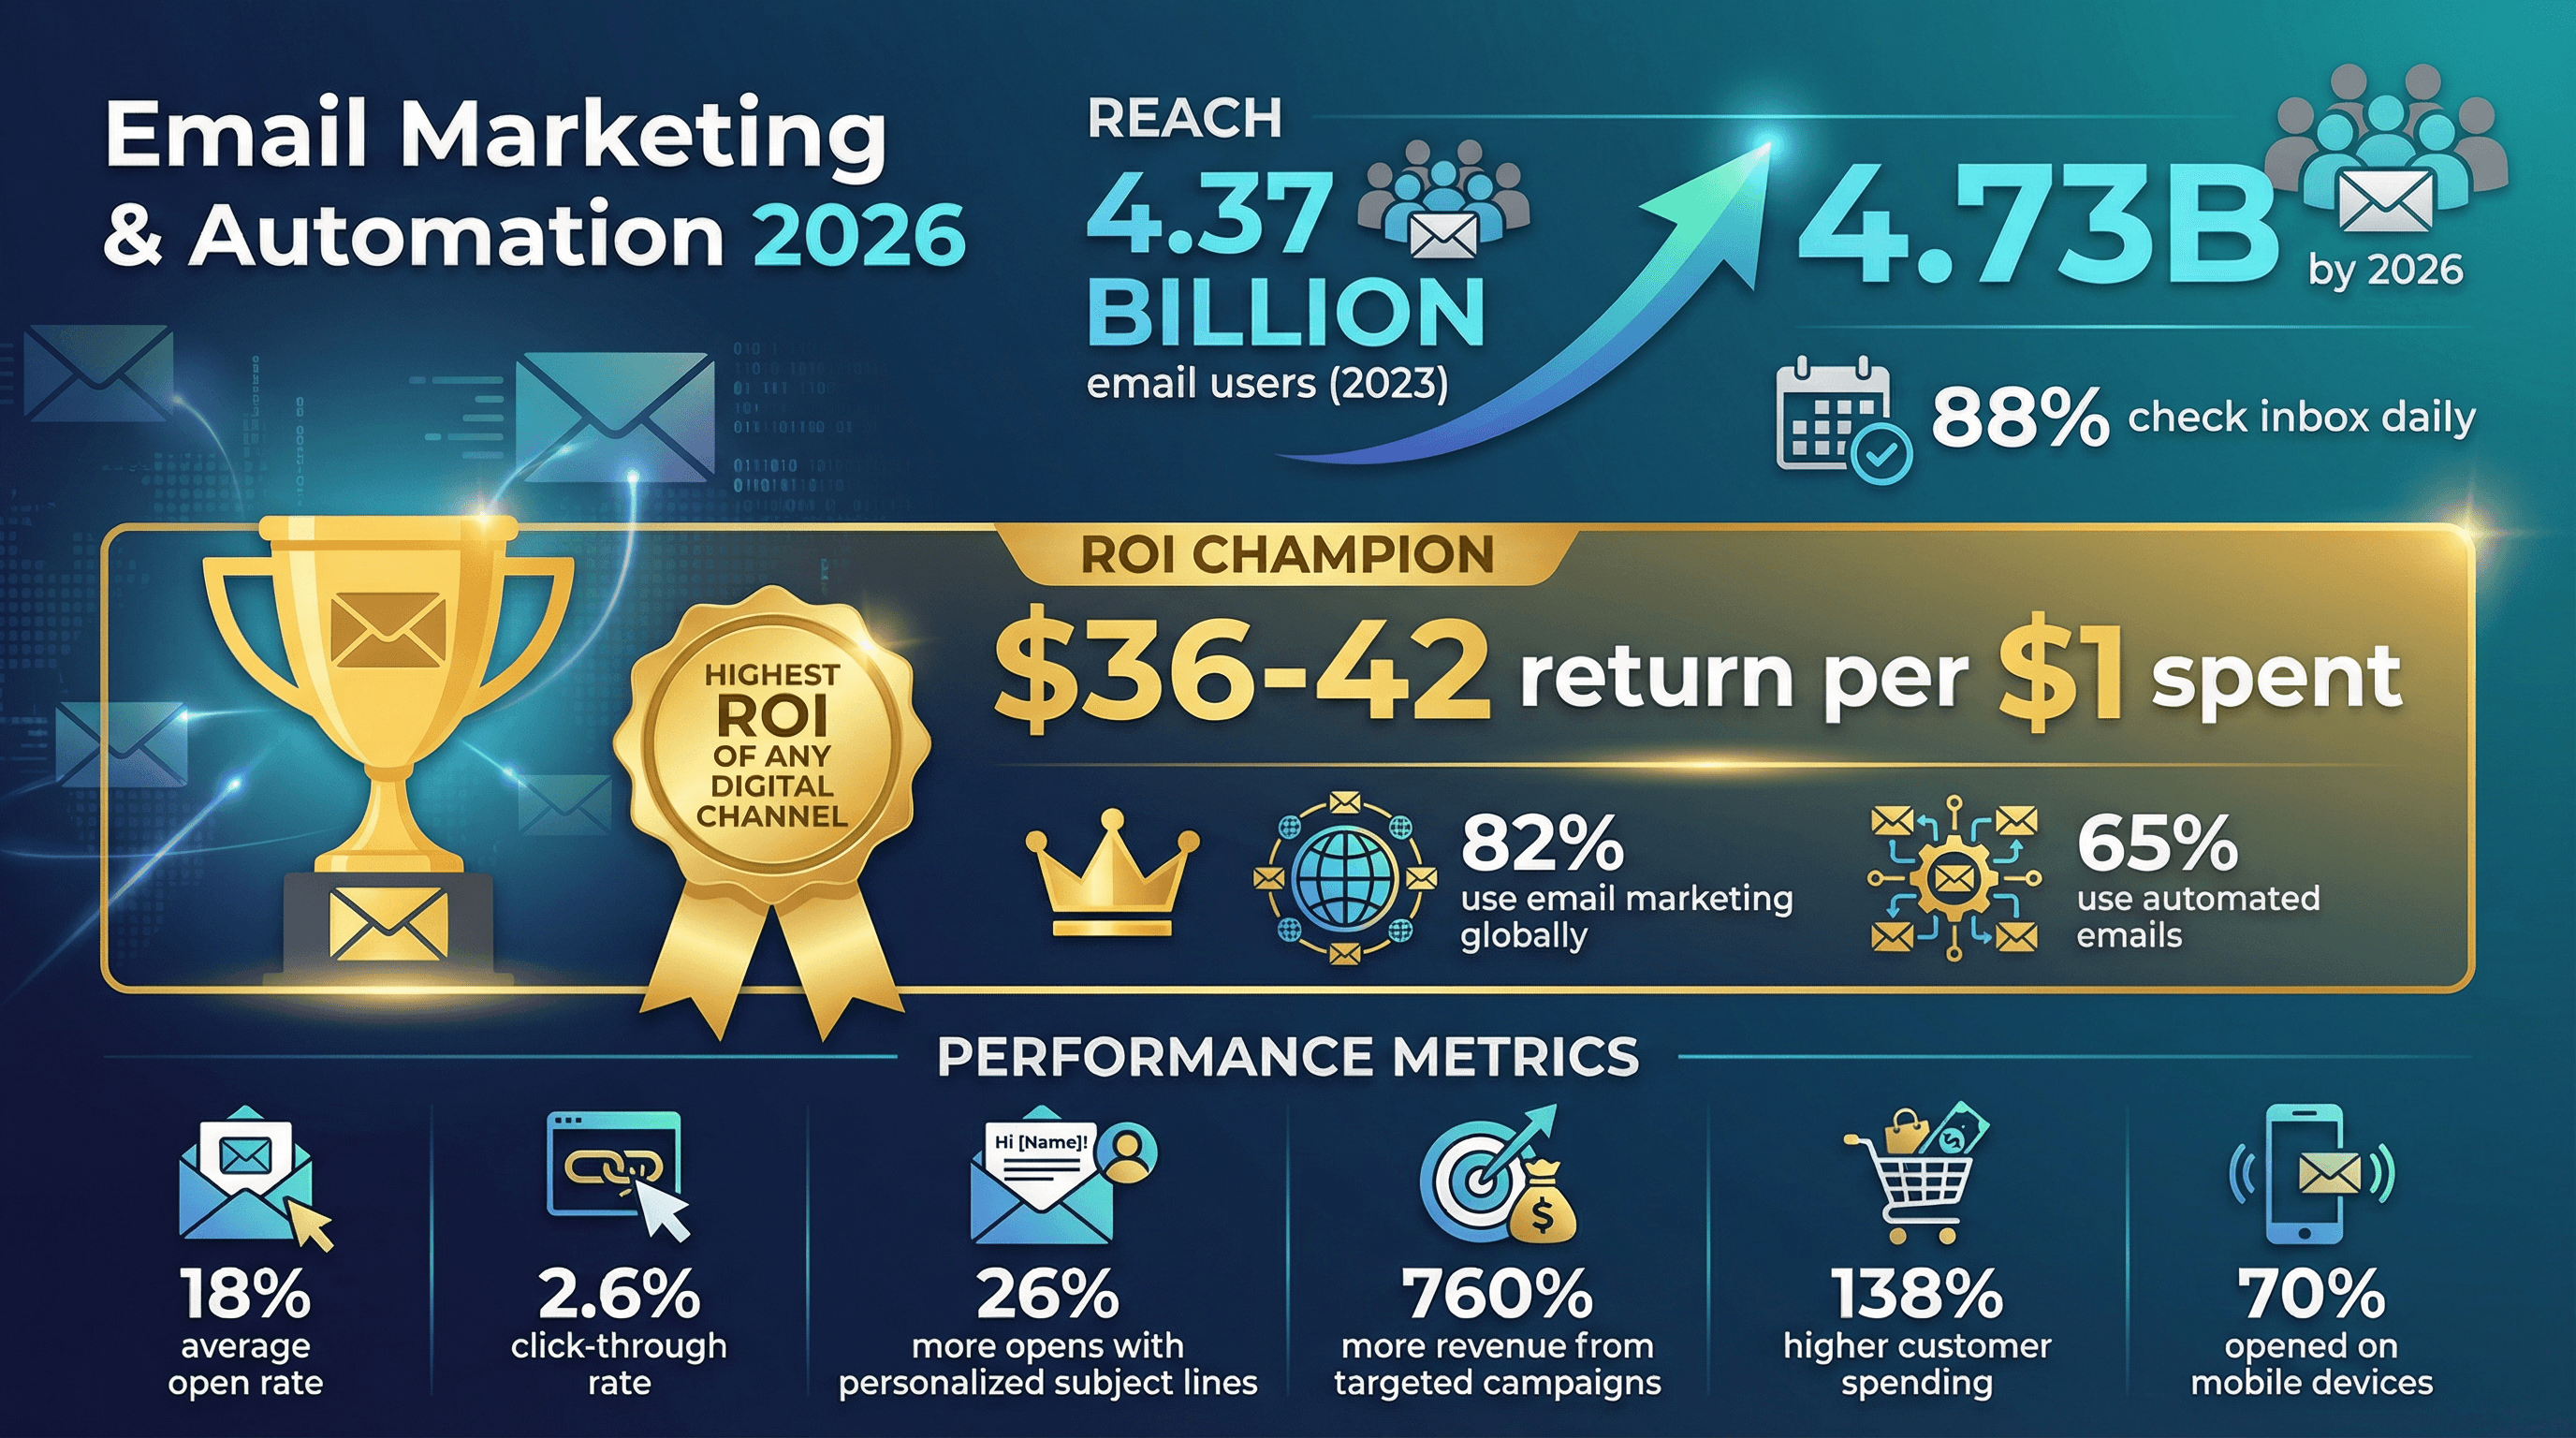
- 4.37 billion email users worldwide in 2023, expected to grow to 4.73 billion by 2026.
- Email marketing boasts the highest ROI of any digital channel—.
- Average open rates: 18%; click-through rates: 2.6% globally.
- 88% of email users check their inbox at least daily.
- 82% of digital marketers use email marketing globally; 65% use automated emails.
- Emails with personalized subject lines are 26% more likely to be opened.
- Targeted email campaigns can drive 760% more revenue than batch-and-blast emails.
- Customers spend 138% more on average when marketed to via email.
- Over 70% of emails are opened on mobile devices.
Takeaway: Email is your direct line to customers. Automate, personalize, and optimize for mobile to keep your list engaged and converting.
Digital Advertising Challenges: Ad Blockers, Privacy, and Trust
 It’s not all sunshine and conversions—digital marketers face real hurdles in 2026, from ad blockers to privacy regulations and consumer skepticism.
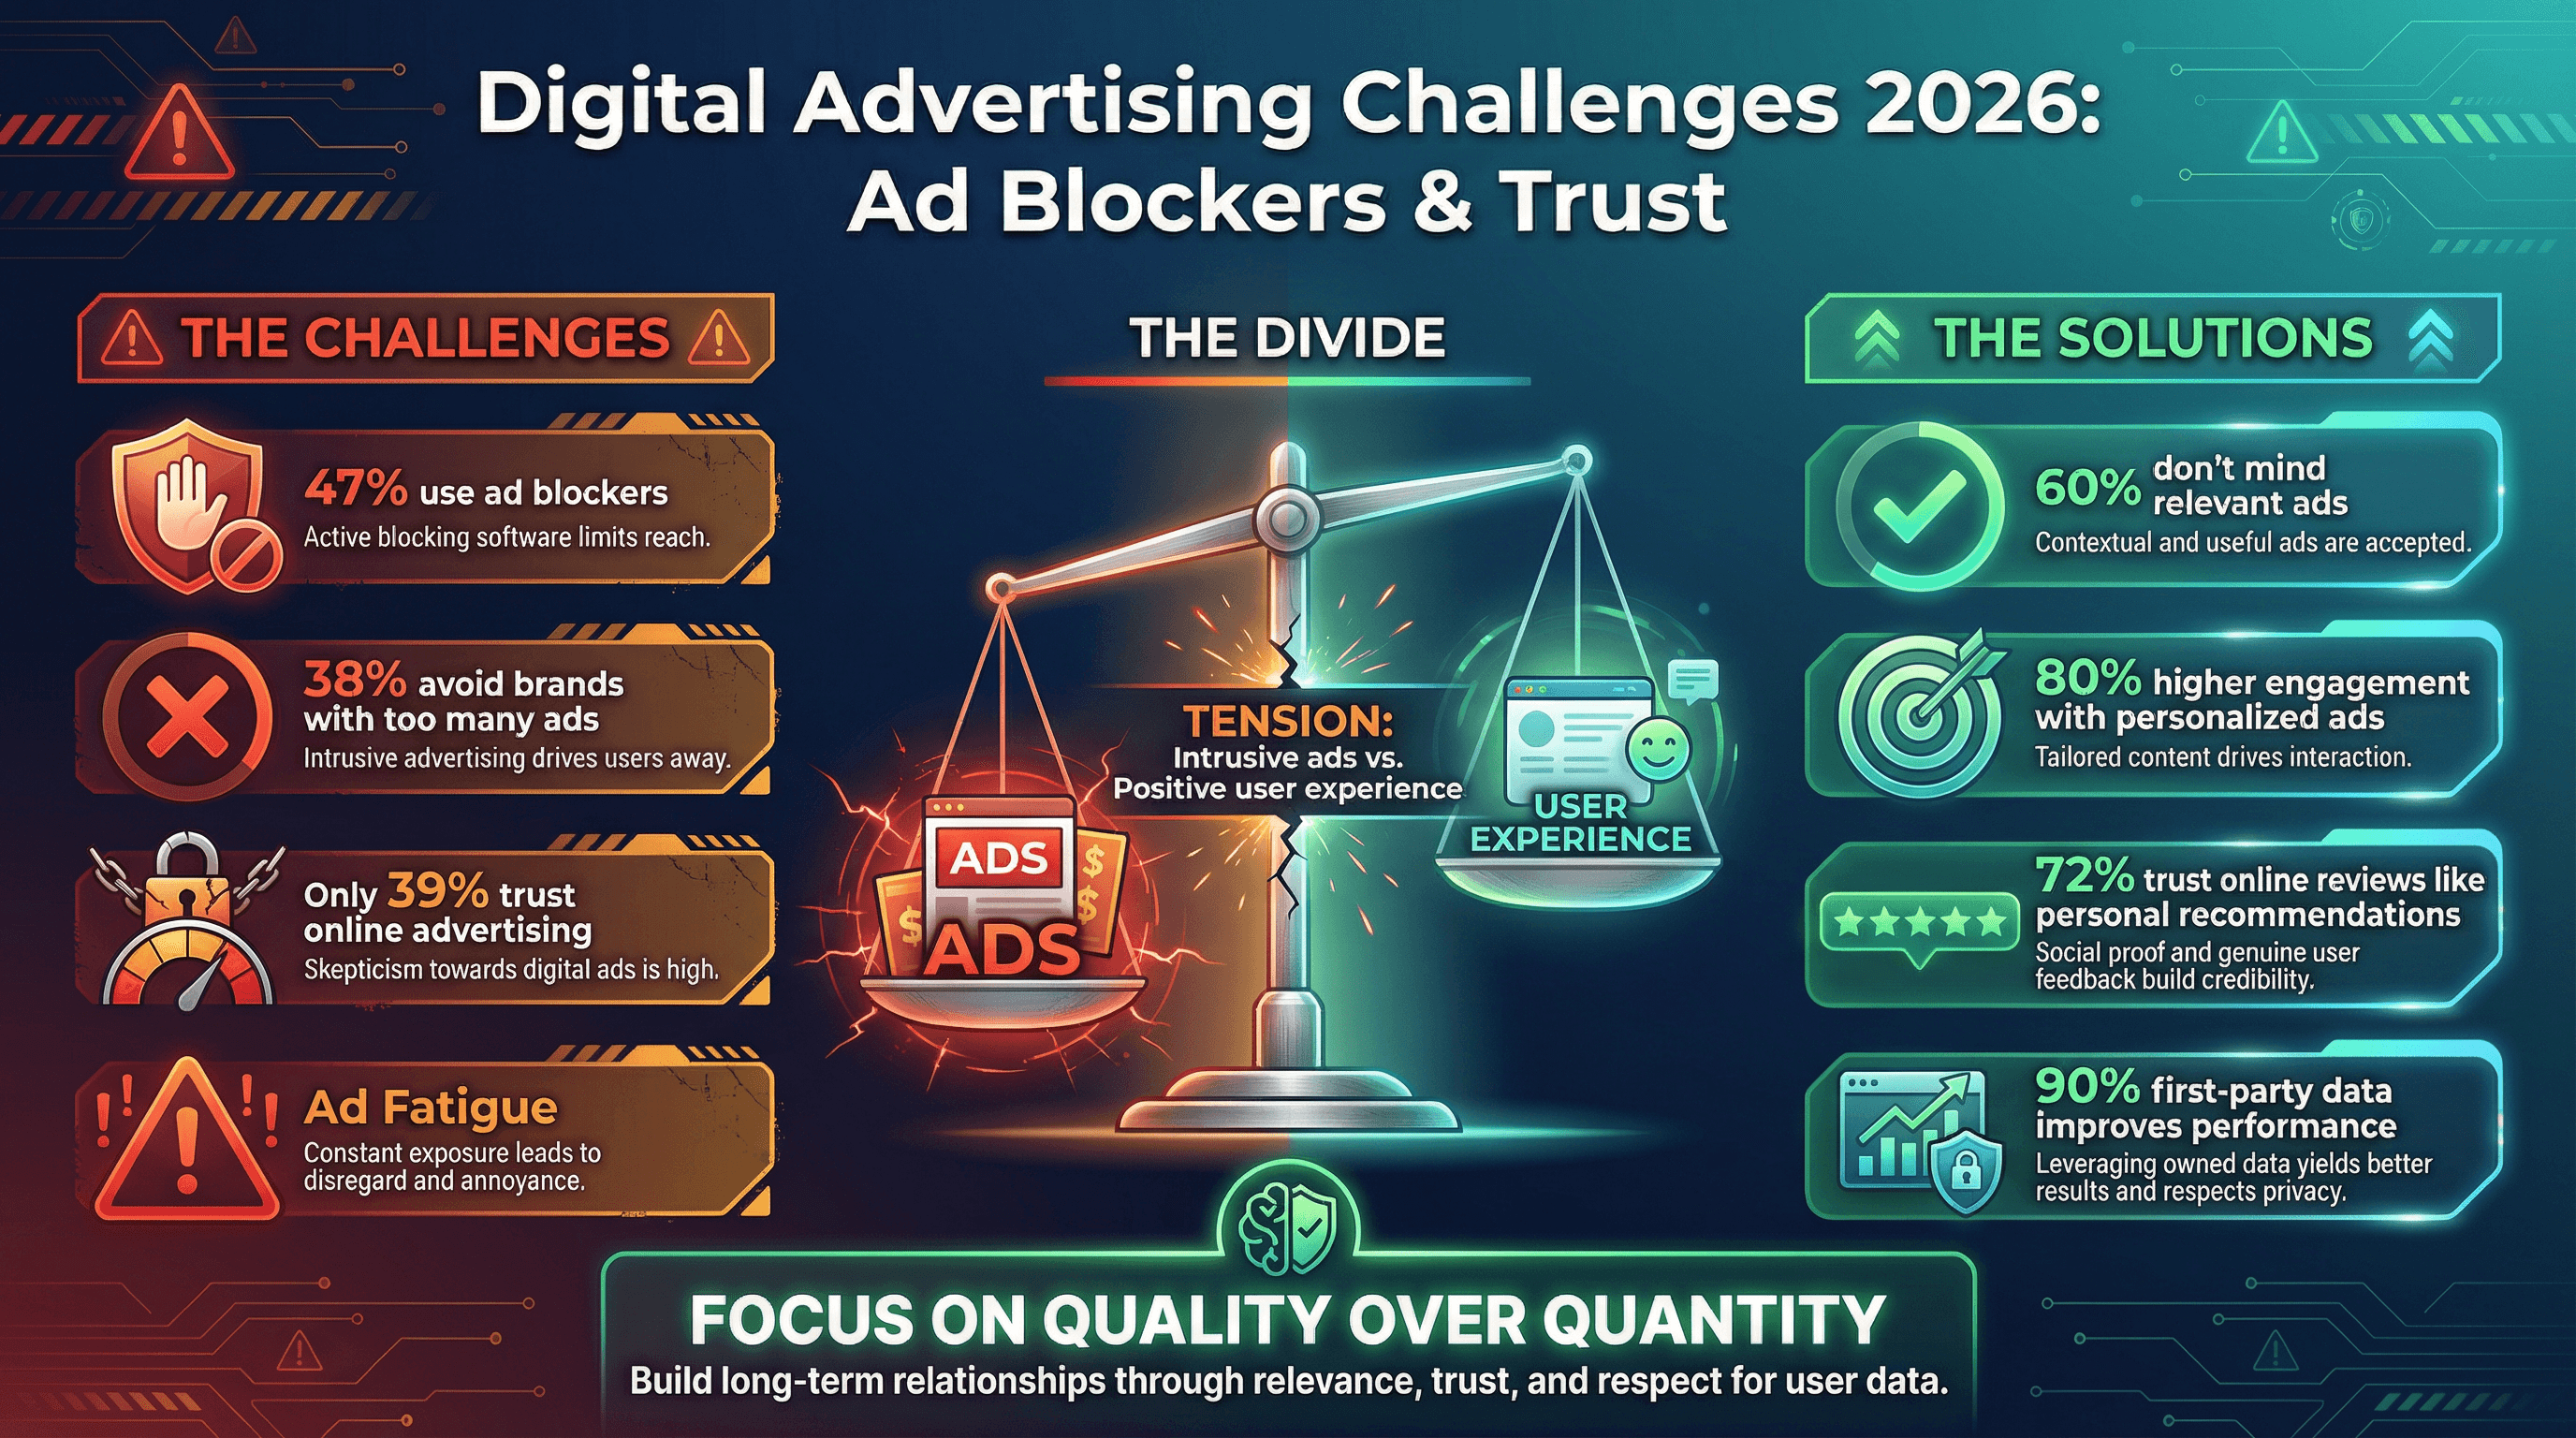
Ad Blocker Adoption and Impact
- 47% of internet users employ some form of ad blocker.
- 38% of users say too many ads make them avoid certain brands.
- Only 39% of consumers in 2025 report that they trust online advertising to at least a moderate degree.
- 60% of internet users don’t mind seeing ads, as long as they’re relevant.
- Personalized ads can yield 80% higher engagement rates.
- 72% of consumers trust online reviews as much as personal recommendations.
- 90% of marketers say leveraging first-party data improves ad performance.
Takeaway: Respect your audience’s attention and privacy. Focus on quality over quantity, leverage first-party data, and build trust through transparency and value.
The Future of Digital Marketing: AI, Automation, and Emerging Trends
If you’re not experimenting with AI and automation yet, you’re about to get lapped by the competition. The future is here, and it’s powered by algorithms (and a healthy dose of human creativity).
AI and Automation in Digital Marketing
- 88% of marketers use some form of AI in their day-to-day roles.
- 79% of CMOs say AI is now essential for gaining a competitive advantage.
- AI in marketing market size: $47 billion in 2025, projected to exceed $107 billion by 2028.
- Over 80% of all digital ad spend will be programmatic by 2026.
- Dynamic creative optimization (DCO) can boost CTR by 32%.
- 63% of video marketers have used AI tools to create or edit videos in 2025.
- Companies using advanced personalization can see 10–20% more efficient marketing spend and up to 20% higher conversion rates.
- Over 1 billion people will regularly use AR on mobile by 2025.
- 90% of businesses report faster complaint resolution with chatbots.
Takeaway: AI and automation are your new teammates—let them handle the heavy lifting so you can focus on strategy, creativity, and building real relationships.
Key Takeaways: What These Digital Marketing Statistics Mean for 2026
Let’s bring it all together. Here’s what these stats mean for your 2026 digital marketing strategy:
- Digital is the default: With nearly 70% of ad spend going online, prioritize digital in your budget and strategy.
- Double down on high-ROI channels: SEO, email, and content marketing are your best bets for sustainable growth.
- Test, measure, optimize: Small improvements in conversion or engagement can drive big results—never stop iterating.
- Own your presence on search and social: Be everywhere your customers are looking, from Google to TikTok.
- Think local and personal: Local SEO and hyper-personalized campaigns win “ready to buy” customers.
- Build trust: Transparency, reviews, and authentic content are your antidotes to ad fatigue and skepticism.
- Embrace AI and automation: Use technology to scale, but keep the human touch front and center.
- Stay agile: The only constant is change—keep learning, experimenting, and adapting.
If you’re looking for more practical guides on data-driven marketing, check out the for deep dives on topics like , , and .
Citable Sources and Further Reading
Want to dig deeper or cite these stats in your next strategy deck? Here are some of the top sources referenced in this roundup:
For more actionable tips and the latest in automation, check out —our AI web scraper makes gathering competitive intelligence and campaign data a breeze (and yes, there’s a for that).
Final thought: In digital marketing, the only thing that ages faster than a meme is last year’s strategy. Keep these stats handy, stay curious, and let data—not guesswork—lead your campaigns in 2026 and beyond. And if you ever need a little help automating your research or scraping the web for insights, you know where to find me (hint: ).